> ## Documentation Index
> Fetch the complete documentation index at: https://www.checklyhq.com/docs/llms.txt
> Use this file to discover all available pages before exploring further.
# Performance & Web Vitals
> Web Vitals for browser checks
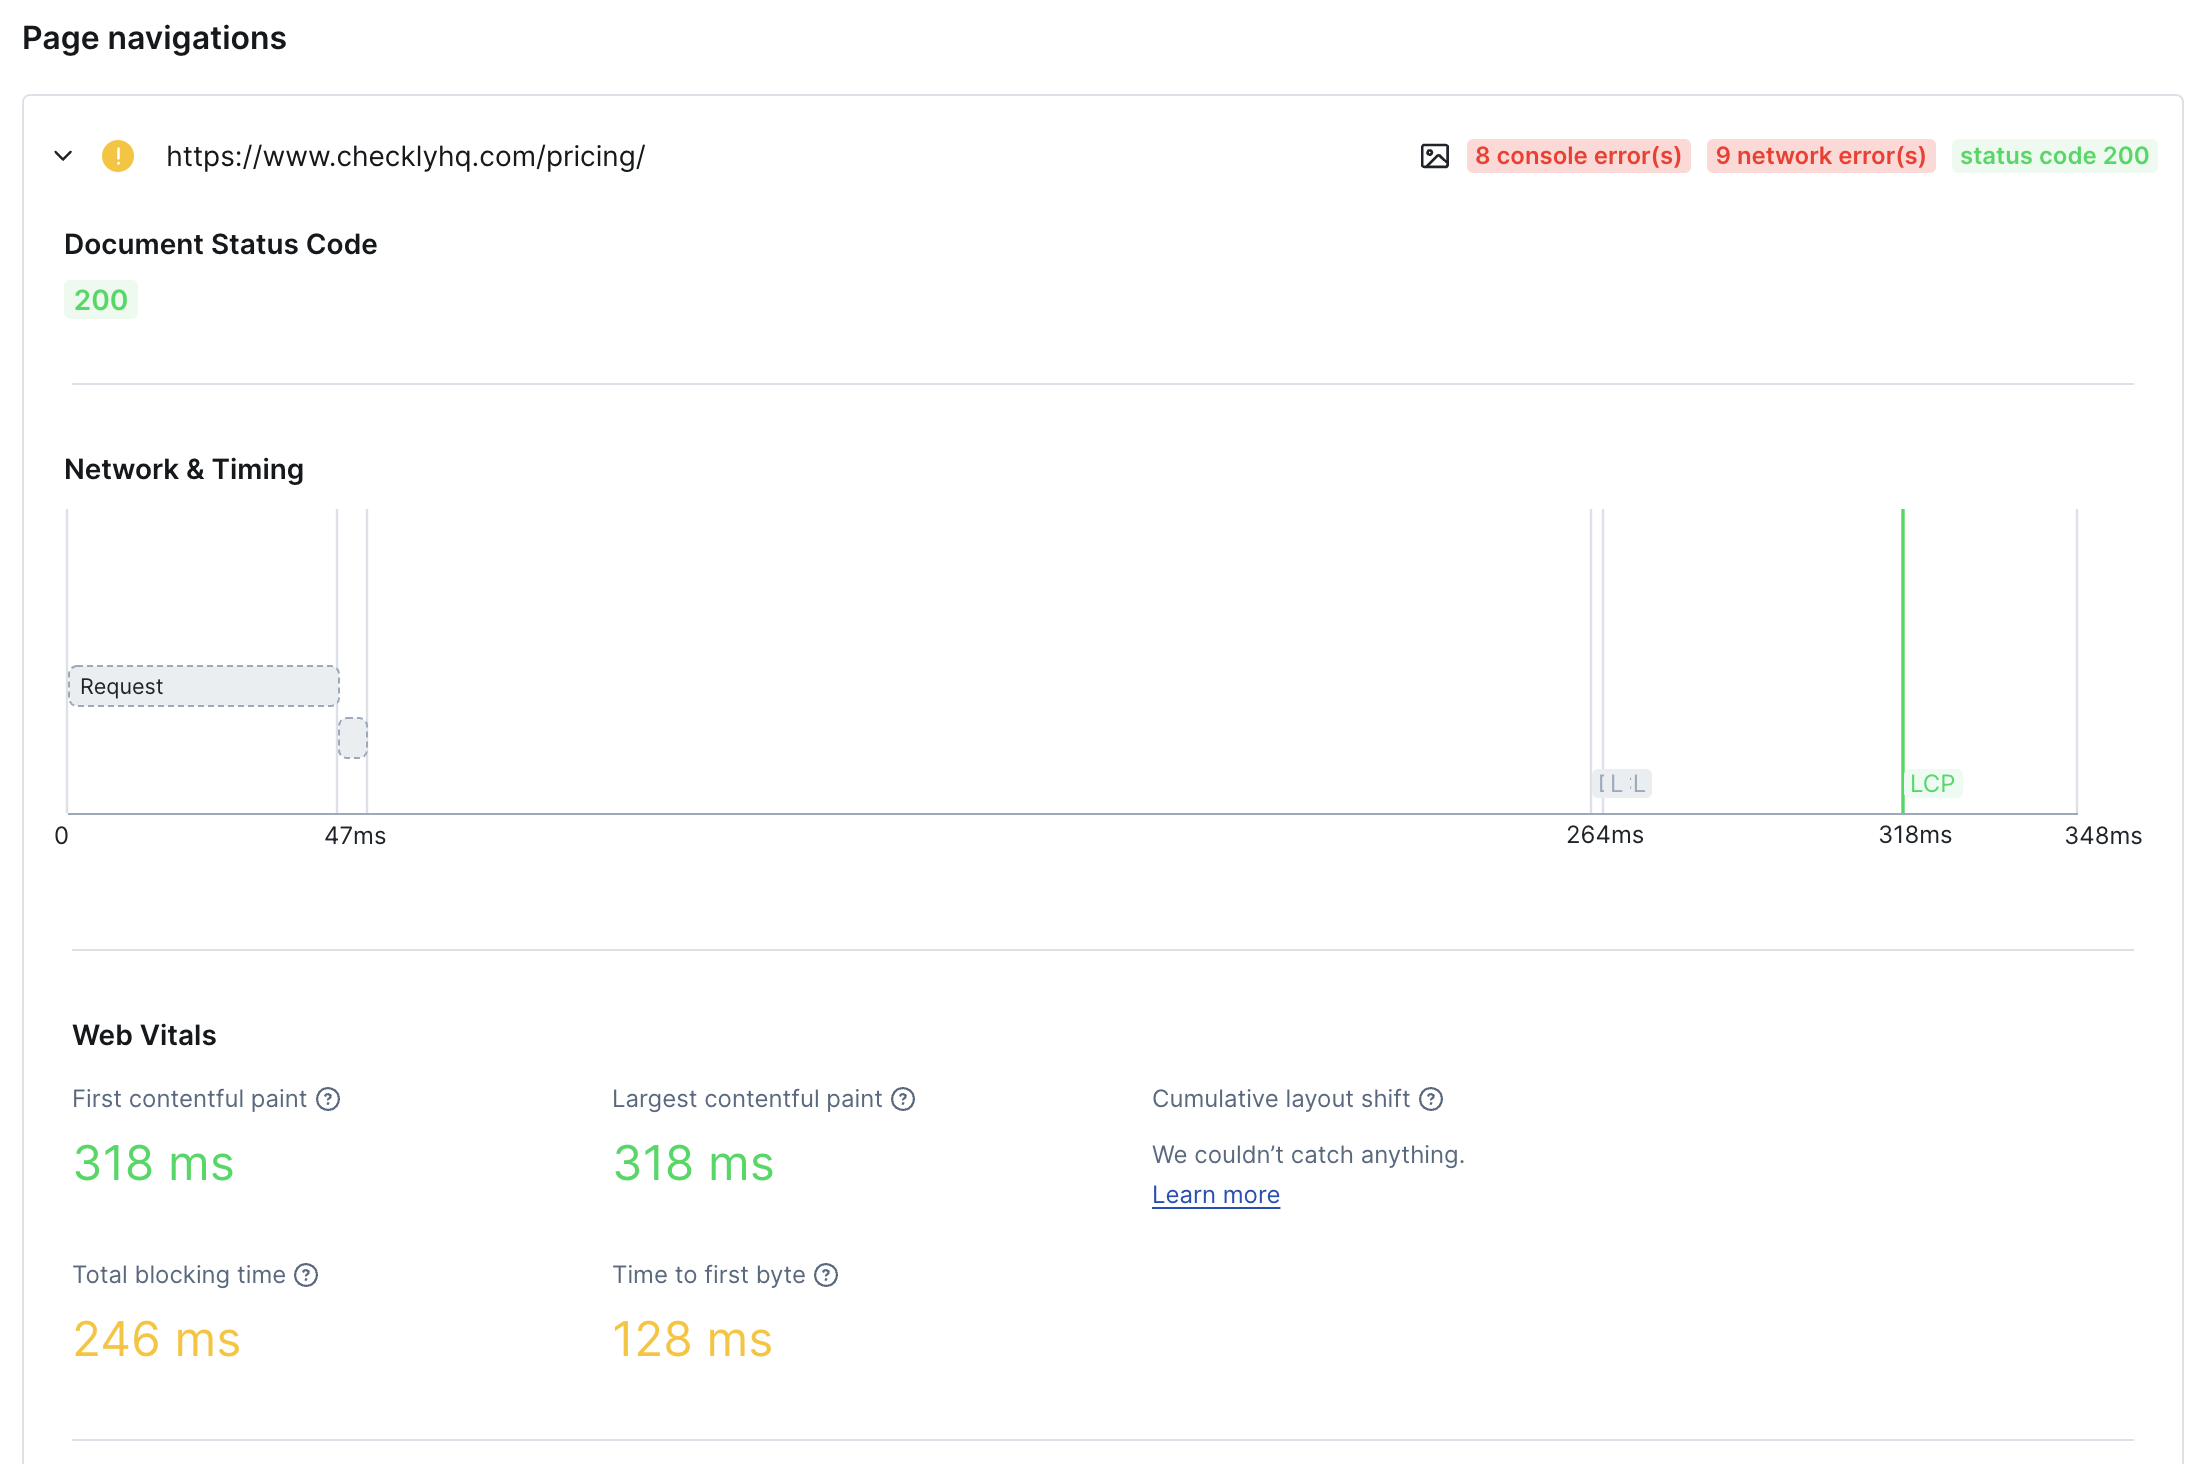
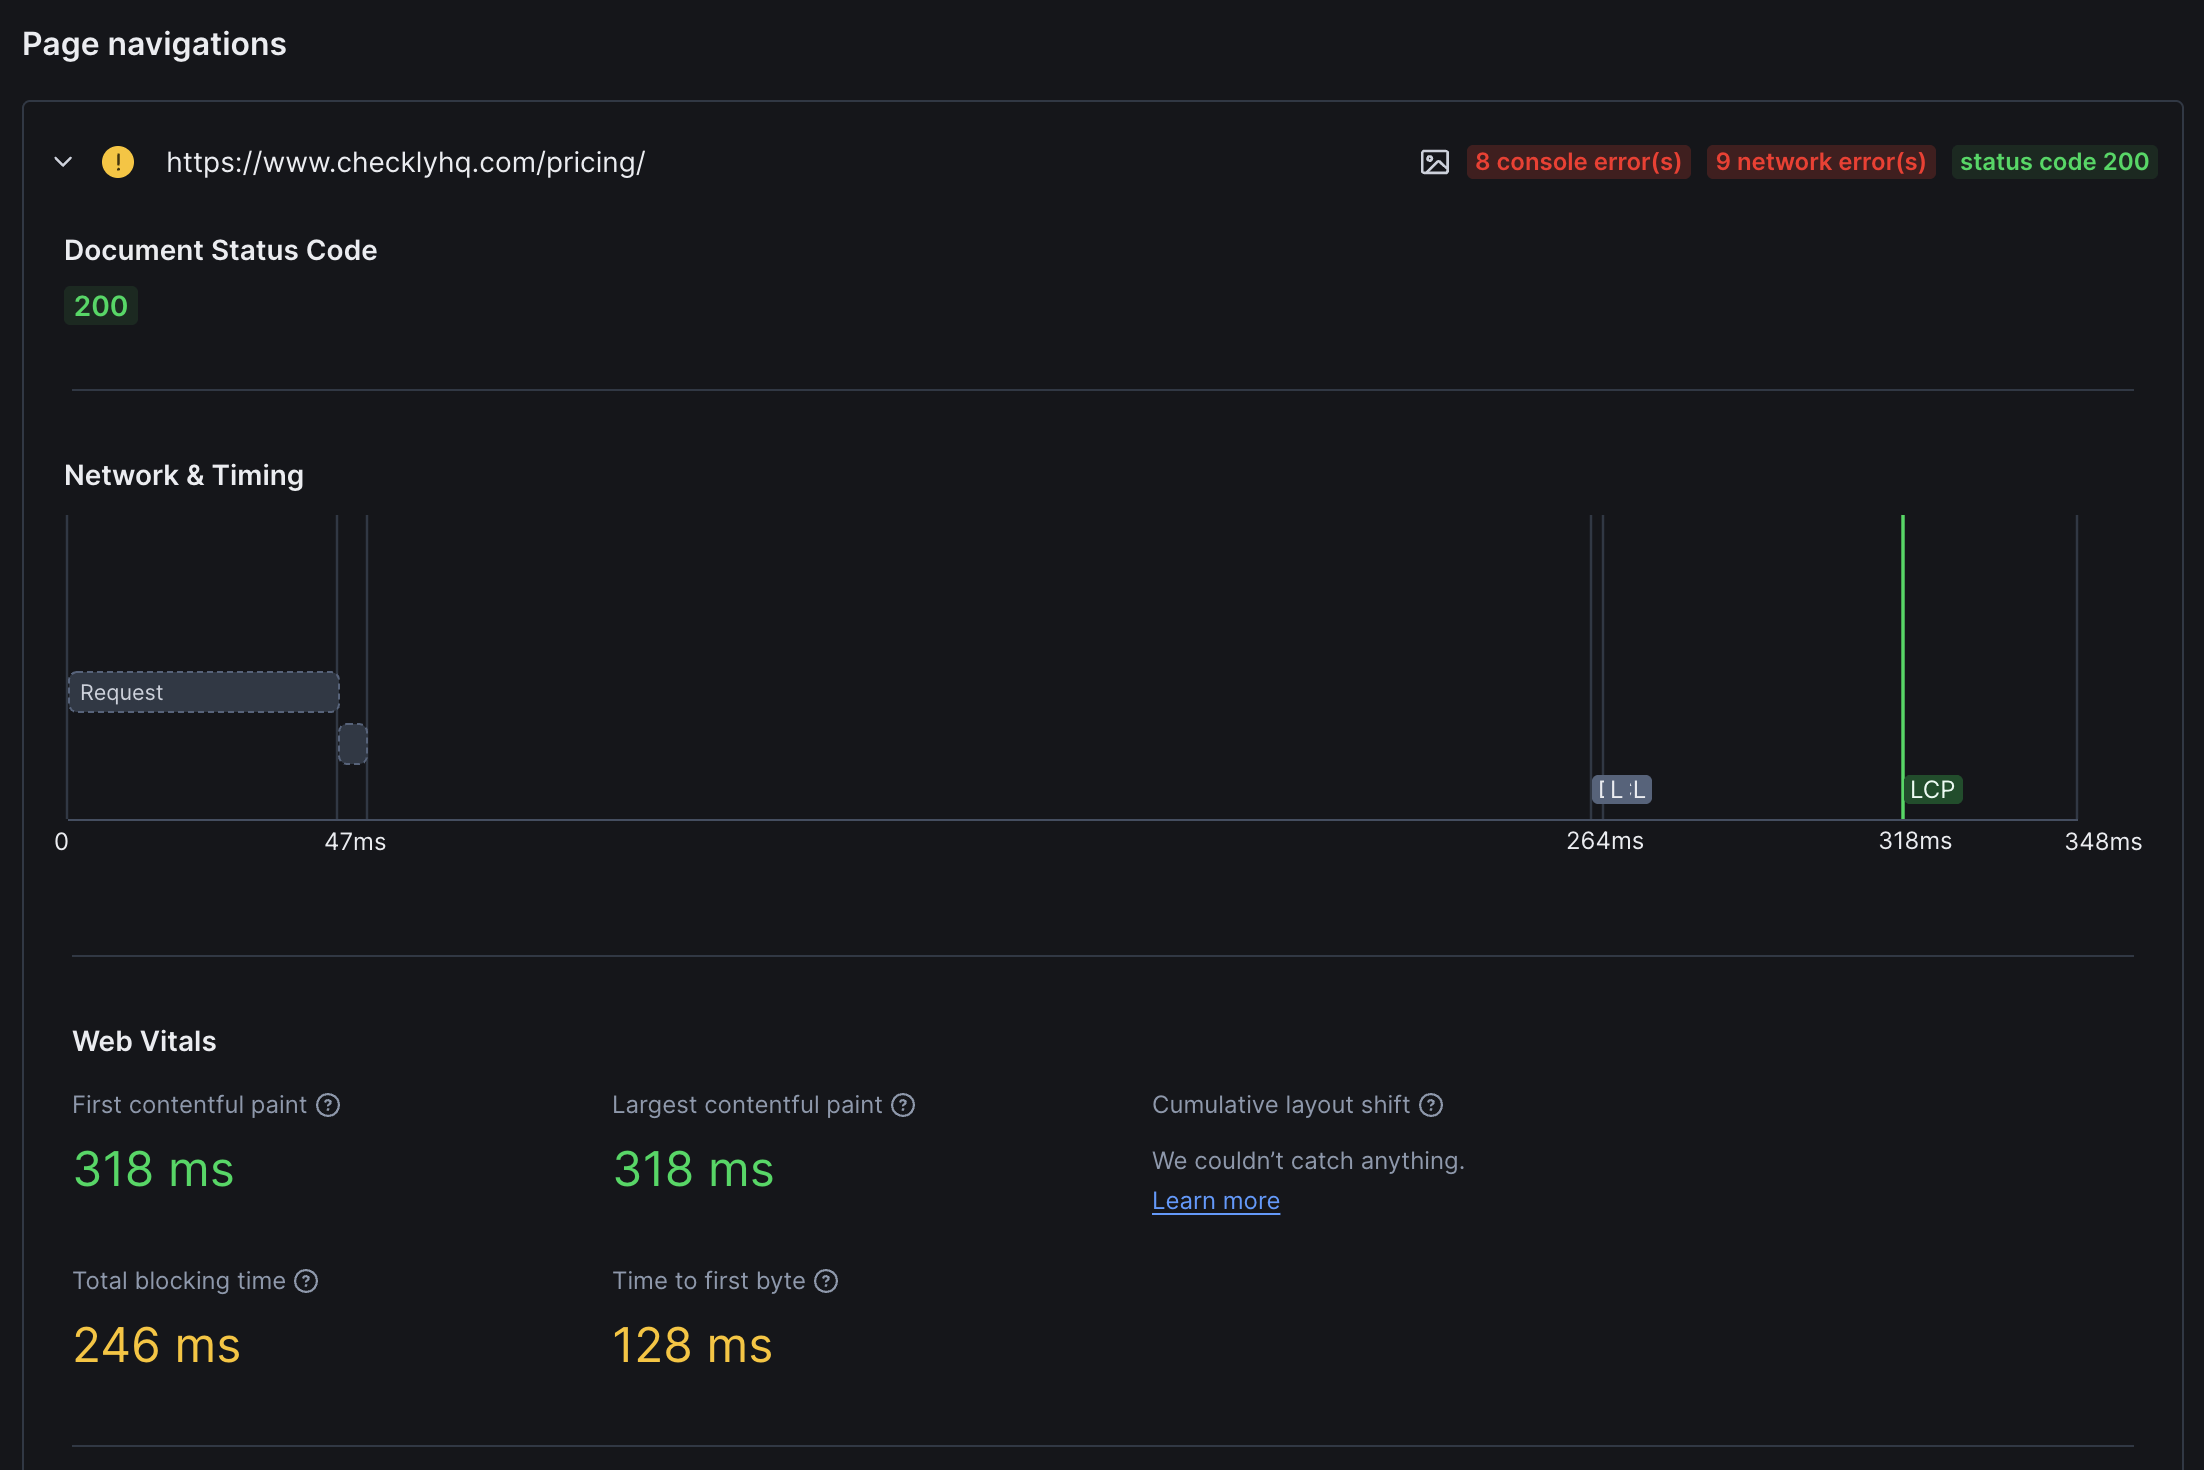
Checkly automatically collect Network Waterfalls & Performance signals (**Web Vitals**) for each of the pages you visit in the browser session.
 Checkly only collects tracing and web vitals data if your browser check meets the following criteria:
* It is based on **Playwright**.
* It runs on any **runtime above [2021.06](/docs/cli/checkly-runtimes)**
Running a Playwright Check Suite instead? See [Web Vitals for Playwright Check Suites](/docs/detect/synthetic-monitoring/playwright-checks/performance-metrics), which reports Web Vitals per page visit and adds LCP and INP attribution.
## Network Waterfalls
For each page you visit, we automatically collect the following:
1. Any `error`, `warning` or `info` level console messages.
2. Any network requests, like `xhr/fetch`, `javascript`, `css` and others.
You can use this data to quickly find issues with the pages you visit. Use cases are:
* Finding critical errors in your JavaScript by scanning the console logs.
* Pinpoint missing images or other resources: they will show a `404` in the network tab.
## Web Performance Vitals
For each page your script visits, we automatically collect a set of five [Web Vitals](https://web.dev/learn-web-vitals/).
Web Vitals are user focused quality signals for web pages that indicate a good, ok or poor user experience.
**Initial Content Display**
Measures the time from when the page starts loading to when any content is rendered. A large FCP means users see a white screen for too long, doubting whether the page works at all.
[Read more about FCP over at web.dev](https://web.dev/fcp/)
**Main Content Loading**
Measures the time to render the largest visual item within the browser viewport. High LCP means users wait too long before the most useful part of your page loads.
[Read more about LCP over at web.dev](https://web.dev/lcp/)
**Visual Stability**
An aggregate metric that signals screen elements "jumping around" as the page loads. Low CLS means you have a stable page layout.
[Read more about CLS over at web.dev](https://web.dev/cls/)
**Main Thread Responsiveness**
Reflects the time a web page is "blocked" from receiving user input because the main rendering thread is busy. High TBT means sluggish user interactions.
[Read more about TBT over at web.dev](https://web.dev/tbt/)
**Server Response Time**
Indicates how long it took for your server to respond with the first byte of content. TTFB can vary based on location and network conditions.
[Read more about TTFB over at web.dev](https://web.dev/time-to-first-byte/)
Web Vitals are a part [Google Lighthouse](https://developers.google.com/web/tools/lighthouse), but the two are not the same: Web Vitals are a lighter, higher-level tool built on existing browser APIs. Being less resource-intensive than Lighthouse, Web Vitals can be reliably calculated for you on cloud resources every minute.
### Why are some Web Vitals not reported?
Checkly automatically instruments your Playwright code to collect Web Vitals metrics. However, in some cases we will not
be able to collect a good measurement. There are multiple reasons for this:
#### Route-Based Navigation
A Single Page App like a React, Vue or Angular app only has one HTML page load event and then relies on route changes.
The underlying [library we use for collecting Web Vitals](https://github.com/GoogleChrome/web-vitals) does not yet account for this.
The folks over at Google are aware of this and [posted an FAQ](https://web.dev/vitals-spa-faq/).
#### Insufficient Measurement Time
Cumulative Layout Shift (CLS) relies on layout events accumulating over time. If your script exits very fast, or triggers
a redirect, there might not be enough time to actually "catch" this metric.
#### User Interaction Needed
Some metrics require a small amount of interaction to effectively "trigger". Clicking a button or other screen element
in your Playwright script can help here.
We are constantly tweaking and updating our Web Vitals collection code, so expect improvements in the future!
### Lab metrics vs. Field metrics
Checkly collects "lab" metrics for you. These are different from "field" metrics.
**Controlled Environment**
* Collected in synthetic environments
* Generated by your Browser check scripts
* Useful for establishing baselines
* Helps identify performance regressions
* Perfect for pre-deployment testing
**Real User Monitoring (RUM)**
* Based on real user traffic
* Collected "in the wild"
* Varies by device, location, network
* Provides actual user experience data
* Essential for production monitoring
Checkly only collects tracing and web vitals data if your browser check meets the following criteria:
* It is based on **Playwright**.
* It runs on any **runtime above [2021.06](/docs/cli/checkly-runtimes)**
Running a Playwright Check Suite instead? See [Web Vitals for Playwright Check Suites](/docs/detect/synthetic-monitoring/playwright-checks/performance-metrics), which reports Web Vitals per page visit and adds LCP and INP attribution.
## Network Waterfalls
For each page you visit, we automatically collect the following:
1. Any `error`, `warning` or `info` level console messages.
2. Any network requests, like `xhr/fetch`, `javascript`, `css` and others.
You can use this data to quickly find issues with the pages you visit. Use cases are:
* Finding critical errors in your JavaScript by scanning the console logs.
* Pinpoint missing images or other resources: they will show a `404` in the network tab.
## Web Performance Vitals
For each page your script visits, we automatically collect a set of five [Web Vitals](https://web.dev/learn-web-vitals/).
Web Vitals are user focused quality signals for web pages that indicate a good, ok or poor user experience.
**Initial Content Display**
Measures the time from when the page starts loading to when any content is rendered. A large FCP means users see a white screen for too long, doubting whether the page works at all.
[Read more about FCP over at web.dev](https://web.dev/fcp/)
**Main Content Loading**
Measures the time to render the largest visual item within the browser viewport. High LCP means users wait too long before the most useful part of your page loads.
[Read more about LCP over at web.dev](https://web.dev/lcp/)
**Visual Stability**
An aggregate metric that signals screen elements "jumping around" as the page loads. Low CLS means you have a stable page layout.
[Read more about CLS over at web.dev](https://web.dev/cls/)
**Main Thread Responsiveness**
Reflects the time a web page is "blocked" from receiving user input because the main rendering thread is busy. High TBT means sluggish user interactions.
[Read more about TBT over at web.dev](https://web.dev/tbt/)
**Server Response Time**
Indicates how long it took for your server to respond with the first byte of content. TTFB can vary based on location and network conditions.
[Read more about TTFB over at web.dev](https://web.dev/time-to-first-byte/)
Web Vitals are a part [Google Lighthouse](https://developers.google.com/web/tools/lighthouse), but the two are not the same: Web Vitals are a lighter, higher-level tool built on existing browser APIs. Being less resource-intensive than Lighthouse, Web Vitals can be reliably calculated for you on cloud resources every minute.
### Why are some Web Vitals not reported?
Checkly automatically instruments your Playwright code to collect Web Vitals metrics. However, in some cases we will not
be able to collect a good measurement. There are multiple reasons for this:
#### Route-Based Navigation
A Single Page App like a React, Vue or Angular app only has one HTML page load event and then relies on route changes.
The underlying [library we use for collecting Web Vitals](https://github.com/GoogleChrome/web-vitals) does not yet account for this.
The folks over at Google are aware of this and [posted an FAQ](https://web.dev/vitals-spa-faq/).
#### Insufficient Measurement Time
Cumulative Layout Shift (CLS) relies on layout events accumulating over time. If your script exits very fast, or triggers
a redirect, there might not be enough time to actually "catch" this metric.
#### User Interaction Needed
Some metrics require a small amount of interaction to effectively "trigger". Clicking a button or other screen element
in your Playwright script can help here.
We are constantly tweaking and updating our Web Vitals collection code, so expect improvements in the future!
### Lab metrics vs. Field metrics
Checkly collects "lab" metrics for you. These are different from "field" metrics.
**Controlled Environment**
* Collected in synthetic environments
* Generated by your Browser check scripts
* Useful for establishing baselines
* Helps identify performance regressions
* Perfect for pre-deployment testing
**Real User Monitoring (RUM)**
* Based on real user traffic
* Collected "in the wild"
* Varies by device, location, network
* Provides actual user experience data
* Essential for production monitoring