> ## Documentation Index
> Fetch the complete documentation index at: https://www.checklyhq.com/docs/llms.txt
> Use this file to discover all available pages before exploring further.
# ICMP Monitor Configuration
> Configure your ICMP monitor to verify host reachability and measure network latency.
### Basic Setup
Configure your ICMP monitor by specifying the target host:
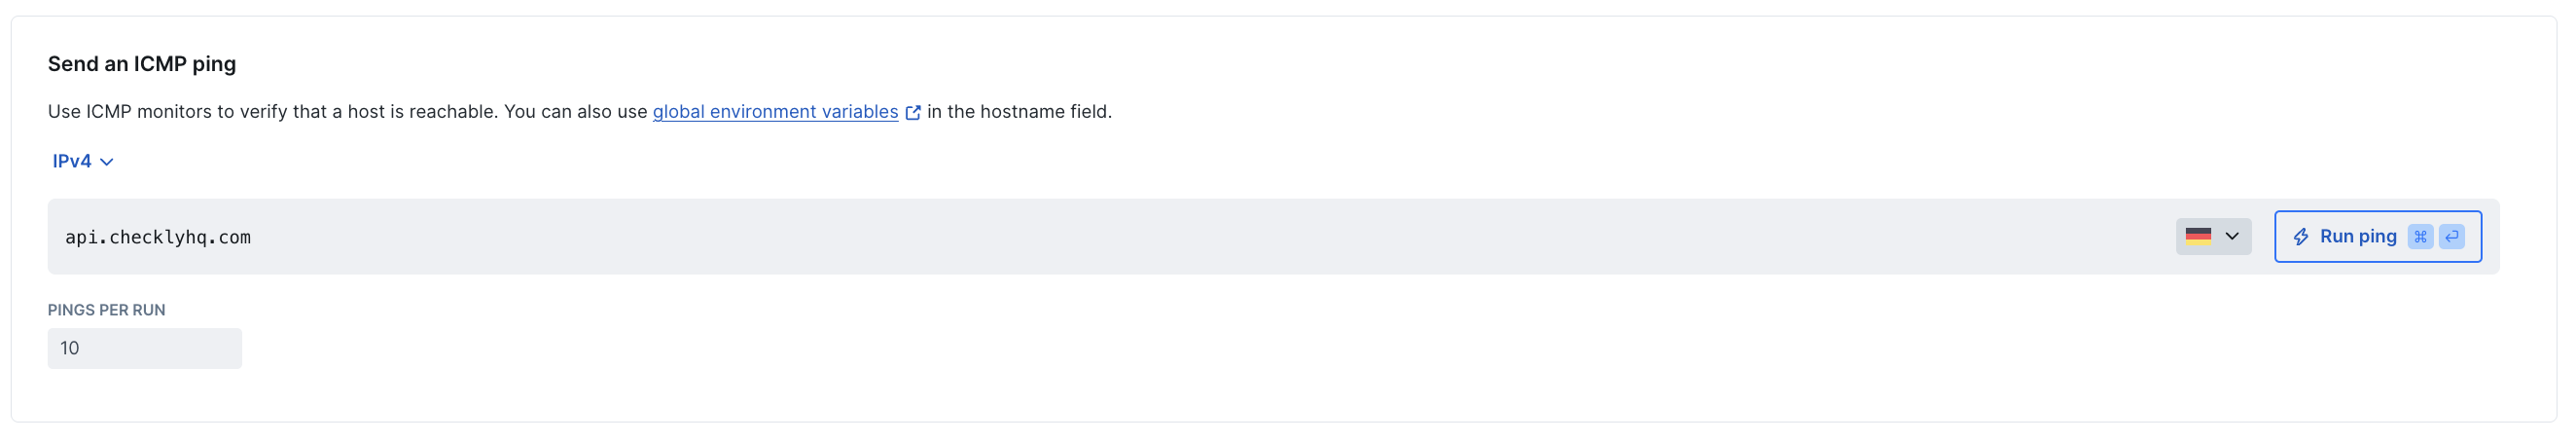 * **Hostname or IP address:** The server you want to monitor (e.g. `db.example.com` or `203.0.113.1`)
* **IP family:** Choose between IPv4 (default) or IPv6
* **Pings per run:** Number of ICMP Echo Request packets to send per check run (1-50, default: 10)
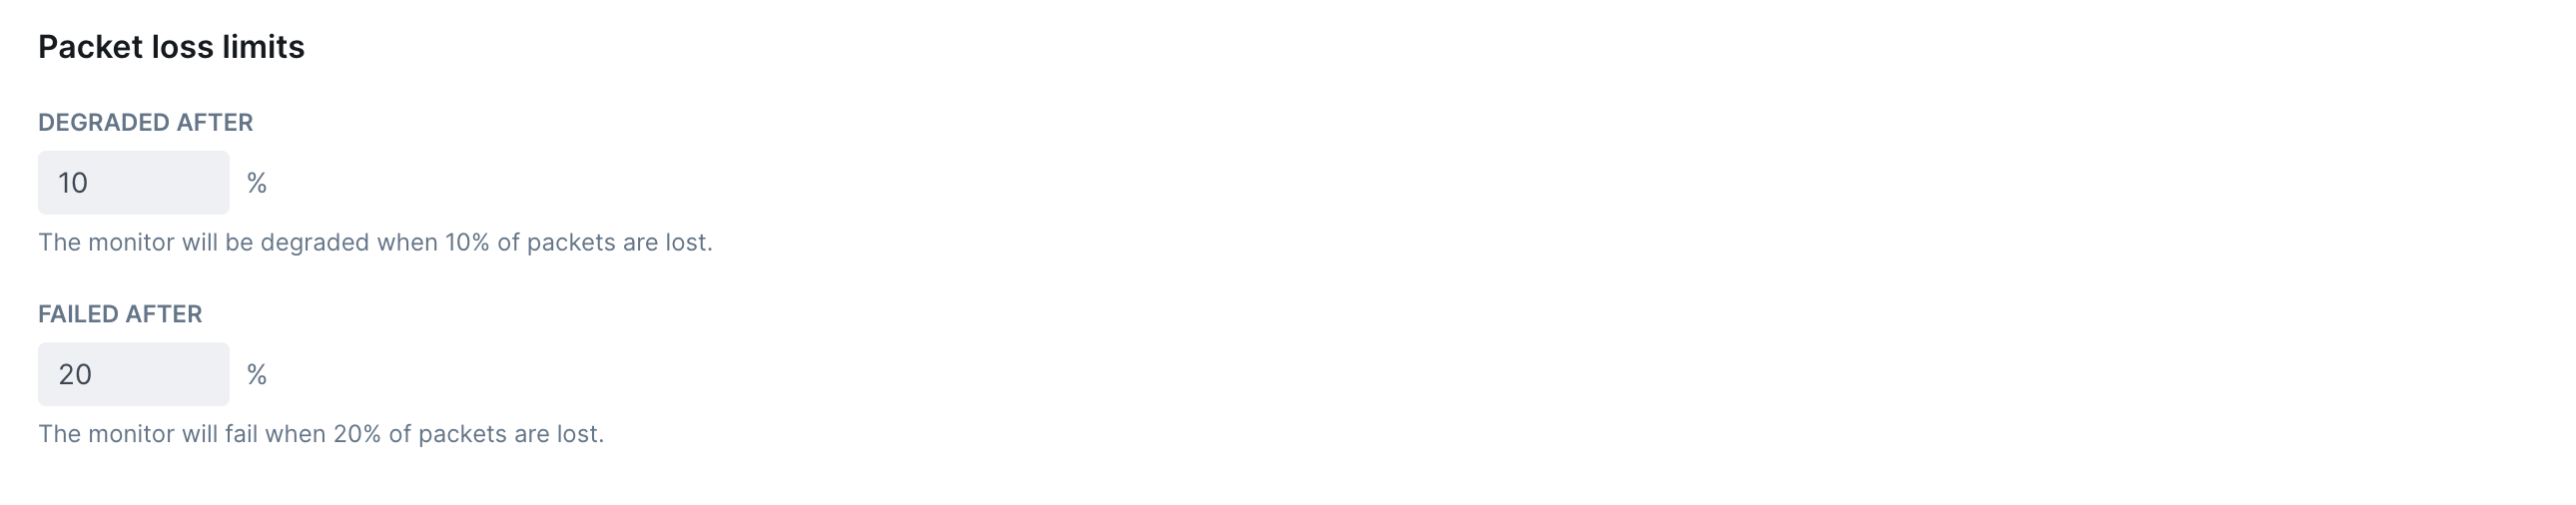
### Packet Loss Limits
Define packet loss thresholds to determine when an ICMP monitor should be considered degraded or failed:
* **Hostname or IP address:** The server you want to monitor (e.g. `db.example.com` or `203.0.113.1`)
* **IP family:** Choose between IPv4 (default) or IPv6
* **Pings per run:** Number of ICMP Echo Request packets to send per check run (1-50, default: 10)
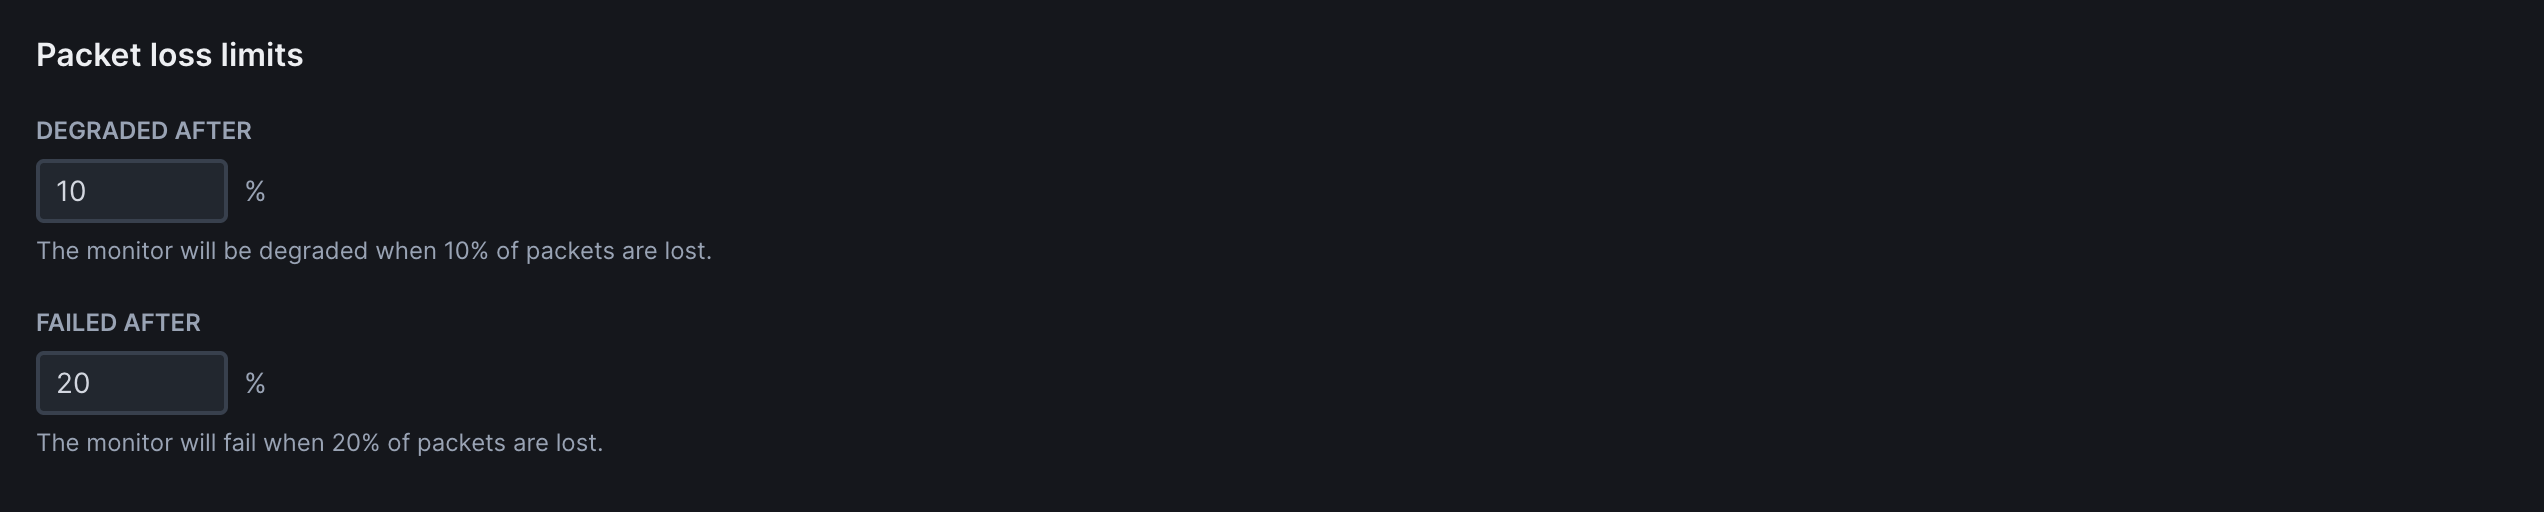
### Packet Loss Limits
Define packet loss thresholds to determine when an ICMP monitor should be considered degraded or failed:
 ### Assertions
Use assertions to validate ICMP results and make sure your host meets availability and performance expectations.
### Assertions
Use assertions to validate ICMP results and make sure your host meets availability and performance expectations.
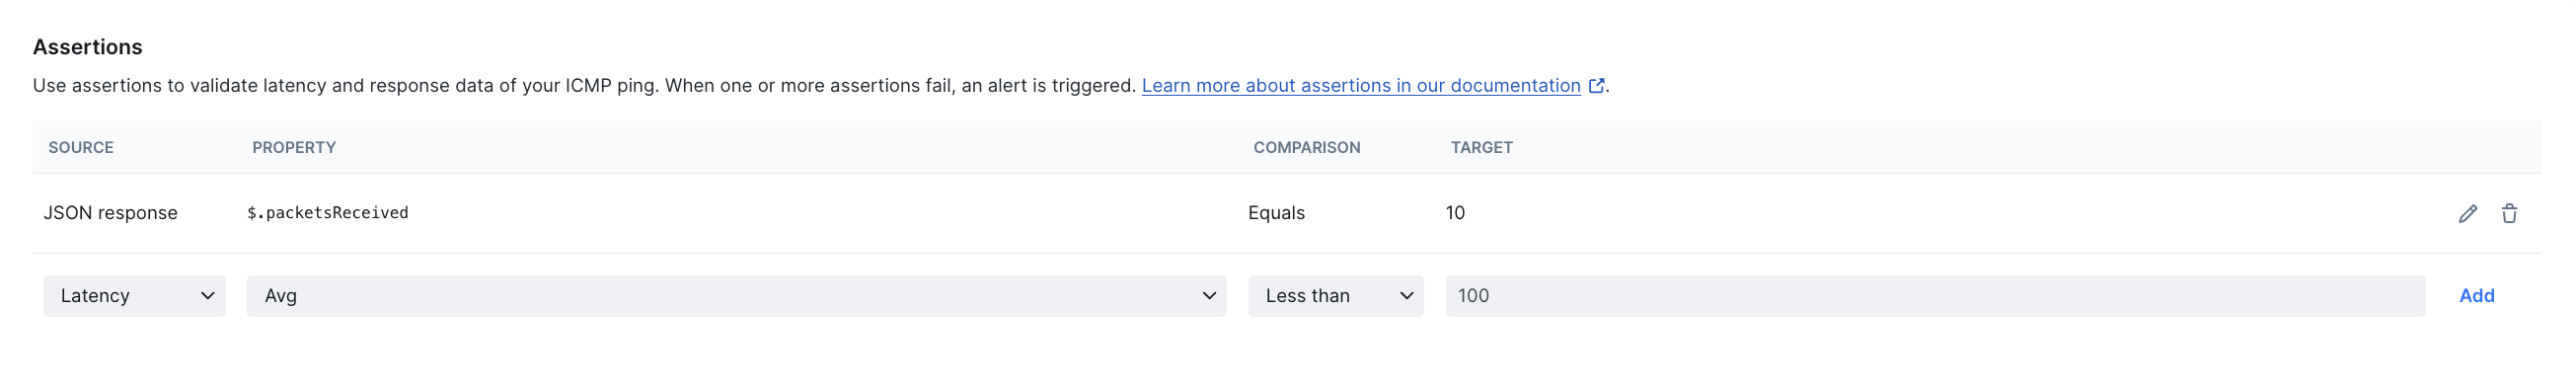 You can create assertions based on:
* **Latency metrics:** ICMP monitors send 10 pings per run by default and measure round-trip time (RTT) for every received packet. You can validate the resulting `min`, `max`, `avg`, or `stddev` latency values.
* **JSON response:** Assert against the JSON response structure. This allows you to target specific fields using JSON path assertions. For example:
* `$.latency.max` → catch latency spikes
* `$.packetsReceived` → detect dropped ping responses
* `$.dnsResolutionTime` → separate DNS issues from ICMP latency
* `$.pingResults[*].ttl` → check TTL values
Learn more about JSON path assertions: [JSON responses with JSON path](/docs/detect/assertions/#json-responses-with-json-path).
### JSON Response Schema
The ICMP response is parsed into a structured JSON format. All responses share a common structure:
```json theme={null}
{
"hostname": "46.225.5.223", // Target hostname or IP provided in the monitor
"resolvedIp": "46.225.5.223", // Final IP address used for the ping
"ipFamily": "IPv4", // IP version (IPv4 or IPv6)
"pingCount": 10, // Number of ICMP Echo Requests to sent
"packetsSent": 10, // Number of packets transmitted
"packetsReceived": 9, // Number of packets received
"packetSize": 64, // ICMP payload size in bytes
"packetLoss": 10, // Packet loss percentage
"latency": {
"avg": 104.67472366666668, // Average round-trip time of all ICMP Echo Requests in milliseconds
"min": 104.024927, // Minimum RTT in milliseconds
"max": 105.107583, // Maximum RTT in milliseconds
"stdDev": 0.3808160582180707 // Standard deviation of RTT in milliseconds
},
"pingResults": [
{
"sequence": 0, // ICMP sequence number
"type": 0, // ICMP type (0 = Echo Reply)
"code": 0, // ICMP code (usually 0 for Echo Reply)
"success": true, // Whether this ping received a valid reply
"rtt": 104.917277, // Round-trip time for this packet in milliseconds
"ttl": 53 // Time To Live value from the reply
}
// ... one entry per ping attempt
]
}
```
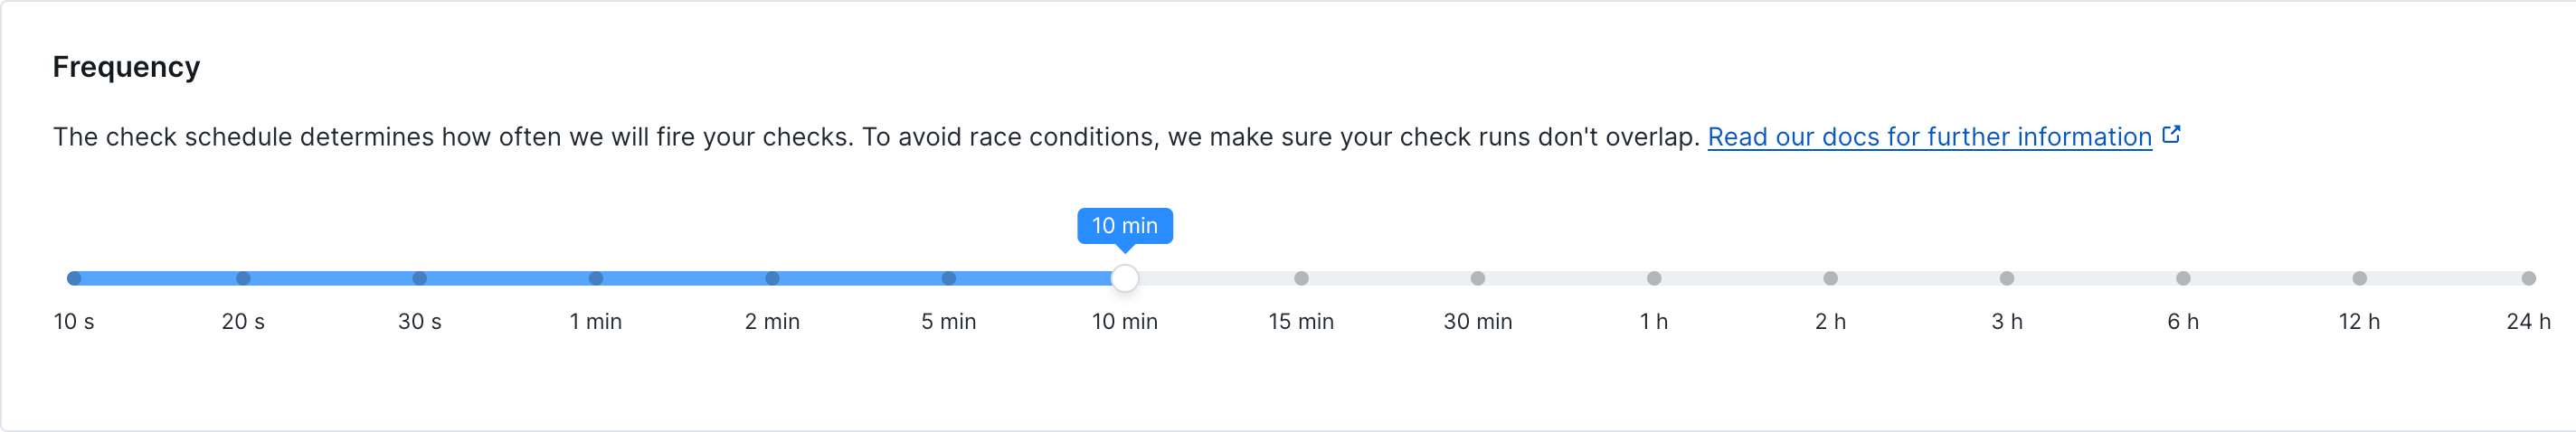
### Frequency
Set how often the monitor runs (every 10 seconds to 24 hours):
You can create assertions based on:
* **Latency metrics:** ICMP monitors send 10 pings per run by default and measure round-trip time (RTT) for every received packet. You can validate the resulting `min`, `max`, `avg`, or `stddev` latency values.
* **JSON response:** Assert against the JSON response structure. This allows you to target specific fields using JSON path assertions. For example:
* `$.latency.max` → catch latency spikes
* `$.packetsReceived` → detect dropped ping responses
* `$.dnsResolutionTime` → separate DNS issues from ICMP latency
* `$.pingResults[*].ttl` → check TTL values
Learn more about JSON path assertions: [JSON responses with JSON path](/docs/detect/assertions/#json-responses-with-json-path).
### JSON Response Schema
The ICMP response is parsed into a structured JSON format. All responses share a common structure:
```json theme={null}
{
"hostname": "46.225.5.223", // Target hostname or IP provided in the monitor
"resolvedIp": "46.225.5.223", // Final IP address used for the ping
"ipFamily": "IPv4", // IP version (IPv4 or IPv6)
"pingCount": 10, // Number of ICMP Echo Requests to sent
"packetsSent": 10, // Number of packets transmitted
"packetsReceived": 9, // Number of packets received
"packetSize": 64, // ICMP payload size in bytes
"packetLoss": 10, // Packet loss percentage
"latency": {
"avg": 104.67472366666668, // Average round-trip time of all ICMP Echo Requests in milliseconds
"min": 104.024927, // Minimum RTT in milliseconds
"max": 105.107583, // Maximum RTT in milliseconds
"stdDev": 0.3808160582180707 // Standard deviation of RTT in milliseconds
},
"pingResults": [
{
"sequence": 0, // ICMP sequence number
"type": 0, // ICMP type (0 = Echo Reply)
"code": 0, // ICMP code (usually 0 for Echo Reply)
"success": true, // Whether this ping received a valid reply
"rtt": 104.917277, // Round-trip time for this packet in milliseconds
"ttl": 53 // Time To Live value from the reply
}
// ... one entry per ping attempt
]
}
```
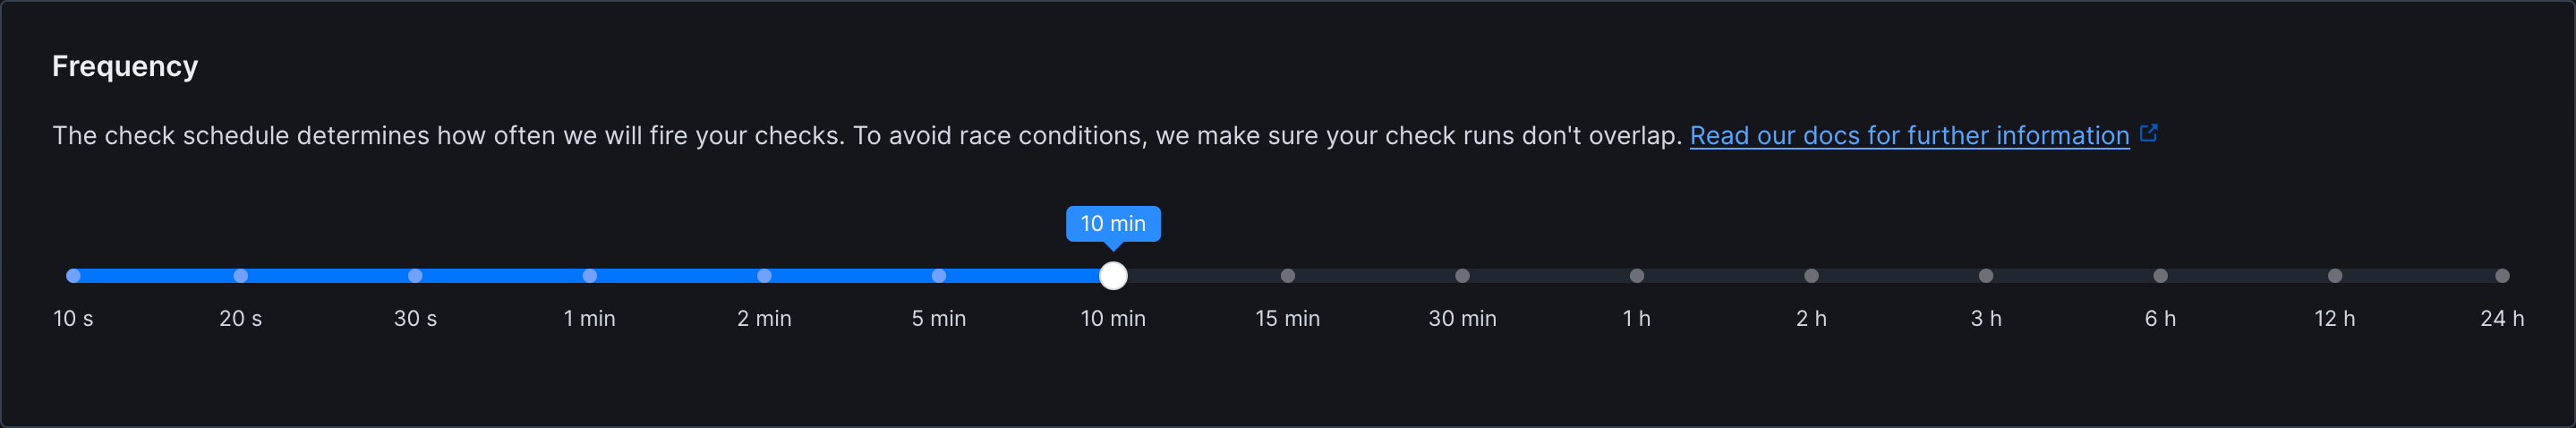
### Frequency
Set how often the monitor runs (every 10 seconds to 24 hours):
 ### Scheduling & Locations
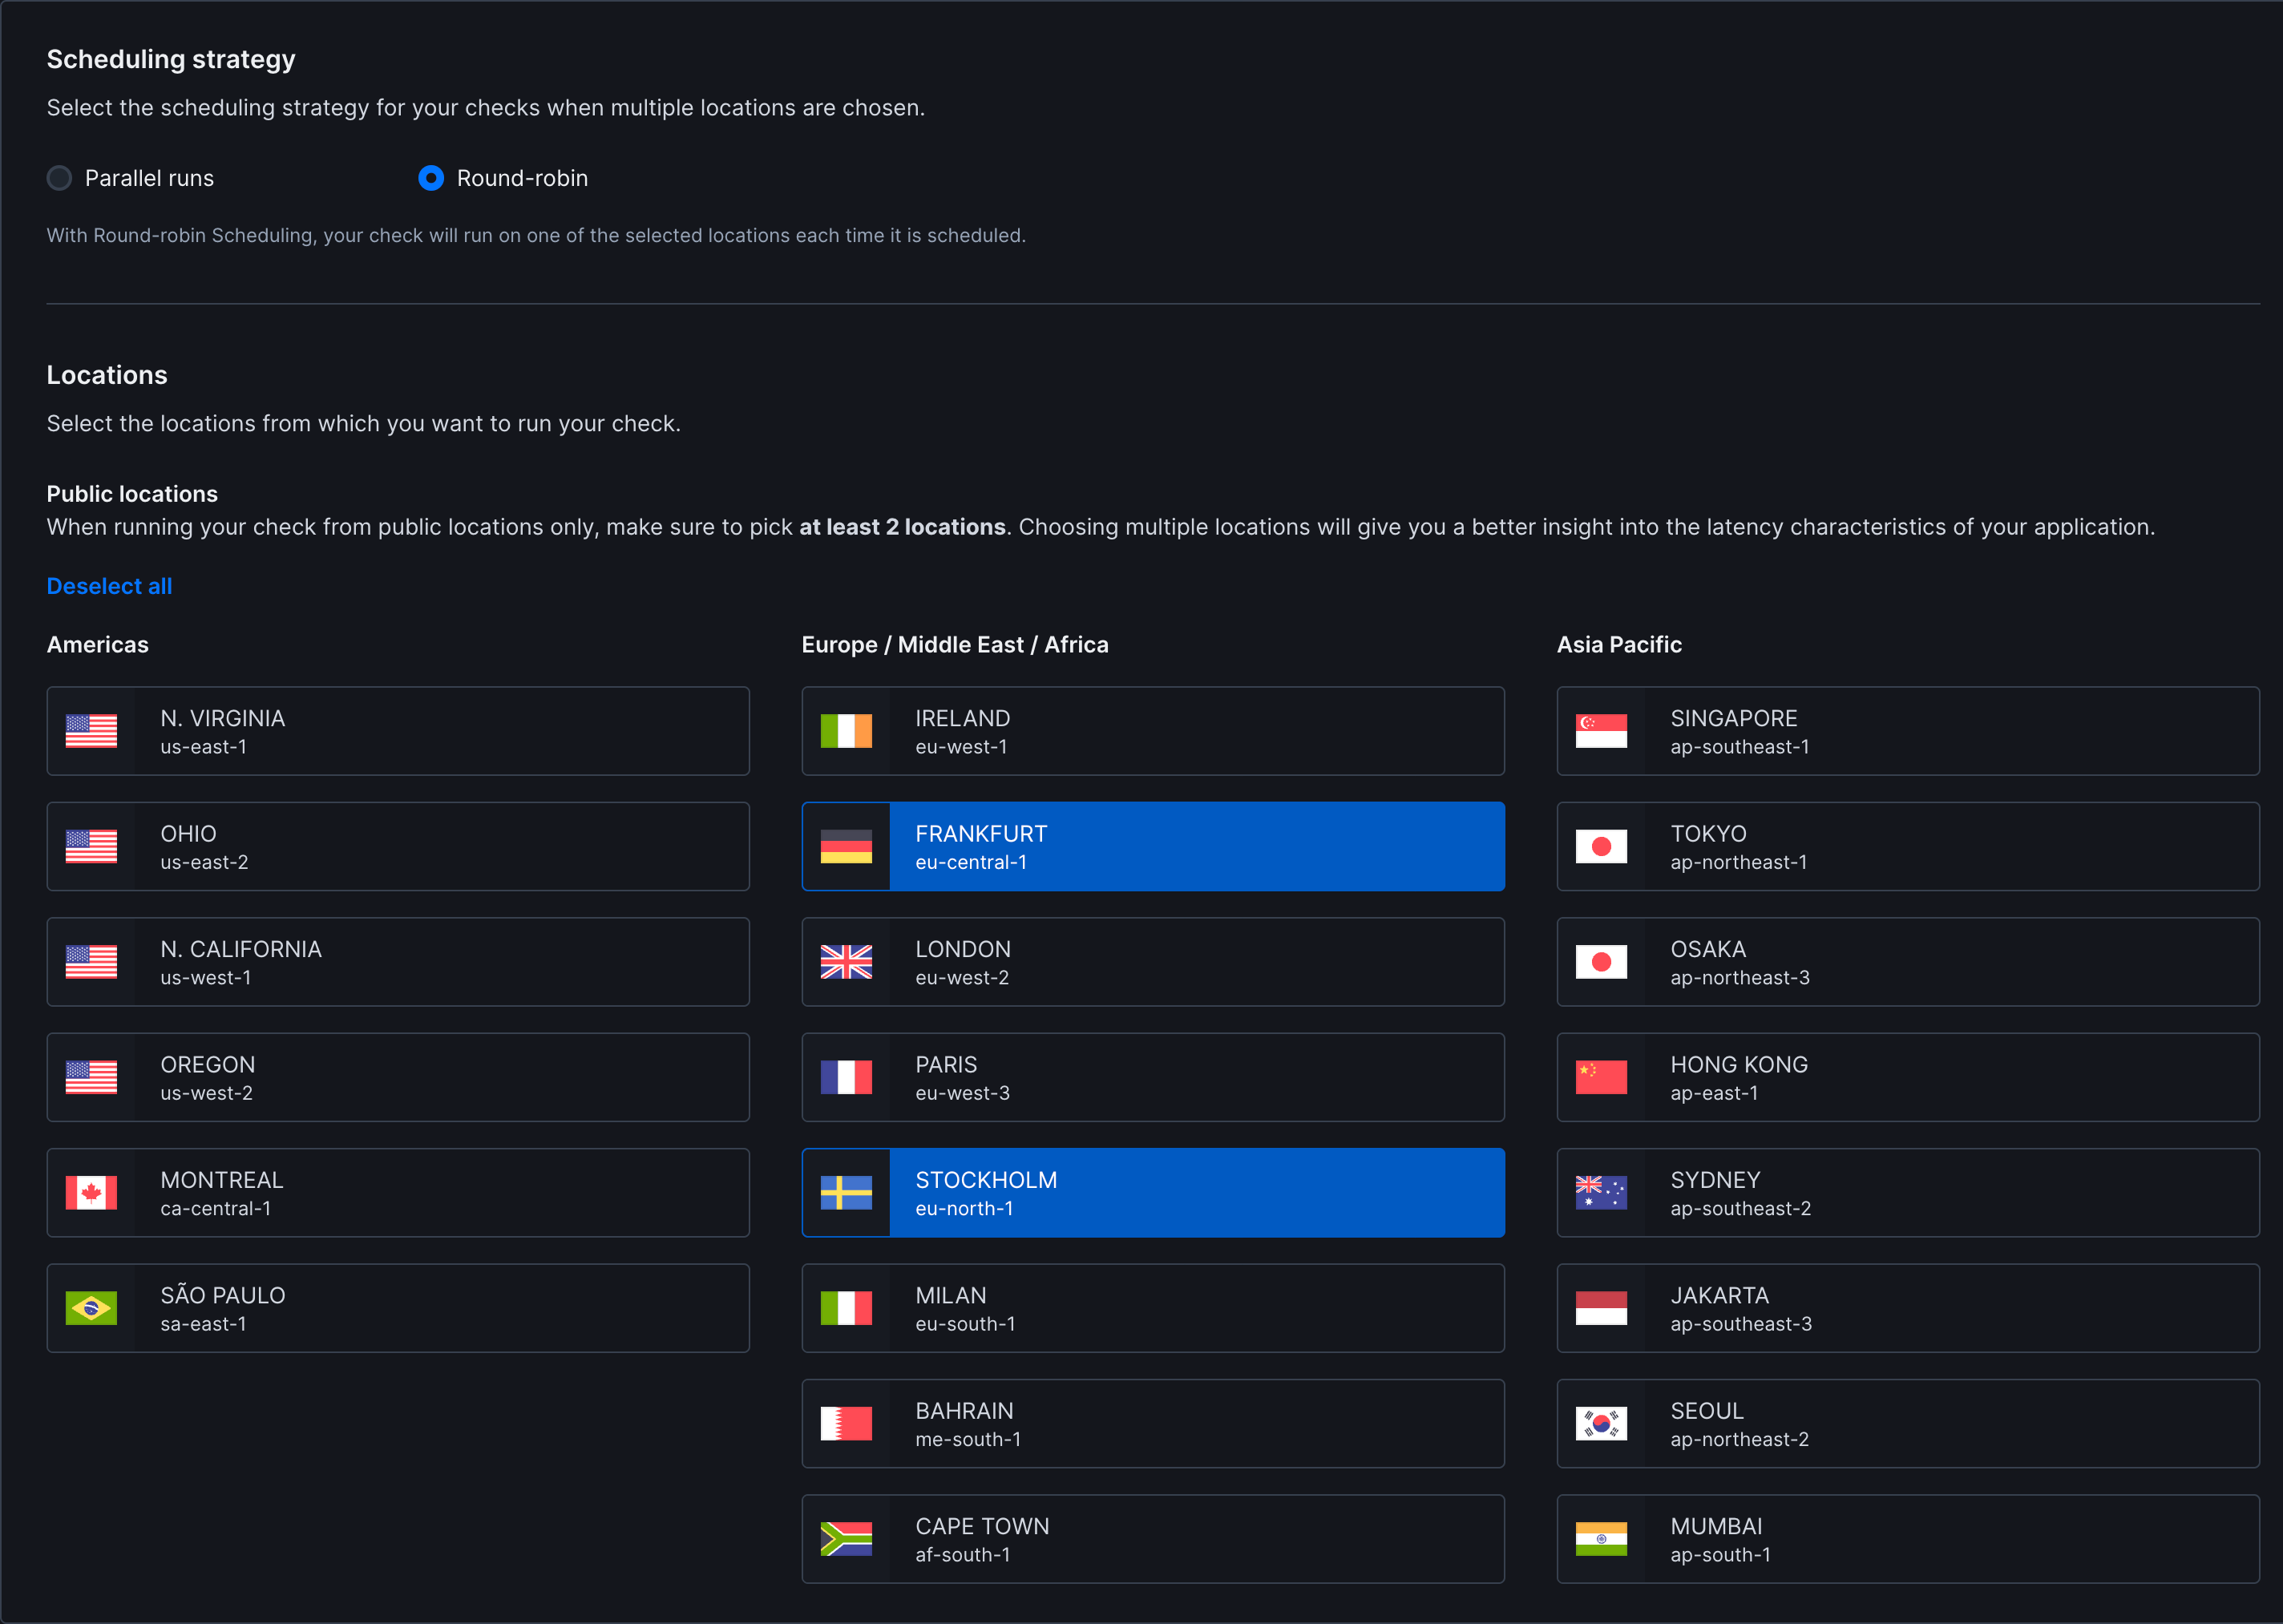
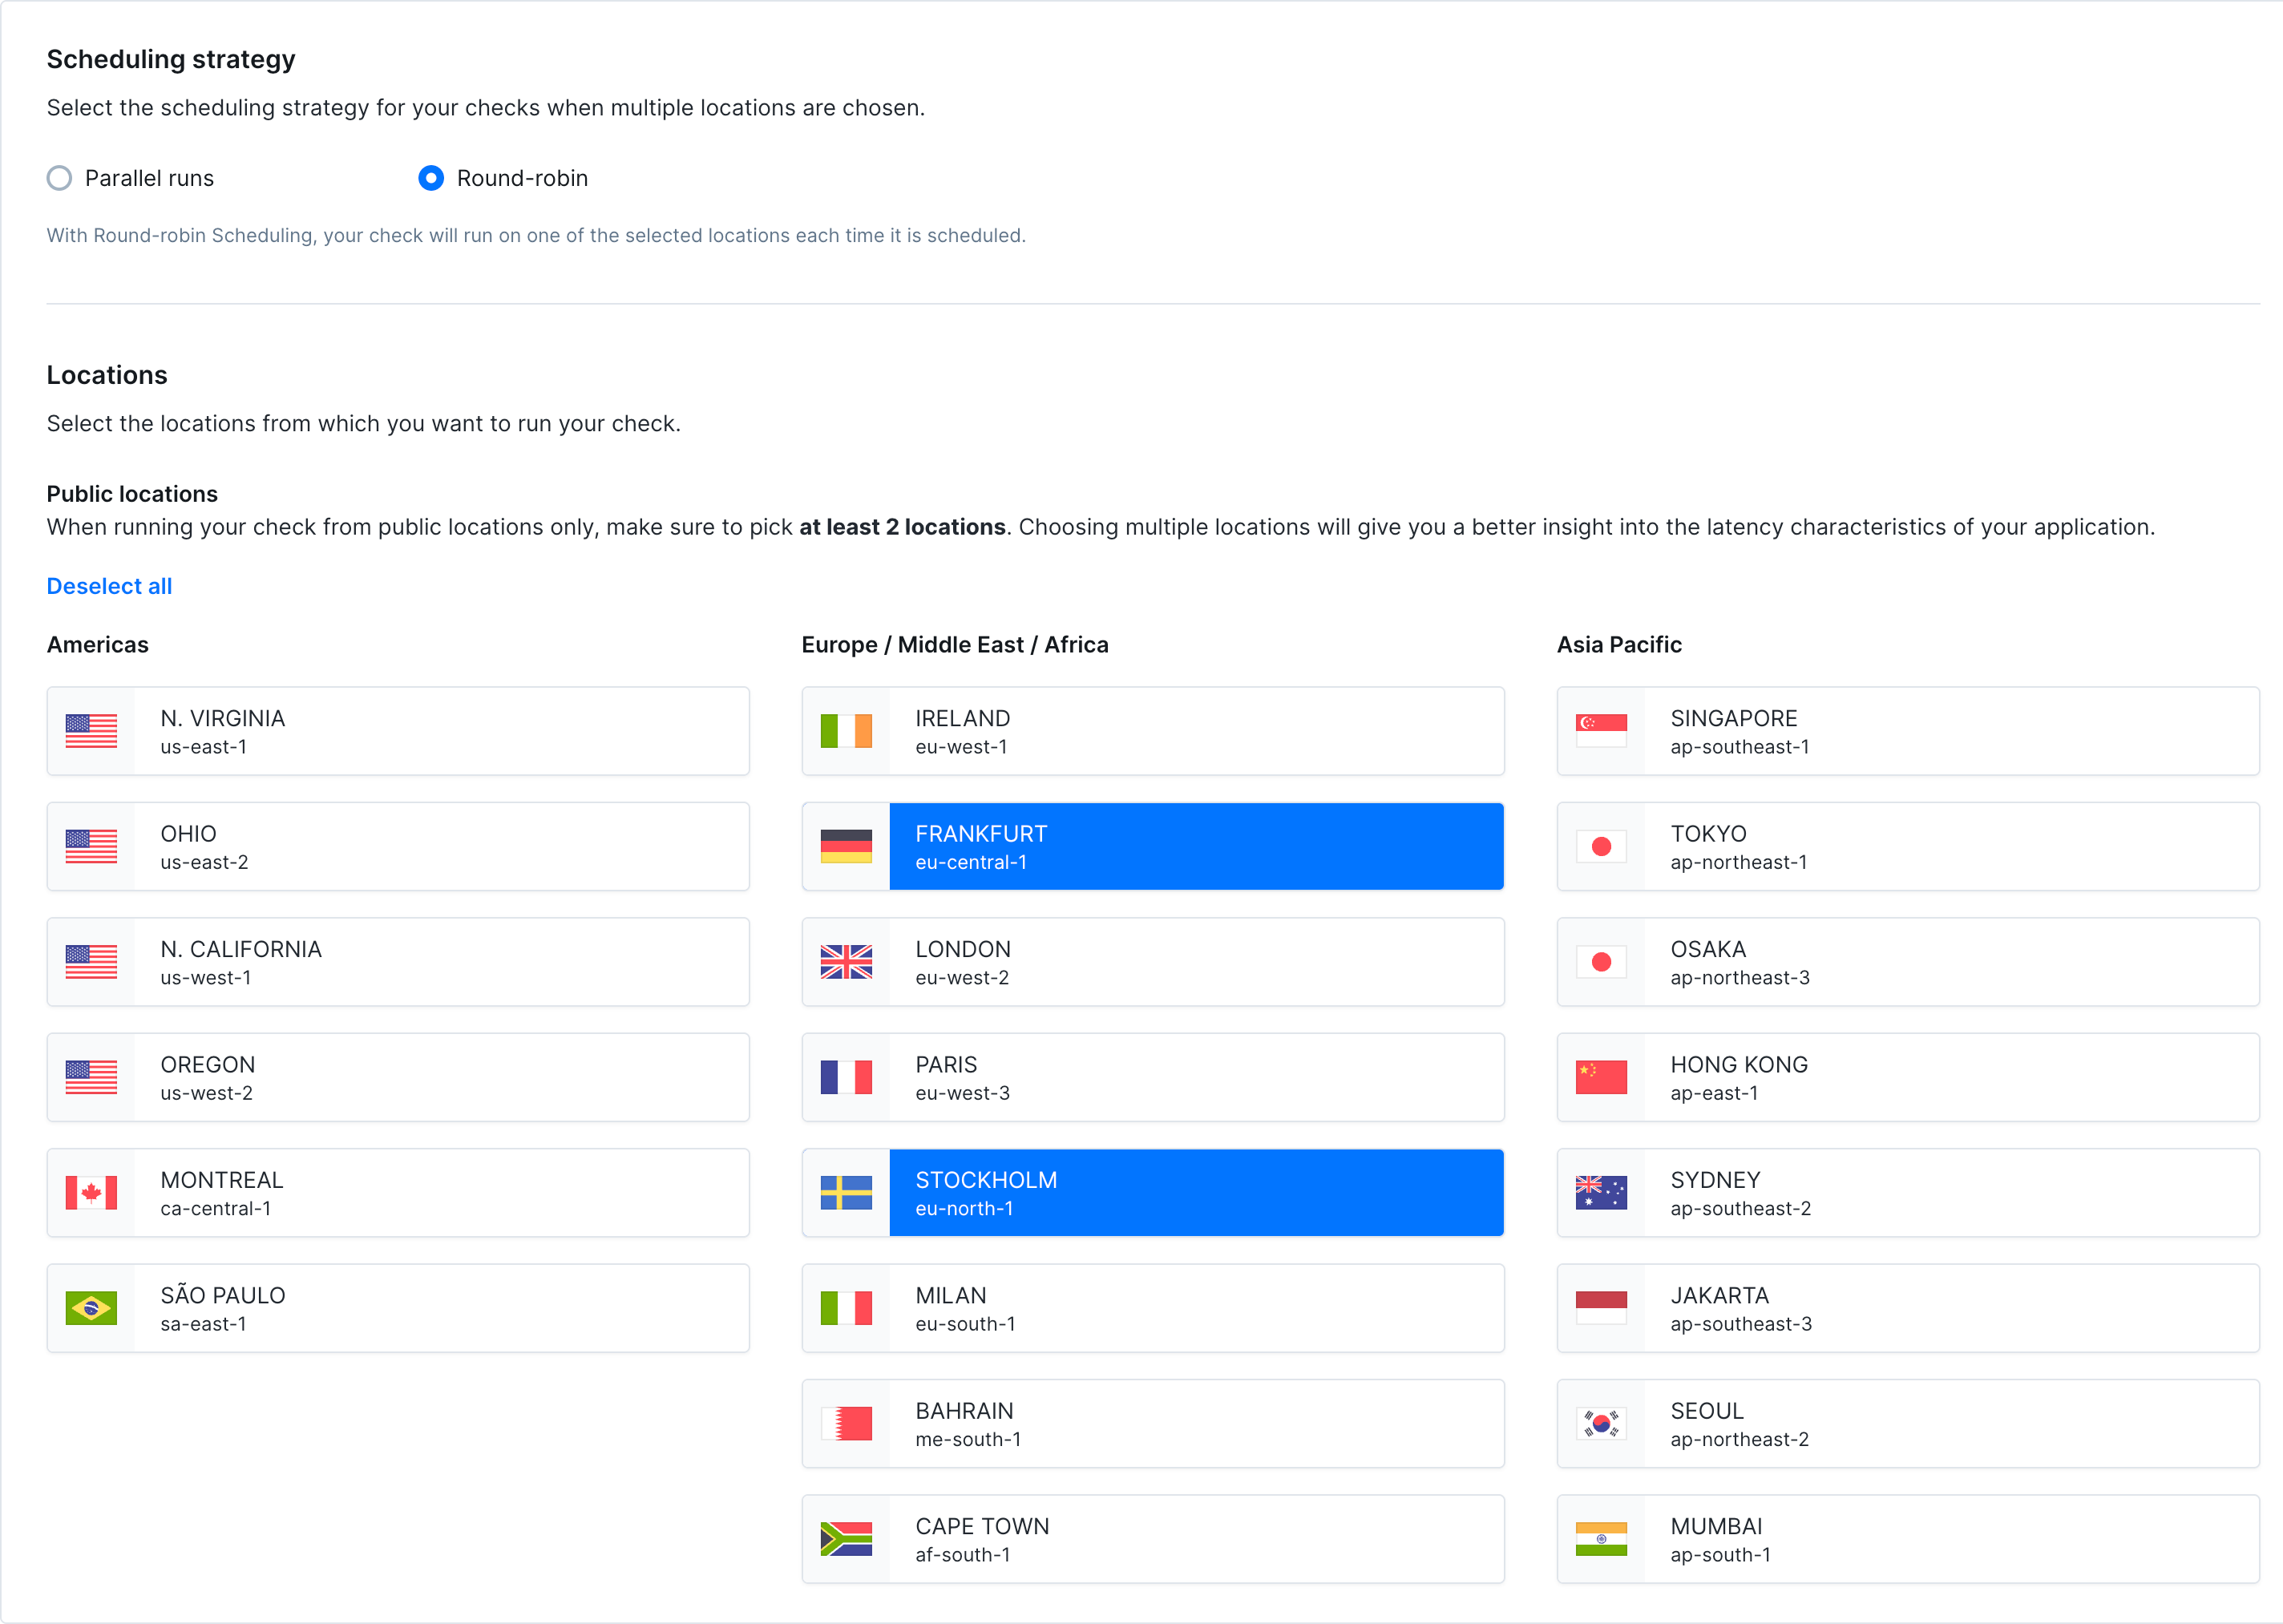
 * **Strategy:** Choose between round-robin or parallel execution. Learn more about [scheduling strategies](/docs/concepts/scheduling)
* **Locations:** Select [public](/docs/concepts/locations/#public-locations) or [private](/docs/platform/private-locations/overview) locations to run the monitor from
### Additional Settings
* **Name:** Give your monitor a clear name to identify it in dashboards and alerts
* **Description:** Add context about what this monitor does and why it matters. Supports markdown, max 500 characters. When a failure occurs, [Rocky AI](/docs/ai/rocky-ai) uses the description to provide more accurate [root cause and user impact analysis](/docs/resolve/ai-root-cause-analysis/overview)
* **Tags:** Use tags to organize monitors across [dashboards](/docs/communicate/dashboards/overview/) and [maintenance windows](/docs/communicate/maintenance-windows/overview)
* **Retries:** Define how failed runs should be retried. See [retry strategies](/docs/communicate/alerts/retries)
* **Alerting:** Configure your [alert settings](/docs/communicate/alerts/configuration), [alert channels](/docs/communicate/alerts/channels), or set up [webhooks](/docs/integrations/alerts/webhooks) for custom integrations
* **Strategy:** Choose between round-robin or parallel execution. Learn more about [scheduling strategies](/docs/concepts/scheduling)
* **Locations:** Select [public](/docs/concepts/locations/#public-locations) or [private](/docs/platform/private-locations/overview) locations to run the monitor from
### Additional Settings
* **Name:** Give your monitor a clear name to identify it in dashboards and alerts
* **Description:** Add context about what this monitor does and why it matters. Supports markdown, max 500 characters. When a failure occurs, [Rocky AI](/docs/ai/rocky-ai) uses the description to provide more accurate [root cause and user impact analysis](/docs/resolve/ai-root-cause-analysis/overview)
* **Tags:** Use tags to organize monitors across [dashboards](/docs/communicate/dashboards/overview/) and [maintenance windows](/docs/communicate/maintenance-windows/overview)
* **Retries:** Define how failed runs should be retried. See [retry strategies](/docs/communicate/alerts/retries)
* **Alerting:** Configure your [alert settings](/docs/communicate/alerts/configuration), [alert channels](/docs/communicate/alerts/channels), or set up [webhooks](/docs/integrations/alerts/webhooks) for custom integrations