> ## Documentation Index
> Fetch the complete documentation index at: https://www.checklyhq.com/docs/llms.txt
> Use this file to discover all available pages before exploring further.
# ICMP Monitors Overview
> Monitor host reachability and network latency using ICMP ping.
**Monitoring as Code**: Learn more about the [ICMP Monitor Construct](/docs/constructs/icmp-monitor).
 ## What are ICMP Monitors?
ICMP monitors check if a host is reachable by sending ICMP Echo Requests (pings). Typical use cases include:
* Verifying reachability for servers, load balancers, or network appliances that don't expose HTTP endpoints or open TCP ports
* Detecting network-level outages before they're visible via HTTP endpoints
* Monitoring latency across regions to identify geographic performance issues
* Tracking packet loss to catch network quality degradation early
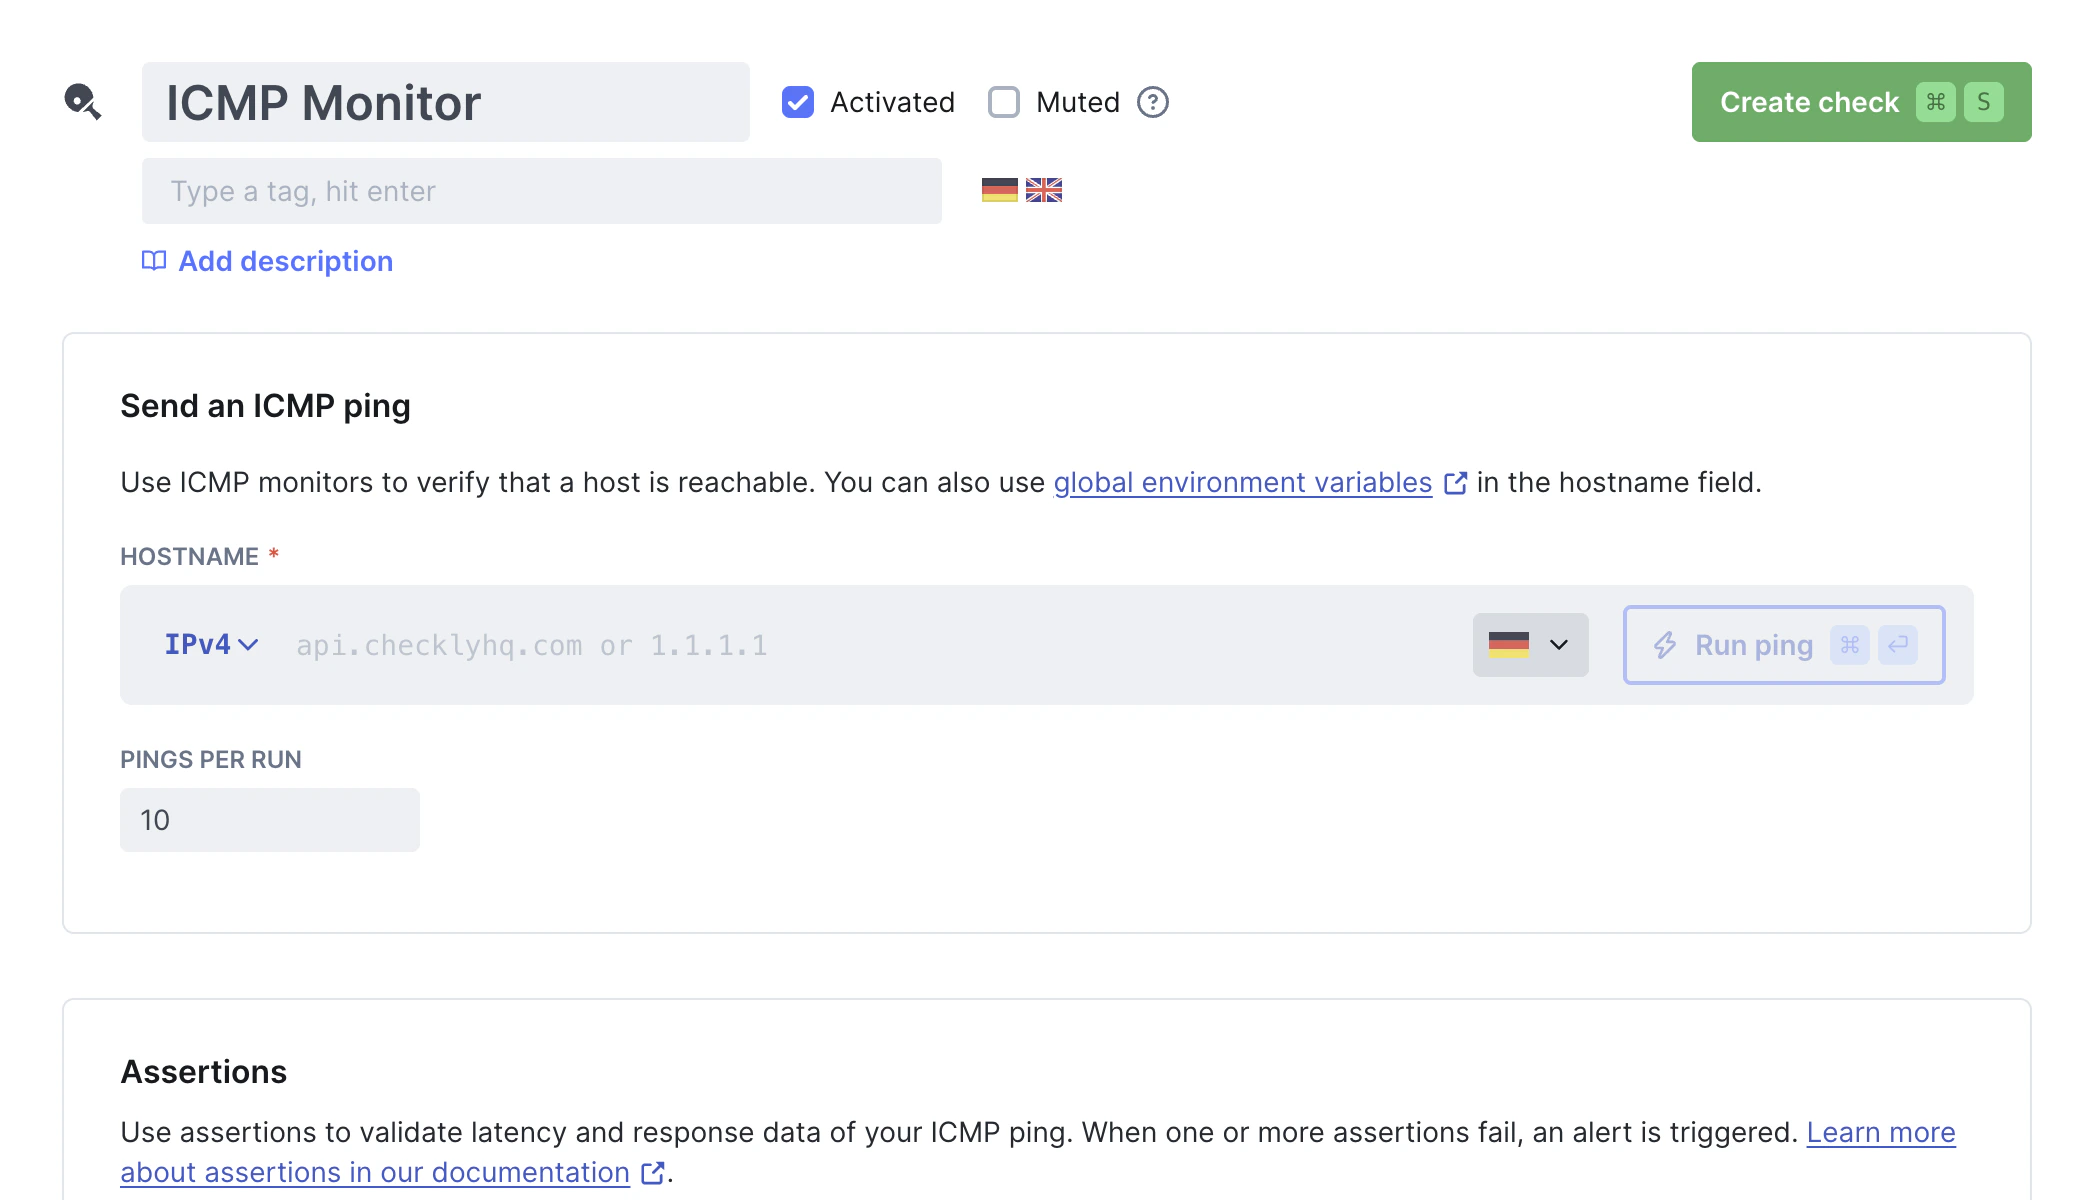
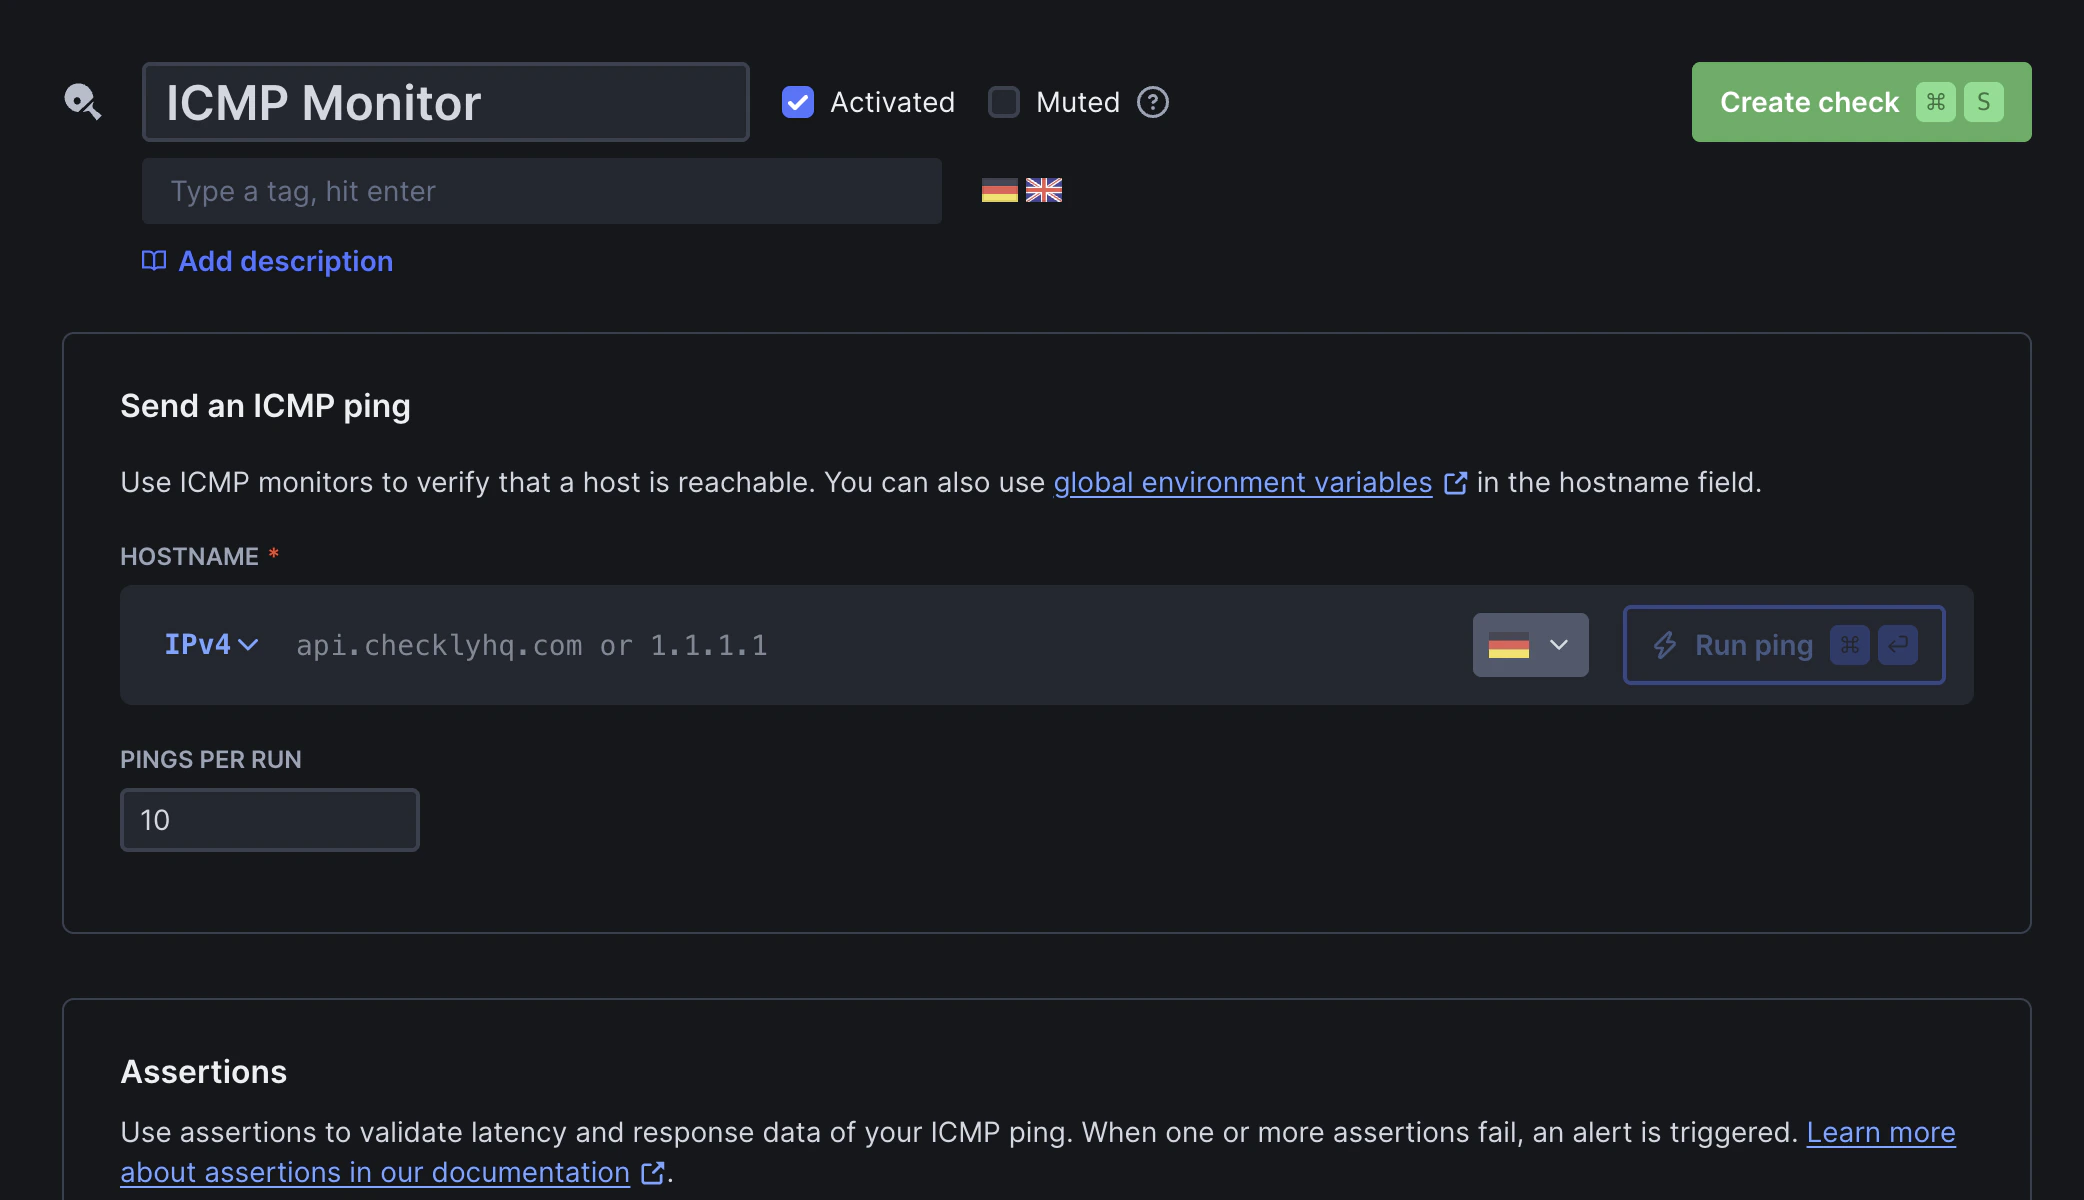
## How do ICMP monitors work?
ICMP monitors perform ping tests:
* Hostname resolution: If a hostname is provided, Checkly resolves it to an IP address
* Ping execution: Multiple ICMP Echo Request packets (configurable from 1–50, default: 10) are sent from your configured locations, with a 500 ms interval between each ping
* Response validation: ICMP Echo Reply packets are received. Round-trip latency and packet loss are measured and evaluated against your configured assertions
For example, pinging `checklyhq.com` with 3 pings returns:
```shell theme={null}
PING checklyhq.com (18.239.105.69): 56 bytes of data
64 bytes from 18.239.105.69: icmp_seq=0 ttl=247 time=6.6 ms
64 bytes from 18.239.105.69: icmp_seq=1 ttl=247 time=49.8 ms
64 bytes from 18.239.105.69: icmp_seq=2 ttl=247 time=6.6 ms
--- checklyhq.com ping statistics ---
3 packets transmitted, 3 received, 0% packet loss
round-trip min/avg/max/stddev = 6.573/20.993/49.812/24.958 ms
```
The response appears on the results page as both raw output and parsed JSON. You can use it as a reference to define [assertions](/docs/detect/uptime-monitoring/icmp-monitors/configuration#assertions) for expected values.
## ICMP Monitor Results
Select a specific check run to inspect its results:
## What are ICMP Monitors?
ICMP monitors check if a host is reachable by sending ICMP Echo Requests (pings). Typical use cases include:
* Verifying reachability for servers, load balancers, or network appliances that don't expose HTTP endpoints or open TCP ports
* Detecting network-level outages before they're visible via HTTP endpoints
* Monitoring latency across regions to identify geographic performance issues
* Tracking packet loss to catch network quality degradation early
## How do ICMP monitors work?
ICMP monitors perform ping tests:
* Hostname resolution: If a hostname is provided, Checkly resolves it to an IP address
* Ping execution: Multiple ICMP Echo Request packets (configurable from 1–50, default: 10) are sent from your configured locations, with a 500 ms interval between each ping
* Response validation: ICMP Echo Reply packets are received. Round-trip latency and packet loss are measured and evaluated against your configured assertions
For example, pinging `checklyhq.com` with 3 pings returns:
```shell theme={null}
PING checklyhq.com (18.239.105.69): 56 bytes of data
64 bytes from 18.239.105.69: icmp_seq=0 ttl=247 time=6.6 ms
64 bytes from 18.239.105.69: icmp_seq=1 ttl=247 time=49.8 ms
64 bytes from 18.239.105.69: icmp_seq=2 ttl=247 time=6.6 ms
--- checklyhq.com ping statistics ---
3 packets transmitted, 3 received, 0% packet loss
round-trip min/avg/max/stddev = 6.573/20.993/49.812/24.958 ms
```
The response appears on the results page as both raw output and parsed JSON. You can use it as a reference to define [assertions](/docs/detect/uptime-monitoring/icmp-monitors/configuration#assertions) for expected values.
## ICMP Monitor Results
Select a specific check run to inspect its results:
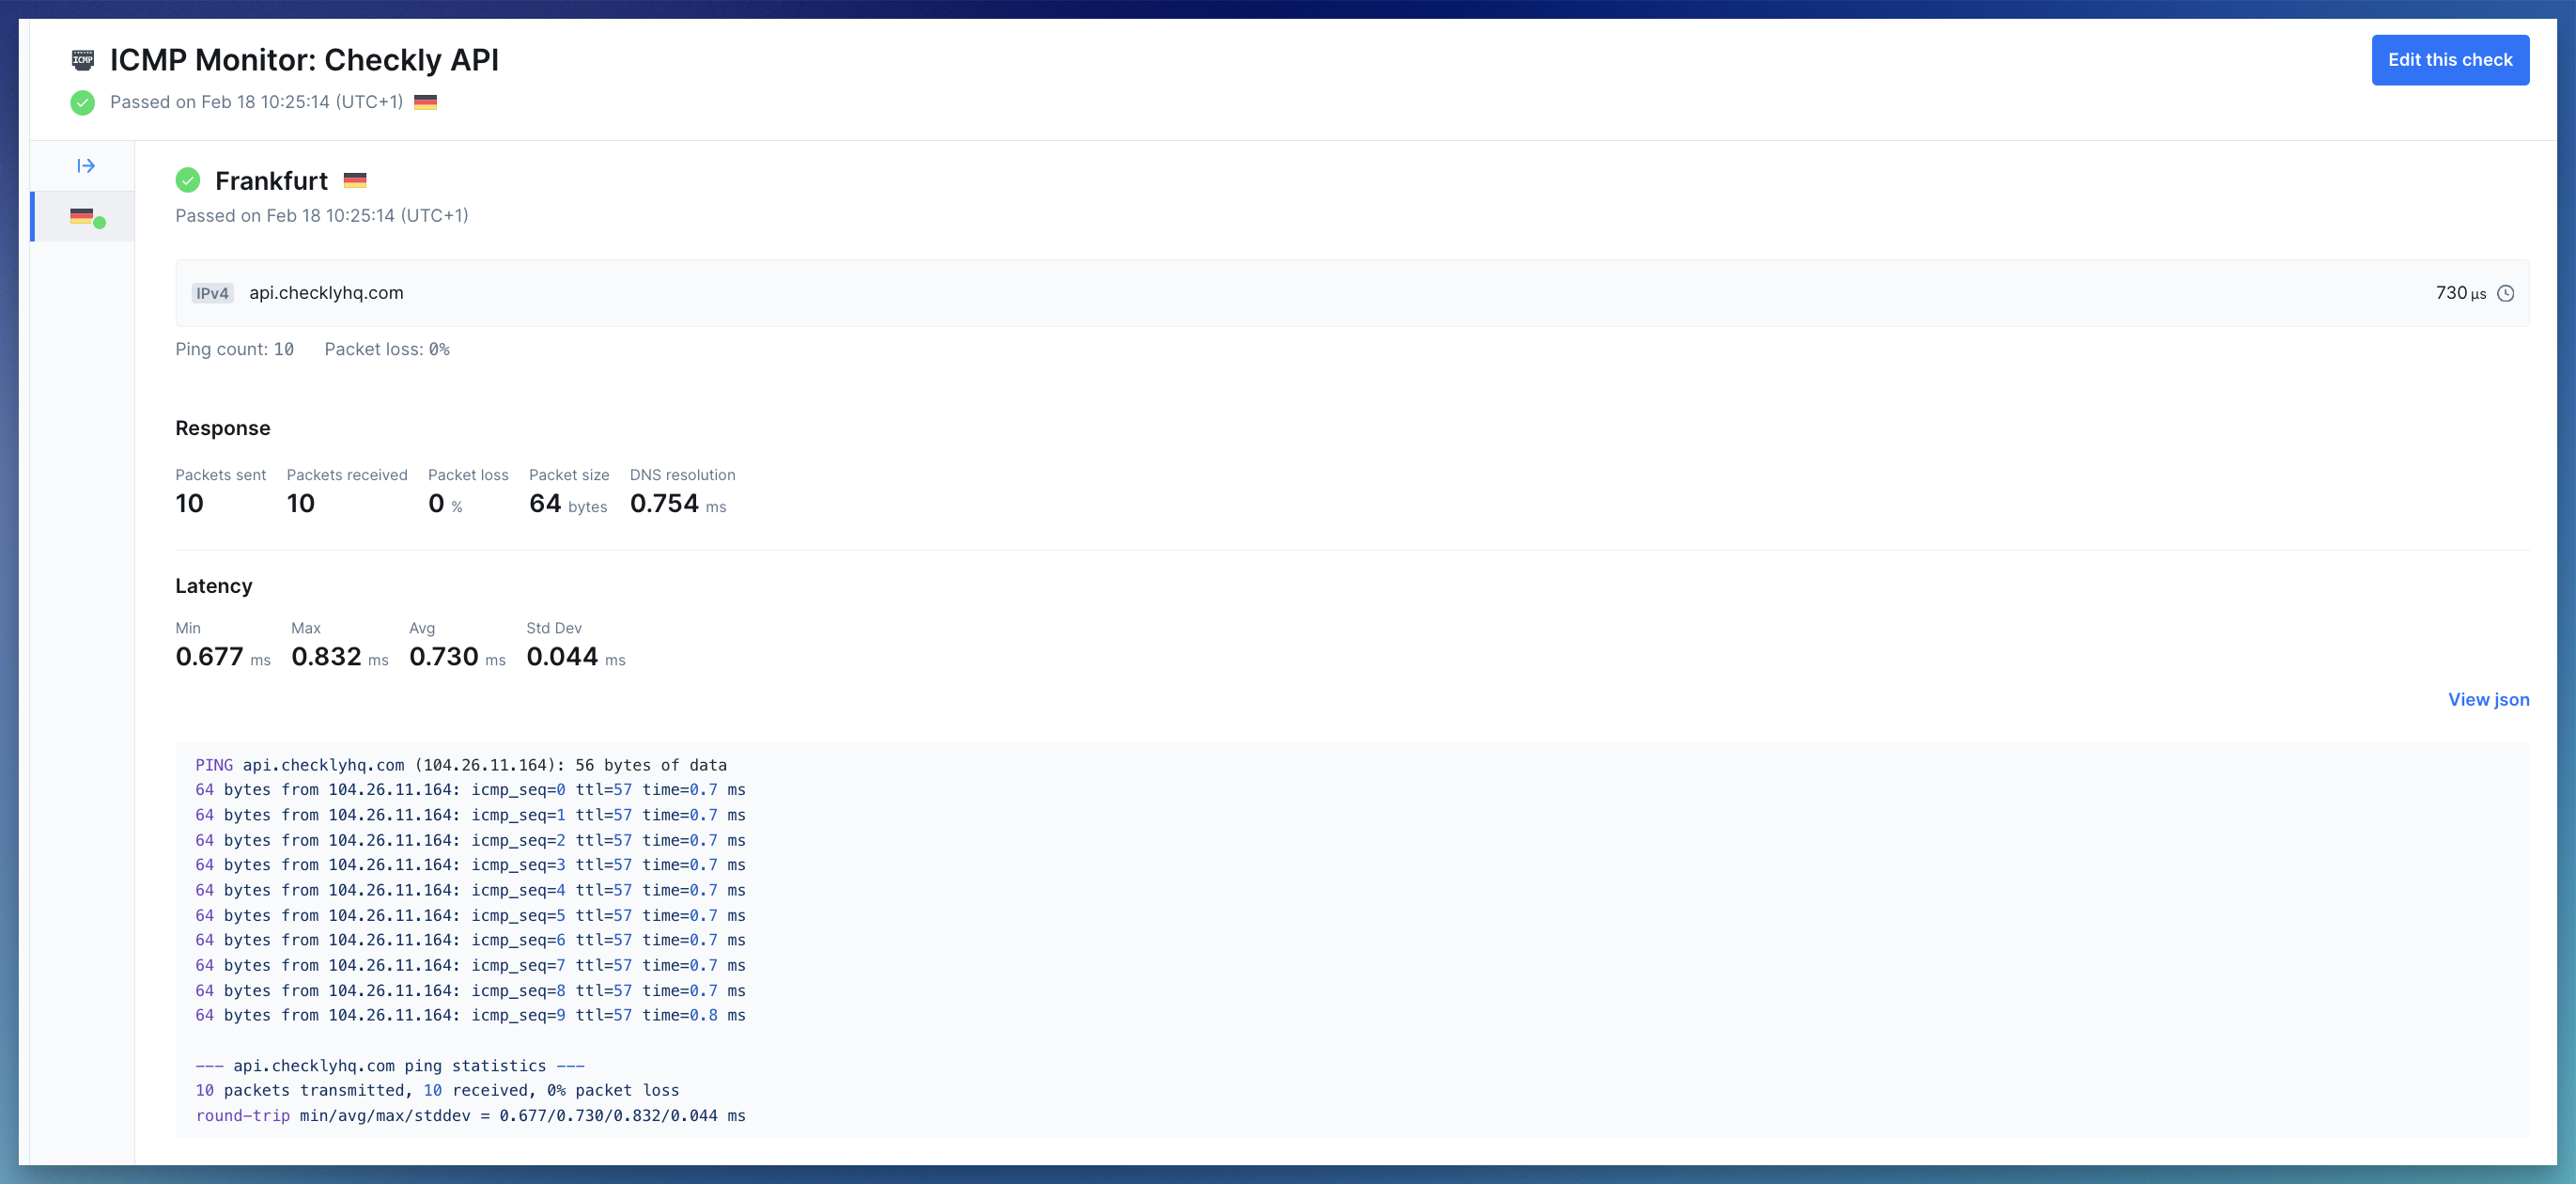 * **Summary:** Shows the target (hostname or IP), the monitor state (passed, degraded or failed), and average latency
* **Error details:** If a run fails, you’ll see the error status code and message to help diagnose what went wrong
* **Response metrics:** Network metrics collected during the run:
* Packet info: packets sent, packets received, packet loss, and packet size
* DNS resolution time: how long it took to resolve the hostname to an IP address
* Latency: min, max, avg, and std dev of round-trip times (RTT) across all received packets
* **Response payload:** Shows the raw ping result. Also available as [parsed JSON](/docs/detect/uptime-monitoring/icmp-monitors/configuration#json-response-schema)
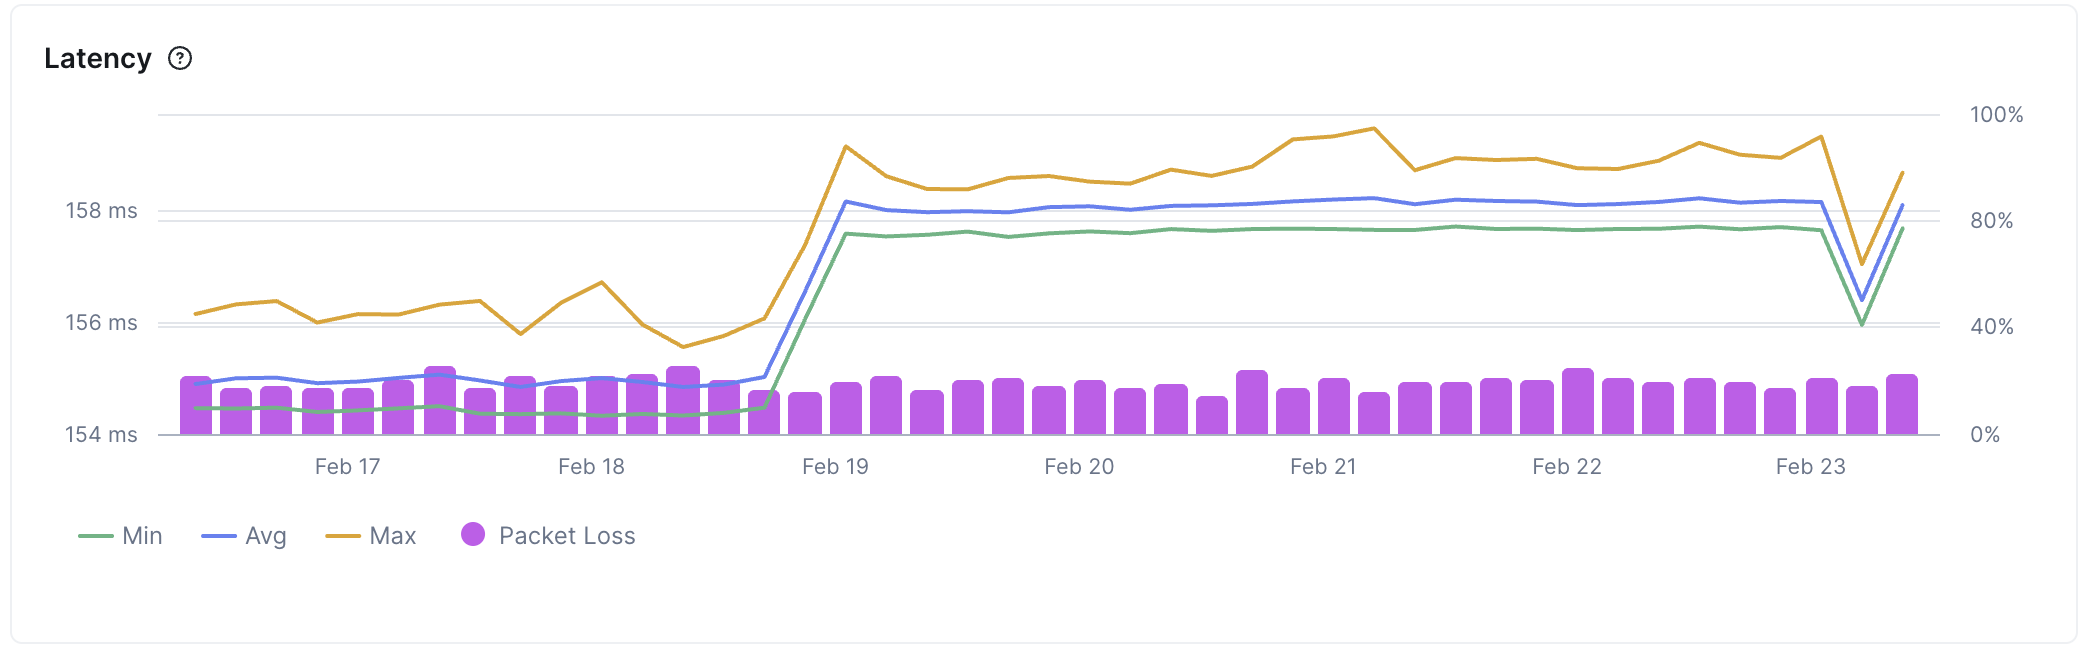
The monitor's overview page aggregates historical run data, allowing you to analyze latency and packet loss trends over time.
* **Summary:** Shows the target (hostname or IP), the monitor state (passed, degraded or failed), and average latency
* **Error details:** If a run fails, you’ll see the error status code and message to help diagnose what went wrong
* **Response metrics:** Network metrics collected during the run:
* Packet info: packets sent, packets received, packet loss, and packet size
* DNS resolution time: how long it took to resolve the hostname to an IP address
* Latency: min, max, avg, and std dev of round-trip times (RTT) across all received packets
* **Response payload:** Shows the raw ping result. Also available as [parsed JSON](/docs/detect/uptime-monitoring/icmp-monitors/configuration#json-response-schema)
The monitor's overview page aggregates historical run data, allowing you to analyze latency and packet loss trends over time.
 Learn more in our documentation on [Results](/docs/concepts/results).
## Troubleshooting Common Issues
Container runtimes drop `NET_RAW` by default. ICMP monitors need raw sockets, so the Checkly Agent needs this capability explicitly granted.
**How to fix**:
In **Kubernetes**, update your pod spec or Helm values:
* `allowPrivilegeEscalation=true` — prevents Kubernetes from setting the `no_new_privs` bit on the container process, which would otherwise block file capabilities (like `cap_net_raw+ep` on the ping binary) from taking effect.
* `capabilities.add=["NET_RAW"]` — adds `CAP_NET_RAW` to the container's bounding and permitted capability sets, allowing the kernel to open the raw sockets (`SOCK_RAW`).
```yaml theme={null}
securityContext:
allowPrivilegeEscalation: true
capabilities:
add: ["NET_RAW"]
```
In **Docker**:
```bash theme={null}
docker run --cap-add=NET_RAW ghcr.io/checkly/agent:latest
```
Docker does not set `no_new_privs` by default, so `--cap-add` is sufficient. If you run with `--security-opt no-new-privileges`, file capabilities on binaries will be blocked — remove that flag to allow `NET_RAW`.
`NET_RAW` only grants permission to create raw sockets. It does not escalate broader container privileges.
**Symptom**: ICMP monitor shows complete packet loss, but the website/API works fine
**Root cause**:
* Many organizations block ICMP echo request packets at the firewall, load balancer, or host level as a security measure
**How to detect and fix**:
1. **Verify HTTP connectivity**: Create an API or URL monitor for the same hostname to confirm it's reachable
2. **Check both protocols**: Test both IPv4 and IPv6, some hosts allow ICMP on one protocol but not the other
3. **Confirm with infrastructure team**: Ask if ICMP is intentionally blocked in security policies
**When to use a different monitor type**: If ICMP is deliberately blocked, use TCP, URL, or API checks instead to verify availability at the application layer
Learn more in our documentation on [Results](/docs/concepts/results).
## Troubleshooting Common Issues
Container runtimes drop `NET_RAW` by default. ICMP monitors need raw sockets, so the Checkly Agent needs this capability explicitly granted.
**How to fix**:
In **Kubernetes**, update your pod spec or Helm values:
* `allowPrivilegeEscalation=true` — prevents Kubernetes from setting the `no_new_privs` bit on the container process, which would otherwise block file capabilities (like `cap_net_raw+ep` on the ping binary) from taking effect.
* `capabilities.add=["NET_RAW"]` — adds `CAP_NET_RAW` to the container's bounding and permitted capability sets, allowing the kernel to open the raw sockets (`SOCK_RAW`).
```yaml theme={null}
securityContext:
allowPrivilegeEscalation: true
capabilities:
add: ["NET_RAW"]
```
In **Docker**:
```bash theme={null}
docker run --cap-add=NET_RAW ghcr.io/checkly/agent:latest
```
Docker does not set `no_new_privs` by default, so `--cap-add` is sufficient. If you run with `--security-opt no-new-privileges`, file capabilities on binaries will be blocked — remove that flag to allow `NET_RAW`.
`NET_RAW` only grants permission to create raw sockets. It does not escalate broader container privileges.
**Symptom**: ICMP monitor shows complete packet loss, but the website/API works fine
**Root cause**:
* Many organizations block ICMP echo request packets at the firewall, load balancer, or host level as a security measure
**How to detect and fix**:
1. **Verify HTTP connectivity**: Create an API or URL monitor for the same hostname to confirm it's reachable
2. **Check both protocols**: Test both IPv4 and IPv6, some hosts allow ICMP on one protocol but not the other
3. **Confirm with infrastructure team**: Ask if ICMP is intentionally blocked in security policies
**When to use a different monitor type**: If ICMP is deliberately blocked, use TCP, URL, or API checks instead to verify availability at the application layer