> ## Documentation Index
> Fetch the complete documentation index at: https://www.checklyhq.com/docs/llms.txt
> Use this file to discover all available pages before exploring further.
# Exporting Metrics & Data via Prometheus V2
> Export Checkly monitoring data to Prometheus for advanced metrics analysis and Grafana dashboards
This page describes a new V2 version of the Prometheus exporter. For information about the old Prometheus exporter, see the [Prometheus V1 docs](/integrations/observability/prometheus).
If you are using [Prometheus](https://prometheus.io/) for monitoring and the popular [Grafana](https://grafana.com/) stack
for dashboarding, you can expose Checkly's core metrics on a dedicated, secured endpoint.
## Activation
Activating this integration is simple.
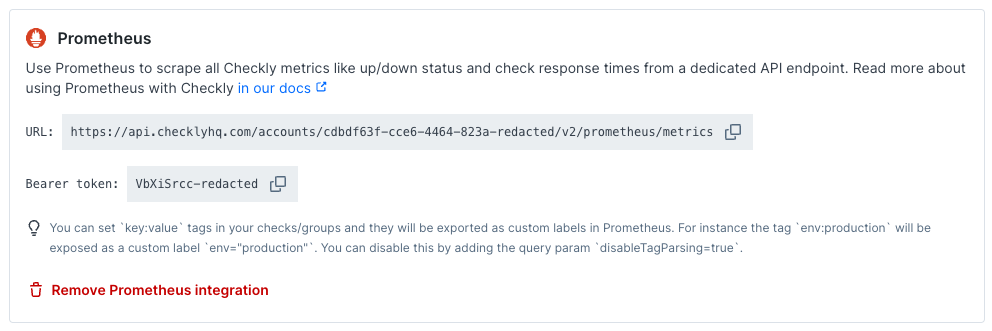
1. Navigate to the integrations tab on the account screen and click the 'Create Prometheus endpoint' button.
 2. We directly create an endpoint for you and provide its URL and the required Bearer token.
 3. Create a new job in your Prometheus `prometheus.yml` config and set up a scraping interval. Use a 60-second scrape interval and enable compression. Add the URL (divided into `metrics_path`, `scheme` and `target`) and `bearer_token`.
Here is an example
```yaml theme={null}
# prometheus.yml
- job_name: 'checkly'
scrape_interval: 60s
scrape_timeout: 30s
enable_compression: true
metrics_path: '/accounts//v2/prometheus/metrics'
bearer_token: ''
scheme: https
static_configs:
- targets: ['api.checklyhq.com']
```
Now restart Prometheus and you should see metrics coming in.
The Prometheus metrics endpoint has a rate limit of 50 requests per minute.
The responses from this endpoint are cached for 60 seconds.
Any request made to this endpoint within 60 seconds of the initial request will receive the cached response.
Use a scrape interval of 60 seconds. Shorter intervals fetch the same cached data.
If you run multiple Prometheus instances, each instance scrapes independently. Align their scrape intervals where possible.
Keep `enable_compression` set to `true` to reduce response size and make scrapes faster. Prometheus supports this setting in version 2.49 and later. If your account has many checks, use a longer `scrape_timeout`, such as 30 seconds, to give Prometheus enough time to scrape all metrics.
## Check Metrics
The Prometheus exporter exposes several metrics you can use to monitor the status of your checks, as well as to inspect detailed information such as [Web Vitals](/detect/synthetic-monitoring/browser-checks/performance-metrics).
The following metrics are available to monitor checks:
| Metric | Type | Description |
| -------------------------------------------------- | --------- | --------------------------------------------------------------------------------------------------------------------------------------------------------------------------------------------------------------------------------------- |
| `checkly_check_status` | Gauge | Indicates whether a given check is currently passing, degraded, or failing. |
| `checkly_check_result_total` | Counter | The number of passing, degraded, and failing check results. |
| `checkly_browser_check_web_vitals_seconds` | Histogram | The [Web Vitals](/detect/synthetic-monitoring/browser-checks/performance-metrics) timings. |
| `checkly_browser_check_duration_seconds` | Histogram | The total check duration. This includes all pages visited and any waits. |
| `checkly_browser_check_errors` | Histogram | The errors encountered during a full browser session. |
| `checkly_api_check_timing_seconds` | Histogram | The response time for the API request, as well as the duration of the different phases. |
| `checkly_url_monitor_timing_seconds` | Histogram | The response time for the HTTP request, as well as the duration of the different phases. |
| `checkly_tcp_monitor_timing_seconds` | Histogram | The response time for the TCP request, as well as the duration of the different phases. |
| `checkly_tcp_check_timing_seconds` | Histogram | **Deprecated:** use `checkly_tcp_monitor_timing_seconds` instead. Emits identical values. |
| `checkly_icmp_monitor_timing_seconds` | Histogram | The timing phases of the ICMP monitor, including DNS resolution and latency measurements (avg, min, max). |
| `checkly_icmp_monitor_packet_loss_ratio` | Gauge | The average packet loss ratio (0-1) for the ICMP monitor. |
| `checkly_dns_monitor_timing_seconds` | Histogram | The total duration of the DNS monitor. |
| `checkly_multistep_check_duration_seconds` | Histogram | The total check duration. This includes all requests done and any waits. |
| `checkly_heartbeat_last_success_timestamp_seconds` | Gauge | The Unix timestamp of the last successful heartbeat ping. A value of `0` means no successful ping has ever been received. |
| `checkly_heartbeat_expected_interval_seconds` | Gauge | The configured maximum interval between heartbeat pings, in seconds. Derived from the heartbeat monitor's period and period unit settings. |
| `checkly_time_to_ssl_expiry_seconds` | Gauge | The amount of time remaining before the SSL certificate of the monitored domain expires. See the [SSL certificate expiration docs](/communicate/alerts/ssl-expiration) for more information on monitoring SSL certificates with checks. |
The `checkly_check_status` and `checkly_check_result_total` metrics contain a `status` label with values `passing`, `failing`, and `degraded`.
The `checkly_check_status` gauge is `1` when the check has the status indicated by the `status` label and is `0` otherwise.
For example, if a check is passing the result will be:
```bash theme={null}
checkly_check_status{name="Passing Browser Check",status="passing"} 1
checkly_check_status{name="Passing Browser Check",status="failing"} 0
checkly_check_status{name="Passing Browser Check",status="degraded"} 0
```
`checkly_check_status` can be useful for viewing the current status of a check, whereas `checkly_check_result_total` can be useful for calculating overall statistics.
The metrics `checkly_browser_check_web_vitals_seconds`, `checkly_browser_check_errors`, `checkly_api_check_timing_seconds`, `checkly_tcp_monitor_timing_seconds`, `checkly_icmp_monitor_timing_seconds`, and `checkly_dns_monitor_timing_seconds` contain a `type` label.
This label indicates the different Web Vitals, error types, and timing phases being measured.
For `checkly_tcp_monitor_timing_seconds`, the `type` label has the following values: `dns`, `connection`, `data`, and `total`.
For `checkly_icmp_monitor_timing_seconds`, the `type` label has the following values: `dns` (DNS resolution time), `latency_avg`, `latency_min`, and `latency_max`.
For `checkly_dns_monitor_timing_seconds`, the `type` label has the value `total`.
`checkly_time_to_ssl_expiry_seconds` contains a `domain` label giving the domain of the monitored SSL certificate.
In addition, the check metrics all contain the following labels:
| Label | Description |
| ------------ | ---------------------------------------------------------------------------------------------------------- |
| `name` | The name of the check. |
| `check_id` | The unique UUID of the check. |
| `check_type` | The type of check: `api`, `browser`, `multi_step`, `playwright`, `heartbeat`, `tcp`, `icmp`, `dns`, `url`. |
| `muted` | Whether the check is muted, configured to not send alerts. |
| `activated` | Whether the check is activated. Deactivated checks aren't be run. |
| `group` | The name of the check group. |
| `tags` | The tags of the check. |
> You can set `key:value` tags in your checks and groups and they will be exported as custom labels in Prometheus. For instance the tag `env:production` will be exposed as a custom label `env="production"`. You can disable this by adding the query param `disableTagParsing=true`. Please note that Prometheus label names may only contain ASCII letters, numbers, as well as underscores (see the official [docs](https://prometheus.io/docs/concepts/data_model/)). Tags containing other characters in the label name will be sanitized.
> The counter and histogram metrics are reset every hour. These resets can be handled in Prometheus by using the [rate](https://prometheus.io/docs/prometheus/latest/querying/functions/#rate) or [increase](https://prometheus.io/docs/prometheus/latest/querying/functions/#increase) functions.
### Check Run Location Label
To avoid creating a high volume of metrics, by default the metrics don't include a label for the check run location. It is possible to enable this by adding the query param `locationLabelEnabled=true` to your API request. This will add a `location` label giving the location where the checks ran.
Since check status and SSL days remaining is only tracked on a per-check basis rather than by location, `checkly_check_status` and `checkly_time_to_ssl_expiry_seconds` do not have the `location` label included. Heartbeat metrics (`checkly_heartbeat_last_success_timestamp_seconds`, `checkly_heartbeat_expected_interval_seconds`, and heartbeat entries in `checkly_check_result_total`) also do not have a `location` label, since heartbeat monitors receive pings rather than running from specific locations. All other [check metrics](#check-metrics) will have the `location` label added.
Here is an example for how to set this in your `prometheus.yml` config:
```yaml theme={null}
# prometheus.yml
- job_name: 'checkly'
scrape_interval: 60s
scrape_timeout: 30s
enable_compression: true
metrics_path: '/accounts//v2/prometheus/metrics'
bearer_token: ''
scheme: https
static_configs:
- targets: ['api.checklyhq.com']
params:
locationLabelEnabled: ['true']
```
### Check Retry Attempts
By default, [retry attempts](/communicate/alerts/retries/) are not included in the reported metrics. For example, if a check is failing on the initial attempt and passing on the retry, `checkly_check_result_total` and other metrics will only report the final passing check result.
It is possible to include retry attempts by adding the query param `includeRetryAttempts=true` to your API request. Metrics reporting information on check results will then include retry attempts.
An exception to this behaviour is `checkly_check_status`, which reports whether the check is currently in a passing, degraded, or failing state. Since retry attempts don't affect the checks state and only the final check result determines the state, this metric ignores retry attempts regardless of the `includeRetryAttempts` setting. For example, if a check is failing on retry attempts and passing on the retry, `checkly_check_status` will report that the check is passing.
Here is an example for how to configure `includeRetryAttempts` in your `prometheus.yml` config:
```yaml theme={null}
# prometheus.yml
- job_name: 'checkly'
scrape_interval: 60s
scrape_timeout: 30s
enable_compression: true
metrics_path: '/accounts//v2/prometheus/metrics'
bearer_token: ''
scheme: https
static_configs:
- targets: ['api.checklyhq.com']
params:
includeRetryAttempts: ['true']
```
### PromQL Examples
This section contains a few PromQL queries that you can use to start working with the Prometheus data.
#### Currently failing checks
To graph whether checks are passing or failing, use the query:
```bash theme={null}
checkly_check_status{status="passing"}
```
Passing checks will have the value `1` while failing and degraded checks will have the value `0`.
This can be used to build a [Grafana table](https://grafana.com/docs/grafana/latest/panels-visualizations/visualizations/table/) of currently failing checks.
#### Failure percentage
To calculate the percentage of check runs that failed in the last 24 hours, use:
```bash theme={null}
increase(checkly_check_result_total{status="failing"}[24h]) / ignoring(status) sum without (status) (increase(checkly_check_result_total[24h]))
```
#### Histogram averages
The different histogram metrics can all be used to compute averages. For example, query the average web vitals times for a check using:
```bash theme={null}
sum by(type) (rate(checkly_browser_check_web_vitals_seconds_sum{name="Check Name"}[30m])) / sum by(type) (rate(checkly_browser_check_web_vitals_seconds_count{name="Check Name"}[30m]))
```
## Heartbeat Metrics
[Heartbeat monitors](/detect/uptime-monitoring/heartbeat-monitors/overview) are passive checks that wait for your scheduled jobs and automated processes to send a ping. The Prometheus exporter includes heartbeat checks in the standard `checkly_check_status` and `checkly_check_result_total` metrics, plus two heartbeat-specific gauges designed for [dead man's switch](https://en.wikipedia.org/wiki/Dead_man%27s_switch) alerting.
* **`checkly_heartbeat_last_success_timestamp_seconds`** — The Unix timestamp of the last successful ping, searched across the entire event history (no time window). A value of `0` means no successful ping has ever been received — this immediately triggers a dead man's switch alert since `time() - 0` produces a very large value.
* **`checkly_heartbeat_expected_interval_seconds`** — The maximum expected time between pings, derived from the heartbeat monitor's configured period and period unit (e.g., `5 minutes` = `300` seconds). Use this as a threshold for alerting.
### How heartbeats map to `checkly_check_result_total`
Heartbeat checks contribute to `checkly_check_result_total` using a 1-hour count window, the same as other check types. The `status` label values map to heartbeat event states as follows:
| `status` label | Heartbeat states counted |
| -------------- | ------------------------------------------------------------ |
| `passing` | `RECEIVED`, `EARLY`, `GRACE`, `LATE` — any ping that arrived |
| `failing` | `FAILING` — no ping received before the grace period expired |
| `degraded` | Always `0` — heartbeat monitors do not have a degraded state |
### Dead Man's Switch PromQL Examples
#### Alert when a heartbeat ping is overdue
Compare the current time against the last success timestamp. If the difference exceeds the expected interval, the job has missed its window:
```bash theme={null}
time() - checkly_heartbeat_last_success_timestamp_seconds > checkly_heartbeat_expected_interval_seconds
```
#### Alert with a safety margin
Add a grace period multiplier (e.g., 1.5x) to avoid false alarms from minor delays:
```bash theme={null}
time() - checkly_heartbeat_last_success_timestamp_seconds > 1.5 * checkly_heartbeat_expected_interval_seconds
```
#### Grafana table of heartbeat health
Show how long ago each heartbeat was last seen:
```bash theme={null}
time() - checkly_heartbeat_last_success_timestamp_seconds
```
## Private Location Metrics
The Prometheus exporter also contains metrics for monitoring [Private Locations](/platform/private-locations/overview). These metrics can be used to ensure that your Private Locations have enough Checkly Agent instances running to execute all of your checks, and to drive [agent autoscaling](/platform/private-locations/autoscaling).
The following metrics are available to monitor Private Locations:
| Metric | Type | Description |
| ----------------------------------------------------- | ----- | ---------------------------------------------------------------------------------------------------------------------------------------------------------------------------------------------------------------------------------------------------------- |
| `checkly_private_location_queue_size` | Gauge | The number of check runs scheduled to the Private Location and waiting to be executed. A high value indicates that checks are becoming backlogged and that you may need to [scale your Checkly Agents](/platform/private-locations/scaling-redundancy). |
| `checkly_private_location_oldest_scheduled_check_run` | Gauge | The age in seconds of the oldest check run job scheduled to the Private Location queue. A high value indicates that checks are becoming backlogged. |
| `checkly_private_location_queue_duration_ms` | Gauge | The scheduling delay in milliseconds for check runs routed through a Private Location, by queue and `stat`. Derived from the last 2 minutes of check run data. Used to evaluate whether sufficient agent capacity is provisioned for the Private Location. |
| `checkly_private_location_agent_count` | Gauge | The number of agents connected for the Private Location. |
| `checkly_private_location_check_runs` | Gauge | The count of check runs in the Private Location, broken down by lifecycle state via the `state` label. Used as the signal for [autoscaling Checkly Agents](/platform/private-locations/autoscaling). |
The Private Location metrics all contain the following labels:
| Label | Description |
| ---------------------------- | -------------------------------------------------------- |
| `private_location_name` | the name of the Private Location. |
| `private_location_slug_name` | the Private Location's human readable unique identifier. |
| `private_location_id` | the Private Location's UUID. |
`checkly_private_location_check_runs` additionally carries a `state` label. The values relevant for autoscaling are:
* `queued` — the check run has been scheduled but not yet picked up by an agent.
* `inflight` — the check run is currently being executed by an agent.
`checkly_private_location_queue_duration_ms` additionally carries two labels:
* `stat` — the statistical aggregation over the 2-minute window. Values: `avg`, `p90`, `p99`.
* `queue` — the internal routing queue the check run was scheduled to. Values: `uptime`, `main`.
This gauge is aggregated on a \~1 minute interval, so check runs that start and finish within that window may be excluded.
3. Create a new job in your Prometheus `prometheus.yml` config and set up a scraping interval. Use a 60-second scrape interval and enable compression. Add the URL (divided into `metrics_path`, `scheme` and `target`) and `bearer_token`.
Here is an example
```yaml theme={null}
# prometheus.yml
- job_name: 'checkly'
scrape_interval: 60s
scrape_timeout: 30s
enable_compression: true
metrics_path: '/accounts//v2/prometheus/metrics'
bearer_token: ''
scheme: https
static_configs:
- targets: ['api.checklyhq.com']
```
Now restart Prometheus and you should see metrics coming in.
The Prometheus metrics endpoint has a rate limit of 50 requests per minute.
The responses from this endpoint are cached for 60 seconds.
Any request made to this endpoint within 60 seconds of the initial request will receive the cached response.
Use a scrape interval of 60 seconds. Shorter intervals fetch the same cached data.
If you run multiple Prometheus instances, each instance scrapes independently. Align their scrape intervals where possible.
Keep `enable_compression` set to `true` to reduce response size and make scrapes faster. Prometheus supports this setting in version 2.49 and later. If your account has many checks, use a longer `scrape_timeout`, such as 30 seconds, to give Prometheus enough time to scrape all metrics.
## Check Metrics
The Prometheus exporter exposes several metrics you can use to monitor the status of your checks, as well as to inspect detailed information such as [Web Vitals](/detect/synthetic-monitoring/browser-checks/performance-metrics).
The following metrics are available to monitor checks:
| Metric | Type | Description |
| -------------------------------------------------- | --------- | --------------------------------------------------------------------------------------------------------------------------------------------------------------------------------------------------------------------------------------- |
| `checkly_check_status` | Gauge | Indicates whether a given check is currently passing, degraded, or failing. |
| `checkly_check_result_total` | Counter | The number of passing, degraded, and failing check results. |
| `checkly_browser_check_web_vitals_seconds` | Histogram | The [Web Vitals](/detect/synthetic-monitoring/browser-checks/performance-metrics) timings. |
| `checkly_browser_check_duration_seconds` | Histogram | The total check duration. This includes all pages visited and any waits. |
| `checkly_browser_check_errors` | Histogram | The errors encountered during a full browser session. |
| `checkly_api_check_timing_seconds` | Histogram | The response time for the API request, as well as the duration of the different phases. |
| `checkly_url_monitor_timing_seconds` | Histogram | The response time for the HTTP request, as well as the duration of the different phases. |
| `checkly_tcp_monitor_timing_seconds` | Histogram | The response time for the TCP request, as well as the duration of the different phases. |
| `checkly_tcp_check_timing_seconds` | Histogram | **Deprecated:** use `checkly_tcp_monitor_timing_seconds` instead. Emits identical values. |
| `checkly_icmp_monitor_timing_seconds` | Histogram | The timing phases of the ICMP monitor, including DNS resolution and latency measurements (avg, min, max). |
| `checkly_icmp_monitor_packet_loss_ratio` | Gauge | The average packet loss ratio (0-1) for the ICMP monitor. |
| `checkly_dns_monitor_timing_seconds` | Histogram | The total duration of the DNS monitor. |
| `checkly_multistep_check_duration_seconds` | Histogram | The total check duration. This includes all requests done and any waits. |
| `checkly_heartbeat_last_success_timestamp_seconds` | Gauge | The Unix timestamp of the last successful heartbeat ping. A value of `0` means no successful ping has ever been received. |
| `checkly_heartbeat_expected_interval_seconds` | Gauge | The configured maximum interval between heartbeat pings, in seconds. Derived from the heartbeat monitor's period and period unit settings. |
| `checkly_time_to_ssl_expiry_seconds` | Gauge | The amount of time remaining before the SSL certificate of the monitored domain expires. See the [SSL certificate expiration docs](/communicate/alerts/ssl-expiration) for more information on monitoring SSL certificates with checks. |
The `checkly_check_status` and `checkly_check_result_total` metrics contain a `status` label with values `passing`, `failing`, and `degraded`.
The `checkly_check_status` gauge is `1` when the check has the status indicated by the `status` label and is `0` otherwise.
For example, if a check is passing the result will be:
```bash theme={null}
checkly_check_status{name="Passing Browser Check",status="passing"} 1
checkly_check_status{name="Passing Browser Check",status="failing"} 0
checkly_check_status{name="Passing Browser Check",status="degraded"} 0
```
`checkly_check_status` can be useful for viewing the current status of a check, whereas `checkly_check_result_total` can be useful for calculating overall statistics.
The metrics `checkly_browser_check_web_vitals_seconds`, `checkly_browser_check_errors`, `checkly_api_check_timing_seconds`, `checkly_tcp_monitor_timing_seconds`, `checkly_icmp_monitor_timing_seconds`, and `checkly_dns_monitor_timing_seconds` contain a `type` label.
This label indicates the different Web Vitals, error types, and timing phases being measured.
For `checkly_tcp_monitor_timing_seconds`, the `type` label has the following values: `dns`, `connection`, `data`, and `total`.
For `checkly_icmp_monitor_timing_seconds`, the `type` label has the following values: `dns` (DNS resolution time), `latency_avg`, `latency_min`, and `latency_max`.
For `checkly_dns_monitor_timing_seconds`, the `type` label has the value `total`.
`checkly_time_to_ssl_expiry_seconds` contains a `domain` label giving the domain of the monitored SSL certificate.
In addition, the check metrics all contain the following labels:
| Label | Description |
| ------------ | ---------------------------------------------------------------------------------------------------------- |
| `name` | The name of the check. |
| `check_id` | The unique UUID of the check. |
| `check_type` | The type of check: `api`, `browser`, `multi_step`, `playwright`, `heartbeat`, `tcp`, `icmp`, `dns`, `url`. |
| `muted` | Whether the check is muted, configured to not send alerts. |
| `activated` | Whether the check is activated. Deactivated checks aren't be run. |
| `group` | The name of the check group. |
| `tags` | The tags of the check. |
> You can set `key:value` tags in your checks and groups and they will be exported as custom labels in Prometheus. For instance the tag `env:production` will be exposed as a custom label `env="production"`. You can disable this by adding the query param `disableTagParsing=true`. Please note that Prometheus label names may only contain ASCII letters, numbers, as well as underscores (see the official [docs](https://prometheus.io/docs/concepts/data_model/)). Tags containing other characters in the label name will be sanitized.
> The counter and histogram metrics are reset every hour. These resets can be handled in Prometheus by using the [rate](https://prometheus.io/docs/prometheus/latest/querying/functions/#rate) or [increase](https://prometheus.io/docs/prometheus/latest/querying/functions/#increase) functions.
### Check Run Location Label
To avoid creating a high volume of metrics, by default the metrics don't include a label for the check run location. It is possible to enable this by adding the query param `locationLabelEnabled=true` to your API request. This will add a `location` label giving the location where the checks ran.
Since check status and SSL days remaining is only tracked on a per-check basis rather than by location, `checkly_check_status` and `checkly_time_to_ssl_expiry_seconds` do not have the `location` label included. Heartbeat metrics (`checkly_heartbeat_last_success_timestamp_seconds`, `checkly_heartbeat_expected_interval_seconds`, and heartbeat entries in `checkly_check_result_total`) also do not have a `location` label, since heartbeat monitors receive pings rather than running from specific locations. All other [check metrics](#check-metrics) will have the `location` label added.
Here is an example for how to set this in your `prometheus.yml` config:
```yaml theme={null}
# prometheus.yml
- job_name: 'checkly'
scrape_interval: 60s
scrape_timeout: 30s
enable_compression: true
metrics_path: '/accounts//v2/prometheus/metrics'
bearer_token: ''
scheme: https
static_configs:
- targets: ['api.checklyhq.com']
params:
locationLabelEnabled: ['true']
```
### Check Retry Attempts
By default, [retry attempts](/communicate/alerts/retries/) are not included in the reported metrics. For example, if a check is failing on the initial attempt and passing on the retry, `checkly_check_result_total` and other metrics will only report the final passing check result.
It is possible to include retry attempts by adding the query param `includeRetryAttempts=true` to your API request. Metrics reporting information on check results will then include retry attempts.
An exception to this behaviour is `checkly_check_status`, which reports whether the check is currently in a passing, degraded, or failing state. Since retry attempts don't affect the checks state and only the final check result determines the state, this metric ignores retry attempts regardless of the `includeRetryAttempts` setting. For example, if a check is failing on retry attempts and passing on the retry, `checkly_check_status` will report that the check is passing.
Here is an example for how to configure `includeRetryAttempts` in your `prometheus.yml` config:
```yaml theme={null}
# prometheus.yml
- job_name: 'checkly'
scrape_interval: 60s
scrape_timeout: 30s
enable_compression: true
metrics_path: '/accounts//v2/prometheus/metrics'
bearer_token: ''
scheme: https
static_configs:
- targets: ['api.checklyhq.com']
params:
includeRetryAttempts: ['true']
```
### PromQL Examples
This section contains a few PromQL queries that you can use to start working with the Prometheus data.
#### Currently failing checks
To graph whether checks are passing or failing, use the query:
```bash theme={null}
checkly_check_status{status="passing"}
```
Passing checks will have the value `1` while failing and degraded checks will have the value `0`.
This can be used to build a [Grafana table](https://grafana.com/docs/grafana/latest/panels-visualizations/visualizations/table/) of currently failing checks.
#### Failure percentage
To calculate the percentage of check runs that failed in the last 24 hours, use:
```bash theme={null}
increase(checkly_check_result_total{status="failing"}[24h]) / ignoring(status) sum without (status) (increase(checkly_check_result_total[24h]))
```
#### Histogram averages
The different histogram metrics can all be used to compute averages. For example, query the average web vitals times for a check using:
```bash theme={null}
sum by(type) (rate(checkly_browser_check_web_vitals_seconds_sum{name="Check Name"}[30m])) / sum by(type) (rate(checkly_browser_check_web_vitals_seconds_count{name="Check Name"}[30m]))
```
## Heartbeat Metrics
[Heartbeat monitors](/detect/uptime-monitoring/heartbeat-monitors/overview) are passive checks that wait for your scheduled jobs and automated processes to send a ping. The Prometheus exporter includes heartbeat checks in the standard `checkly_check_status` and `checkly_check_result_total` metrics, plus two heartbeat-specific gauges designed for [dead man's switch](https://en.wikipedia.org/wiki/Dead_man%27s_switch) alerting.
* **`checkly_heartbeat_last_success_timestamp_seconds`** — The Unix timestamp of the last successful ping, searched across the entire event history (no time window). A value of `0` means no successful ping has ever been received — this immediately triggers a dead man's switch alert since `time() - 0` produces a very large value.
* **`checkly_heartbeat_expected_interval_seconds`** — The maximum expected time between pings, derived from the heartbeat monitor's configured period and period unit (e.g., `5 minutes` = `300` seconds). Use this as a threshold for alerting.
### How heartbeats map to `checkly_check_result_total`
Heartbeat checks contribute to `checkly_check_result_total` using a 1-hour count window, the same as other check types. The `status` label values map to heartbeat event states as follows:
| `status` label | Heartbeat states counted |
| -------------- | ------------------------------------------------------------ |
| `passing` | `RECEIVED`, `EARLY`, `GRACE`, `LATE` — any ping that arrived |
| `failing` | `FAILING` — no ping received before the grace period expired |
| `degraded` | Always `0` — heartbeat monitors do not have a degraded state |
### Dead Man's Switch PromQL Examples
#### Alert when a heartbeat ping is overdue
Compare the current time against the last success timestamp. If the difference exceeds the expected interval, the job has missed its window:
```bash theme={null}
time() - checkly_heartbeat_last_success_timestamp_seconds > checkly_heartbeat_expected_interval_seconds
```
#### Alert with a safety margin
Add a grace period multiplier (e.g., 1.5x) to avoid false alarms from minor delays:
```bash theme={null}
time() - checkly_heartbeat_last_success_timestamp_seconds > 1.5 * checkly_heartbeat_expected_interval_seconds
```
#### Grafana table of heartbeat health
Show how long ago each heartbeat was last seen:
```bash theme={null}
time() - checkly_heartbeat_last_success_timestamp_seconds
```
## Private Location Metrics
The Prometheus exporter also contains metrics for monitoring [Private Locations](/platform/private-locations/overview). These metrics can be used to ensure that your Private Locations have enough Checkly Agent instances running to execute all of your checks, and to drive [agent autoscaling](/platform/private-locations/autoscaling).
The following metrics are available to monitor Private Locations:
| Metric | Type | Description |
| ----------------------------------------------------- | ----- | ---------------------------------------------------------------------------------------------------------------------------------------------------------------------------------------------------------------------------------------------------------- |
| `checkly_private_location_queue_size` | Gauge | The number of check runs scheduled to the Private Location and waiting to be executed. A high value indicates that checks are becoming backlogged and that you may need to [scale your Checkly Agents](/platform/private-locations/scaling-redundancy). |
| `checkly_private_location_oldest_scheduled_check_run` | Gauge | The age in seconds of the oldest check run job scheduled to the Private Location queue. A high value indicates that checks are becoming backlogged. |
| `checkly_private_location_queue_duration_ms` | Gauge | The scheduling delay in milliseconds for check runs routed through a Private Location, by queue and `stat`. Derived from the last 2 minutes of check run data. Used to evaluate whether sufficient agent capacity is provisioned for the Private Location. |
| `checkly_private_location_agent_count` | Gauge | The number of agents connected for the Private Location. |
| `checkly_private_location_check_runs` | Gauge | The count of check runs in the Private Location, broken down by lifecycle state via the `state` label. Used as the signal for [autoscaling Checkly Agents](/platform/private-locations/autoscaling). |
The Private Location metrics all contain the following labels:
| Label | Description |
| ---------------------------- | -------------------------------------------------------- |
| `private_location_name` | the name of the Private Location. |
| `private_location_slug_name` | the Private Location's human readable unique identifier. |
| `private_location_id` | the Private Location's UUID. |
`checkly_private_location_check_runs` additionally carries a `state` label. The values relevant for autoscaling are:
* `queued` — the check run has been scheduled but not yet picked up by an agent.
* `inflight` — the check run is currently being executed by an agent.
`checkly_private_location_queue_duration_ms` additionally carries two labels:
* `stat` — the statistical aggregation over the 2-minute window. Values: `avg`, `p90`, `p99`.
* `queue` — the internal routing queue the check run was scheduled to. Values: `uptime`, `main`.
This gauge is aggregated on a \~1 minute interval, so check runs that start and finish within that window may be excluded.