> ## Documentation Index
> Fetch the complete documentation index at: https://checklyhq.com/docs/llms.txt
> Use this file to discover all available pages before exploring further.
# Send Alerts via Prometheus
> Configure Prometheus integration to receive real-time alerts from Checkly monitors
This page describes the v1 version of the Prometheus exporter. If you are just starting with our Prometheus integration, we recommend using our [v2 version](/integrations/observability/prometheus-v2).
Checkly exposes the following metrics in a Prometheus-compatible format.
| Metric | Description |
| ----------------------------------------------------- | ------------------------------------------------------------------------------------------------------------------------------------------------------------------------------------------- |
| `checkly_check_status` | Whether a check is passing or failing. `1` means the check is passing, `0` means the check is failing. |
| `checkly_check_degraded_status` | Whether a check is degraded. `1` means the check is not-degraded, `0` means the check is degraded. |
| `checkly_check_result` | The last collected response time for a check in a specific region. This means you get one `checkly_check_result` stanza for each region the check is configured to run in. |
| `checkly_private_location_queue_size` | The number of check runs scheduled to a private location and waiting to be executed. In particular, this metric reports the maximum count of scheduled check runs over the past 10 minutes. |
| `checkly_private_location_oldest_scheduled_check_run` | The age in seconds of the oldest scheduled job in the private location's queue. In particular, this metric reports the maximum age from the past 10 minutes. |
| `checkly_private_location_agent_count` | The number of connected Checkly Agents connected for a private location. An Agent is considered as connected if it's communicated with the Checkly infrastructure in the past 10 minutes. |
Each `checkly_check` metric has the following labels:
* `check_name`, the name of your check.
* `check_type`, either `api` or `browser`.
* `tags`, this check's tags.
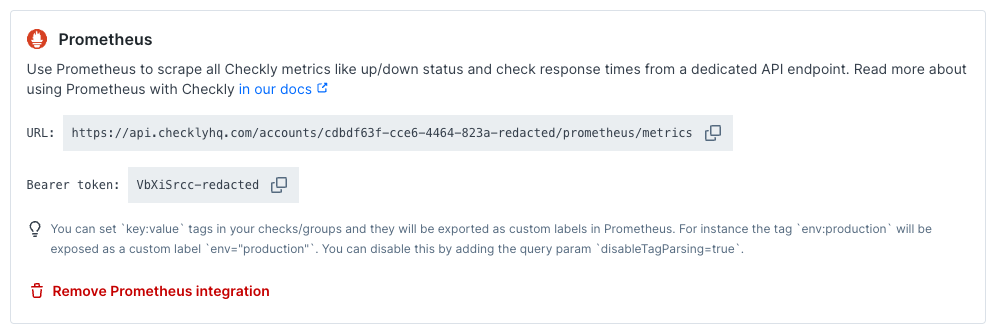
> You can set `key:value` tags in your checks/groups and they will be exported as custom labels in Prometheus. For instance the tag `env:production` will be exposed as a custom label `env="production"`. You can disable this by adding the query param `disableTagParsing=true`.
The `checkly_private_location` metrics contain the labels:
* `private_location_name`, the name of the private location.
* `private_location_slug_name`, the private location's human readable unique identifier.
* `private_location_id`, the private location's UUID.
> If a private location has no check runs for six hours, it will be considered inactive and `checkly_private_location` metrics won't be reported for it.
Here is an example:
```bash theme={null}
# HELP checkly_check_status The status of the last check. 1 is passing, 0 is failing
# TYPE checkly_check_status gauge
checkly_check_status{check_name="Customer API",check_type="api",muted="false",activated="true",tags="alerts,public"} 1
checkly_check_status{check_name="Email login",check_type="browser",muted="false",activated="true",tags="auth,browser-checks,public"} 0
# HELP checkly_check_degraded_status The degraded status of the last check. 1 is not-degraded, 0 is degraded
# TYPE checkly_check_degraded_status gauge
checkly_check_degraded_status{check_name="Customer API",check_type="api",muted="false",activated="true",tags="alerts,public"} 0
checkly_check_degraded_status{check_name="Email login",check_type="browser",muted="false",activated="true",tags="auth,browser-checks,public"} 1
# HELP checkly_check_result The response time of the last check per region.
# TYPE checkly_check_result gauge
checkly_check_result{check_name="Customer API",check_type="api",region="ap-northeast-2",tags="alerts,public"} 1168
checkly_check_result{check_name="Customer API",check_type="api",region="ap-southeast-1",tags="alerts,public"} 932
checkly_check_result{check_name="Customer API",check_type="api",region="ca-central-1",tags="alerts,public"} 424
checkly_check_result{check_name="Customer API",check_type="api",region="eu-west-2",tags="alerts,public"} 138
checkly_check_result{check_name="Customer API",check_type="api",region="us-east-2",tags="alerts,public"} 432
checkly_check_result{check_name="Email login",check_type="browser",region="ap-south-1",tags="auth,browser-checks,public"} 10174
# HELP checkly_private_location_queue_size The number of check runs scheduled to the private location and waiting to be executed.
# TYPE checkly_private_location_queue_size gauge
checkly_private_location_queue_size{private_location_name="Internal CI",private_location_slug_name="internal-ci",private_location_id="cac52f2d-8b8c-4ca5-9711-1836be02eda4"} 0
# HELP checkly_private_location_oldest_scheduled_check_run The age in seconds of the oldest check run job scheduled to the private location queue.
# TYPE checkly_private_location_oldest_scheduled_check_run gauge
checkly_private_location_oldest_scheduled_check_run{private_location_name="Internal CI",private_location_slug_name="internal-ci",private_location_id="cac52f2d-8b8c-4ca5-9711-1836be02eda4"} 0
# HELP checkly_private_location_agent_count The number of agents connected for the private location.
# TYPE checkly_private_location_agent_count gauge
checkly_private_location_agent_count{private_location_name="Internal CI",private_location_slug_name="internal-ci",private_location_id="cac52f2d-8b8c-4ca5-9711-1836be02eda4"} 1
```
Notice that:
* The check for "Email login" is failing.
* The check for "Customer API" is degraded, but not failing.
* The `checkly_check_status` metric has `muted` and `activated` labels, reflecting if a check is sending out alerts or is actually
running.
* The `checkly_check_result` metric has a `region` label.
* The private location "Internal CI" has one Checkly Agent connected. From `checkly_private_location_queue_size` and `checkly_private_location_oldest_scheduled_check_run`, we see that there's no backlog of check run jobs.
Activating this integration is simple.
1. Navigate to the integrations tab on the account screen and click the 'Create Prometheus endpoint' button.
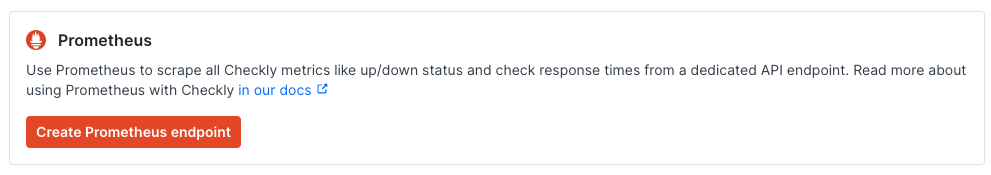 2. We directly create an endpoint for you and provide its URL and the required Bearer token.
 3. Create a new job in your Prometheus `prometheus.yml` config and set up a scraping interval. We recommend an interval
between 30 seconds and 60 seconds. Add the URL (divided into `metrics_path`, `scheme` and `target`) and `bearer_token`.
Here is an example
```yaml theme={null}
# prometheus.yml
- job_name: 'checkly'
scrape_interval: 30s
metrics_path: '/accounts/993adb-8ac6-3432-9e80-cb43437bf263/prometheus/metrics'
bearer_token: 'lSAYpOoLtdAa7ajasoNNS234'
scheme: https
static_configs:
- targets: ['api.checklyhq.com']
```
Now restart Prometheus and you should see metrics coming in.
💡 Check out our [blog post on using this integration with Prometheus and Grafana](https://blog.checklyhq.com/monitoring-website-performance-with-checkly-prometheus-grafana/) for some cool real-life applications.
3. Create a new job in your Prometheus `prometheus.yml` config and set up a scraping interval. We recommend an interval
between 30 seconds and 60 seconds. Add the URL (divided into `metrics_path`, `scheme` and `target`) and `bearer_token`.
Here is an example
```yaml theme={null}
# prometheus.yml
- job_name: 'checkly'
scrape_interval: 30s
metrics_path: '/accounts/993adb-8ac6-3432-9e80-cb43437bf263/prometheus/metrics'
bearer_token: 'lSAYpOoLtdAa7ajasoNNS234'
scheme: https
static_configs:
- targets: ['api.checklyhq.com']
```
Now restart Prometheus and you should see metrics coming in.
💡 Check out our [blog post on using this integration with Prometheus and Grafana](https://blog.checklyhq.com/monitoring-website-performance-with-checkly-prometheus-grafana/) for some cool real-life applications.