> ## Documentation Index
> Fetch the complete documentation index at: https://www.checklyhq.com/docs/llms.txt
> Use this file to discover all available pages before exploring further.
# Debugging Playwright Tests with AI Agents
> Let your coding agent debug failing Playwright tests: read the error-context.md attachment, analyze traces in the terminal with npx playwright trace, and step through live tests with --debug=cli.
export const YoutubeCallout = ({children}) =>
{children}
;
If you're using Playwright for end-to-end testing, you should check out [Playwright Check Suites](/docs/detect/synthetic-monitoring/playwright-checks/overview) and start testing in production.
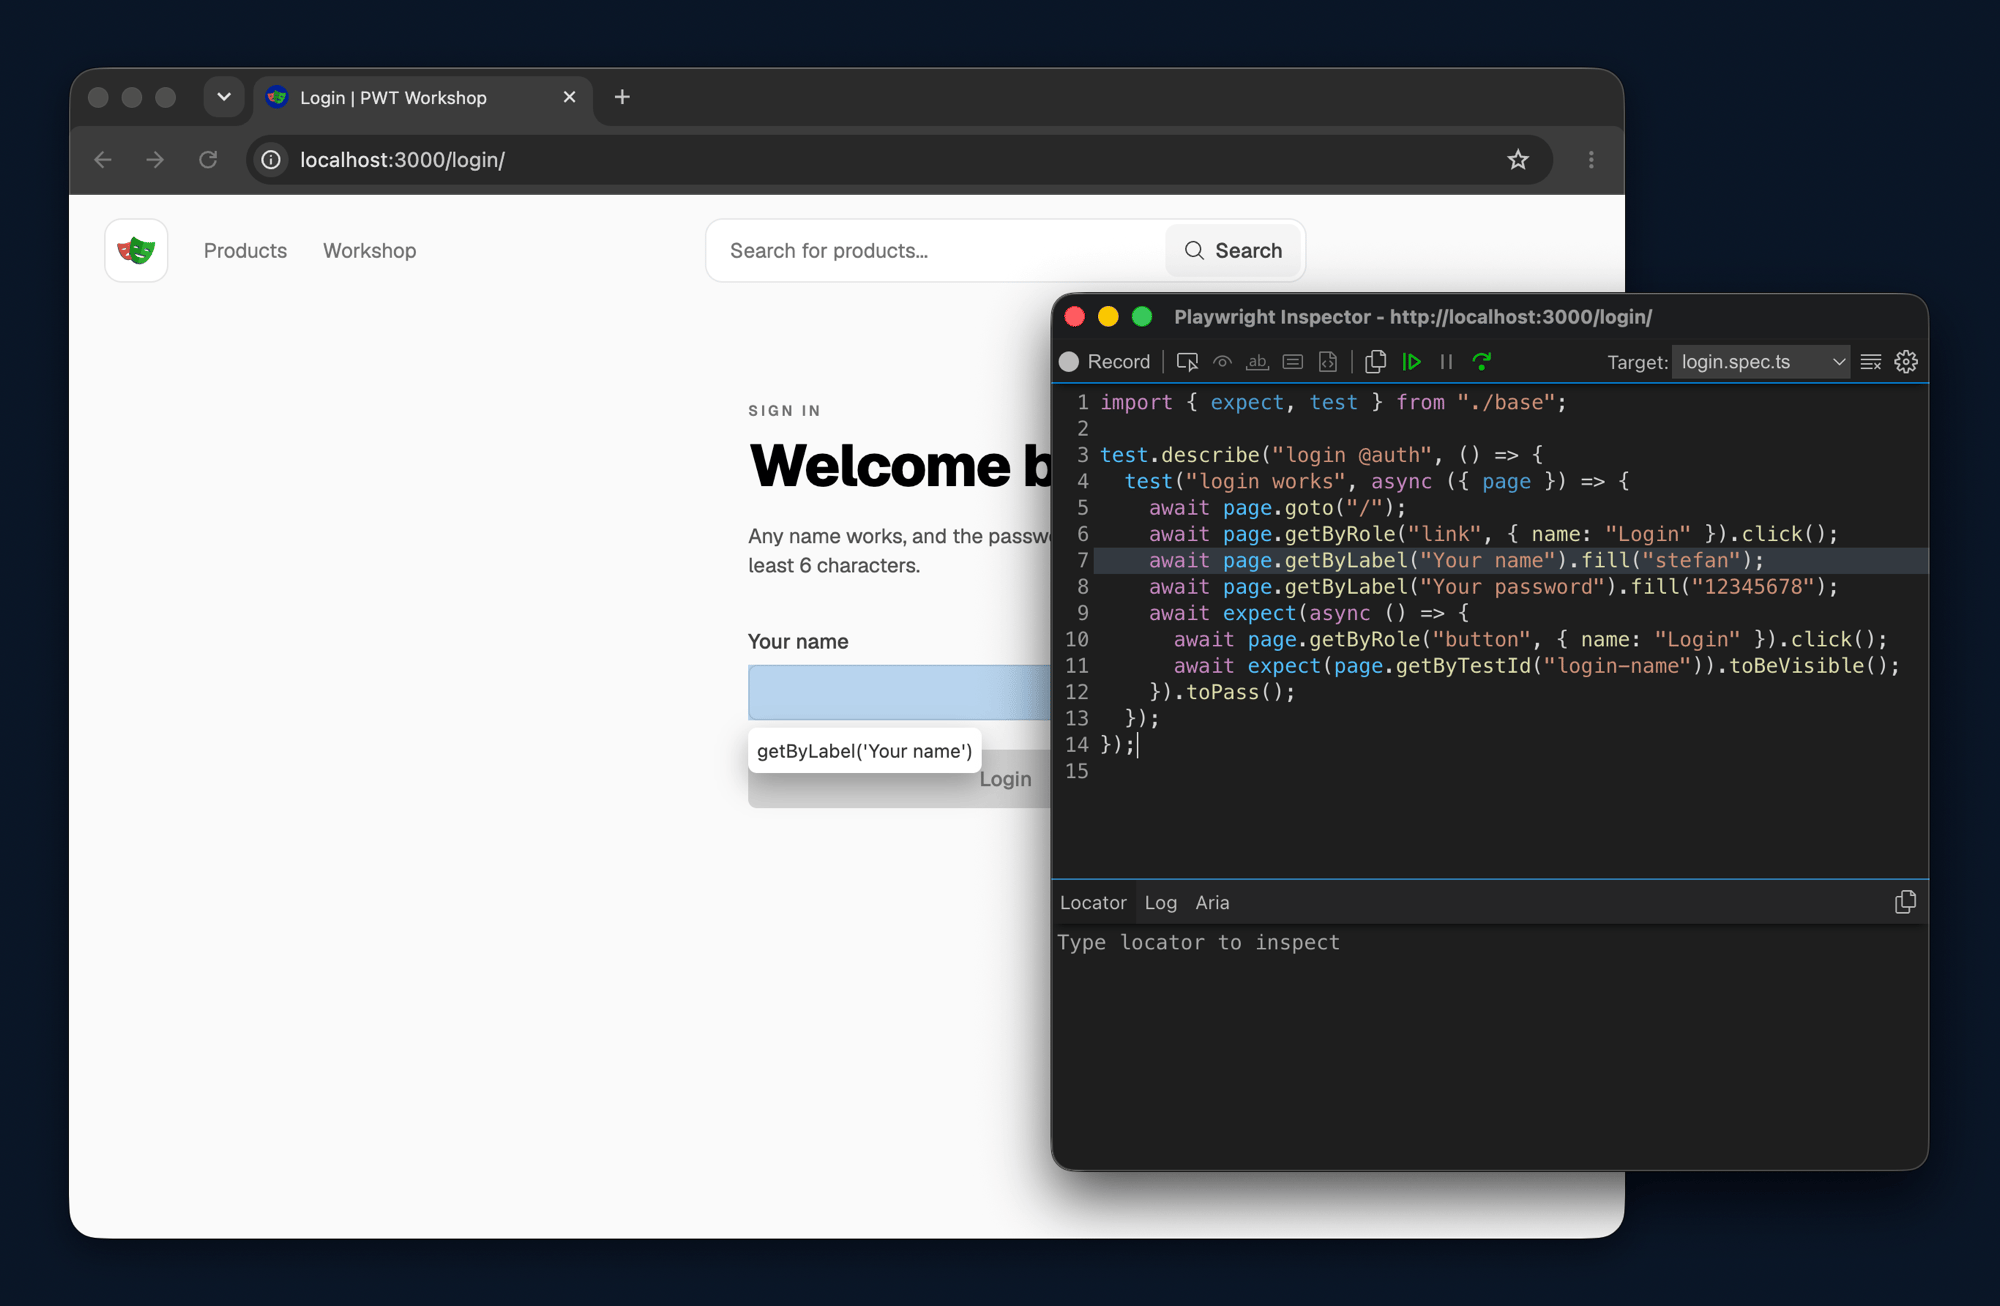
Playwright's debugging tools were built for human eyes. The trace viewer, the inspector, and UI mode are great GUI tools. But when a coding agent hits a failing test, it can't click through a trace viewer. Agents prefer text.
Over the last few releases, Playwright shipped text-first versions of its entire debugging toolchain. If an agent writes or fixes tests for you, these are the features it depends on. Three of them matter most: the error context attachment, the `trace` command, and `--debug=cli`.
## Failing tests ship their own context
Start with the feature you get for free. When a test fails, Playwright attaches an `error-context.md` file to the test results and points to it right in the terminal output.
```txt highlight={18} theme={null}
1) [Chromium] › tests/coupon.spec.ts:3:5 › coupon code applies a discount ─────────────────────────
TimeoutError: locator.fill: Timeout 3000ms exceeded.
Call log:
- waiting for getByLabel('Coupon code')
3 | test("coupon code applies a discount", async ({ page }) => {
4 | await page.goto("/checkout");
> 5 | await page.getByLabel("Coupon code").fill("SAVE20");
| ^
6 | await page.getByRole("button", { name: "Apply" }).click();
7 | await expect(page.getByText("Discount applied")).toBeVisible();
8 | });
9 |
at /path/to/project/tests/coupon.spec.ts:5:40
Error Context: test-results/coupon-code-applies-a-discount-Chromium/error-context.md
attachment #1: trace (application/zip) ─────────────────────────────────────────────────────────
test-results/coupon-code-applies-a-discount-Chromium/trace.zip
Usage:
npx playwright show-trace test-results/coupon-code-applies-a-discount-Chromium/trace.zip
```
The file contains everything needed to understand the failure without rerunning anything: the error details, the test source, and the page snapshot at failure time. The snapshot is the page's accessibility tree rendered as YAML, the same representation agents use to "see" pages everywhere in the Playwright ecosystem.
````md theme={null}
# Instructions
- Following Playwright test failed.
- Explain why, be concise, respect Playwright best practices.
- Provide a snippet of code with the fix, if possible.
# Test info
- Name: coupon.spec.ts >> coupon code applies a discount
- Location: tests/coupon.spec.ts:3:5
# Error details
```
TimeoutError: locator.fill: Timeout 3000ms exceeded.
Call log:
- waiting for getByLabel('Coupon code')
```
# Page snapshot
```yaml
- main [ref=e2]:
- heading "Checkout" [level=1] [ref=e3]
- generic [ref=e4]:
- text: Discount code
- textbox "Discount code" [ref=e5]
- button "Apply" [ref=e6]
```
# Test source
```ts
3 | test("coupon code applies a discount", async ({ page }) => {
4 | await page.goto("/checkout");
> 5 | await page.getByLabel("Coupon code").fill("SAVE20");
| ^ TimeoutError: locator.fill: Timeout 3000ms exceeded.
6 | await page.getByRole("button", { name: "Apply" }).click();
7 | await expect(page.getByText("Discount applied")).toBeVisible();
8 | });
```
````
Look at this example: the test waits for a `Coupon code` field, but the snapshot shows the page renders a `Discount code` textbox. The root cause is sitting right there in plain text. An agent (or you) can spot the mismatch without opening a browser.
The file even starts with LLM instructions ("Following Playwright test failed. Explain why, be concise..."), so it doubles as a ready-made prompt. That's also what powers the "Copy prompt" button you'll find next to errors in the HTML report, the trace viewer and UI mode. One click, paste it into your AI chat of choice, and you're debugging.
If your agent has access to your project, it will usually read `error-context.md` on its own after a failed test run. This file is a big part of why a plain "please fix this failing test" prompt works as well as it does these days.
## `npx playwright trace`: the trace viewer for terminals
Playwright traces are the most complete record of an end-to-end test failure. The trace viewer makes them easy to inspect, but it's useless to an agent because it's a GUI.
Prefer video? Watch the [`trace` command in action](https://www.youtube.com/shorts/gKNwkkEgcNk) in under a minute.
Since [Playwright 1.59](https://playwright.dev/docs/release-notes#-cli-trace-analysis-for-agents) there's `npx playwright trace`, a command that makes recorded traces accessible from the terminal. Point it at a trace file first:
```bash theme={null}
npx playwright trace open test-results/coupon-code-applies-a-discount-Chromium/trace.zip
```
Then dig in. `trace actions` lists every step of the test with timing and its failure state.
```text theme={null}
# Time Action Duration
---- -------- -------------------------- --------
8. 0:01.380 Navigate to "/checkout" 17ms
9. 0:01.398 Fill "SAVE20" 3.0s ✗
getByLabel('Coupon code')
10. 0:04.404 After Hooks 29ms
```
Every action has an index, so `trace action 9` prints the details of the failing step (parameters, error, call log), and `trace snapshot 9` renders the page snapshot exactly as it looked at that moment. `trace requests` lists the network traffic, `trace console` the console messages, and `trace errors` the collected errors with stack traces. You get the idea.
It's all plain text. You can pipe it through grep or any other shell tool, and so can your agent. When a test fails, a simple prompt like this sends your agent through the entire trace, no browser needed:
```text theme={null}
The test broke. Please investigate the trace!
```
To teach your agent the trace tooling, install the matching agent skill with `npx playwright trace install-skill`. After that, it knows all the commands above and when to reach for them.
## `--debug=cli`: a debugger your agent can drive
Sometimes a recorded trace isn't enough and you want to poke at the live page. For humans, that's what `npx playwright test --debug` is for. It opens the Playwright inspector and lets you step through your test action by action. Your agent can't click through an inspector window, though.
Prefer video? Watch [`--debug=cli` in action](https://www.youtube.com/shorts/qrFcZDsTOuA) in under a minute.
Since [Playwright 1.59](https://playwright.dev/docs/release-notes#-cli-debugger-for-agents), the `--debug` flag accepts a `cli` mode:
```bash theme={null}
npx playwright test tests/coupon.spec.ts --debug=cli
```
Instead of opening a GUI, the test run pauses and prints instructions on how to control it from another terminal session:
```text theme={null}
Running 1 test using 1 worker
### The test is currently paused at the start
### Debugging Instructions
- Run "npx playwright-cli attach tw-10b692" to attach to this test
```
Now attach with the Playwright CLI, and everything you'd normally do in the inspector works as plain terminal commands:
```bash theme={null}
npx playwright-cli attach tw-10b692
# step to the next test action
npx playwright-cli --s=tw-10b692 step-over
# print the current accessibility tree
npx playwright-cli --s=tw-10b692 snapshot
# list the network traffic
npx playwright-cli --s=tw-10b692 requests
```
Each `step-over` reports where the test is paused and what action comes next. `snapshot` shows the live page state, `requests` reveals what's happening on the network, and you can interact with the paused page using all the other CLI commands (`click`, `fill`, `eval`, and friends). **It's the same Playwright debugger, just in plain text.**
For humans, this isn't a great way to work. But hand it to an agent with the Playwright CLI skill installed:
```text theme={null}
The coupon test broke. Please run Playwright with the `--debug=cli` flag
and debug it with the playwright-cli tooling.
```
The agent spins up a debugging session the same way you would: it steps to the failing action, checks the snapshot, inspects `requests`, and discovers, say, that the coupon HTTP call came back with a 500. Watching an agent debug via text is amazingly nerdy, and it works.
Add `--headed` to the test command if you want to watch the browser while the agent drives.
This workflow only works if the Playwright CLI skill is installed and up to date. Run `npx playwright-cli install` to set it up, and re-run it after updating Playwright so your agent knows the latest commands.
## Debugging doesn't stop at your test suite
If you're not on a recent Playwright version, updating is probably the easiest upgrade your agent can get.
And this workflow extends past pre-production testing. If you run your Playwright tests as [production monitors on Checkly](/docs/detect/synthetic-monitoring/playwright-checks/overview), the same [traces](/docs/guides/reading-traces/) get recorded on every failed check run, and [Rocky AI](/docs/resolve/ai-root-cause-analysis/overview) analyzes them for you. When a check fails, the root cause analysis is usually done before you even start digging.
## Further reading
1. [Debugging scripts](/docs/learn/playwright/debugging/)
2. [Common debugging errors](/docs/learn/playwright/debugging-errors/)
3. [Control your monitoring infrastructure with AI agents](/docs/guides/agentic-workflows/)
4. [Playwright's trace viewer docs](https://playwright.dev/docs/trace-viewer)
Bugs don't stop at CI/CD. Why would Playwright?
Sign up and start using Playwright for end-to-end monitoring with Checkly.