Bugs don't stop at CI/CD. Why would Playwright? 
Sign up and start using Playwright for end-to-end monitoring with Checkly.
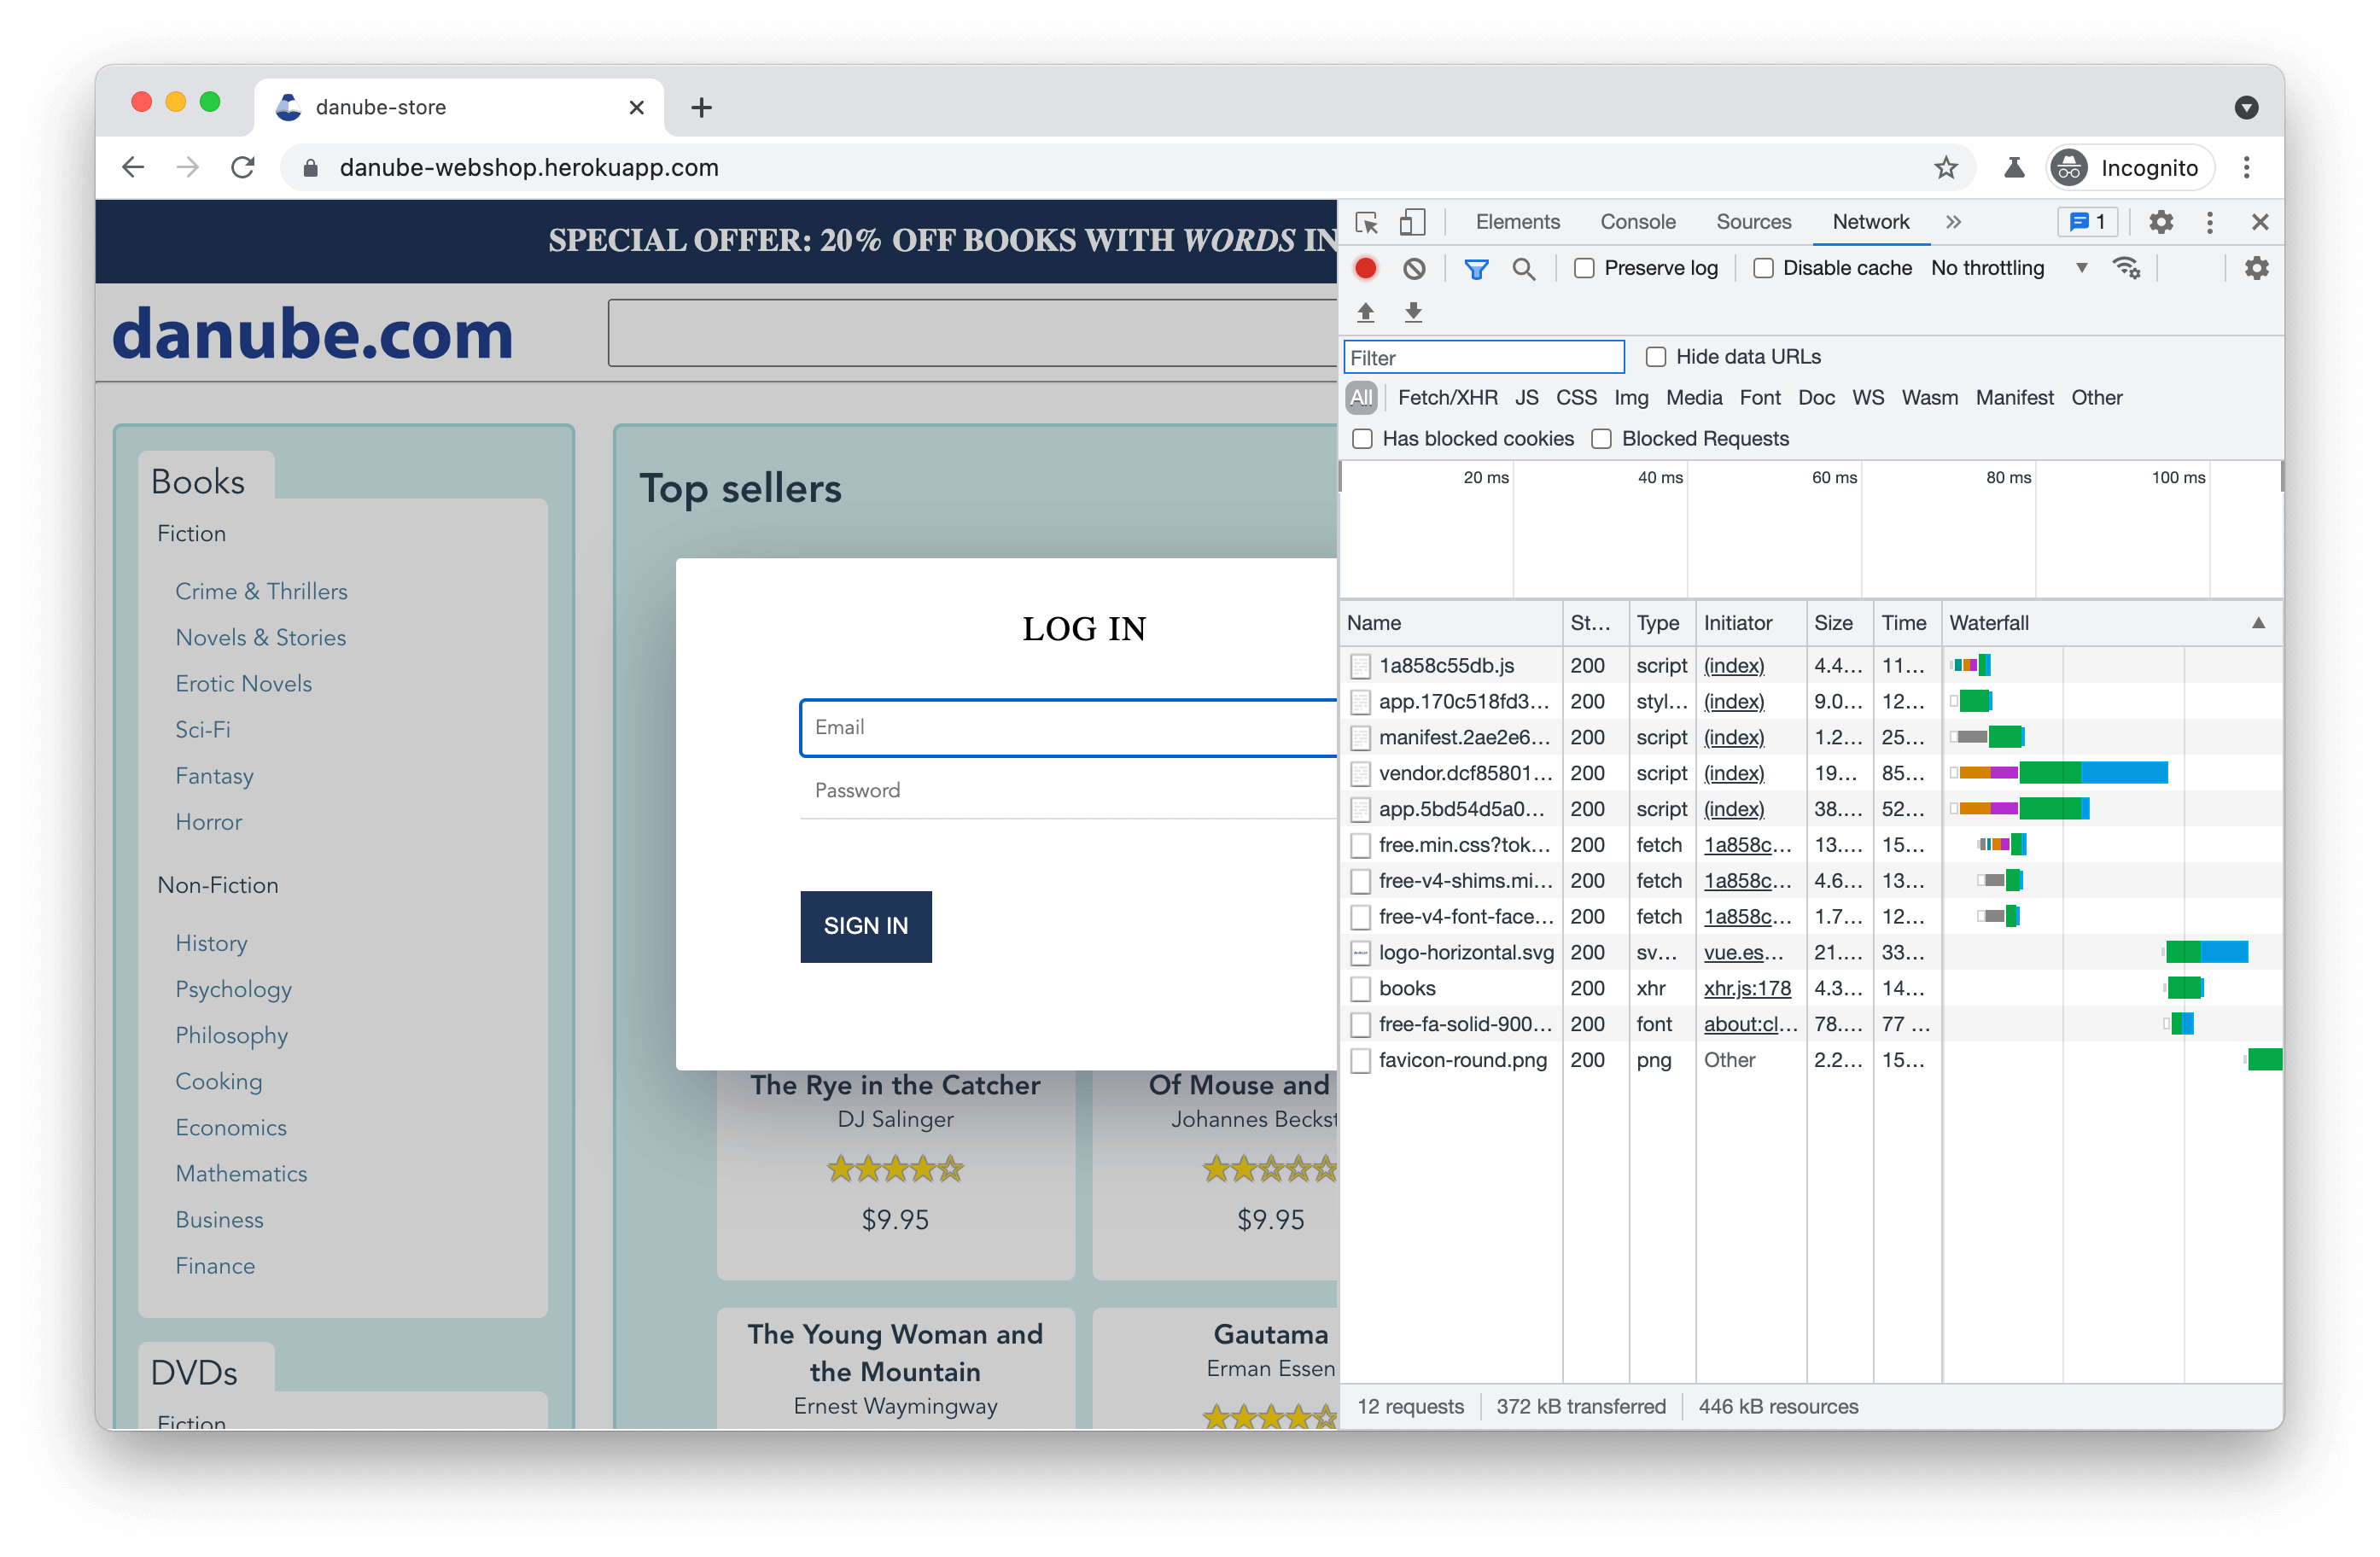
 ## Accessing DevTools
A wealth of information is available through the Chrome Developer Tools. We can configure our browser to start with the DevTools tab already open (this will automatically disable headless mode), which can be helpful when something is not working as expected. Careful inspection of the Console, Network and other tabs can reveal hidden errors and other important findings.
## Accessing DevTools
A wealth of information is available through the Chrome Developer Tools. We can configure our browser to start with the DevTools tab already open (this will automatically disable headless mode), which can be helpful when something is not working as expected. Careful inspection of the Console, Network and other tabs can reveal hidden errors and other important findings.
 ```js theme={null}
...
await chromium.launch({ devtools: true })
...
```
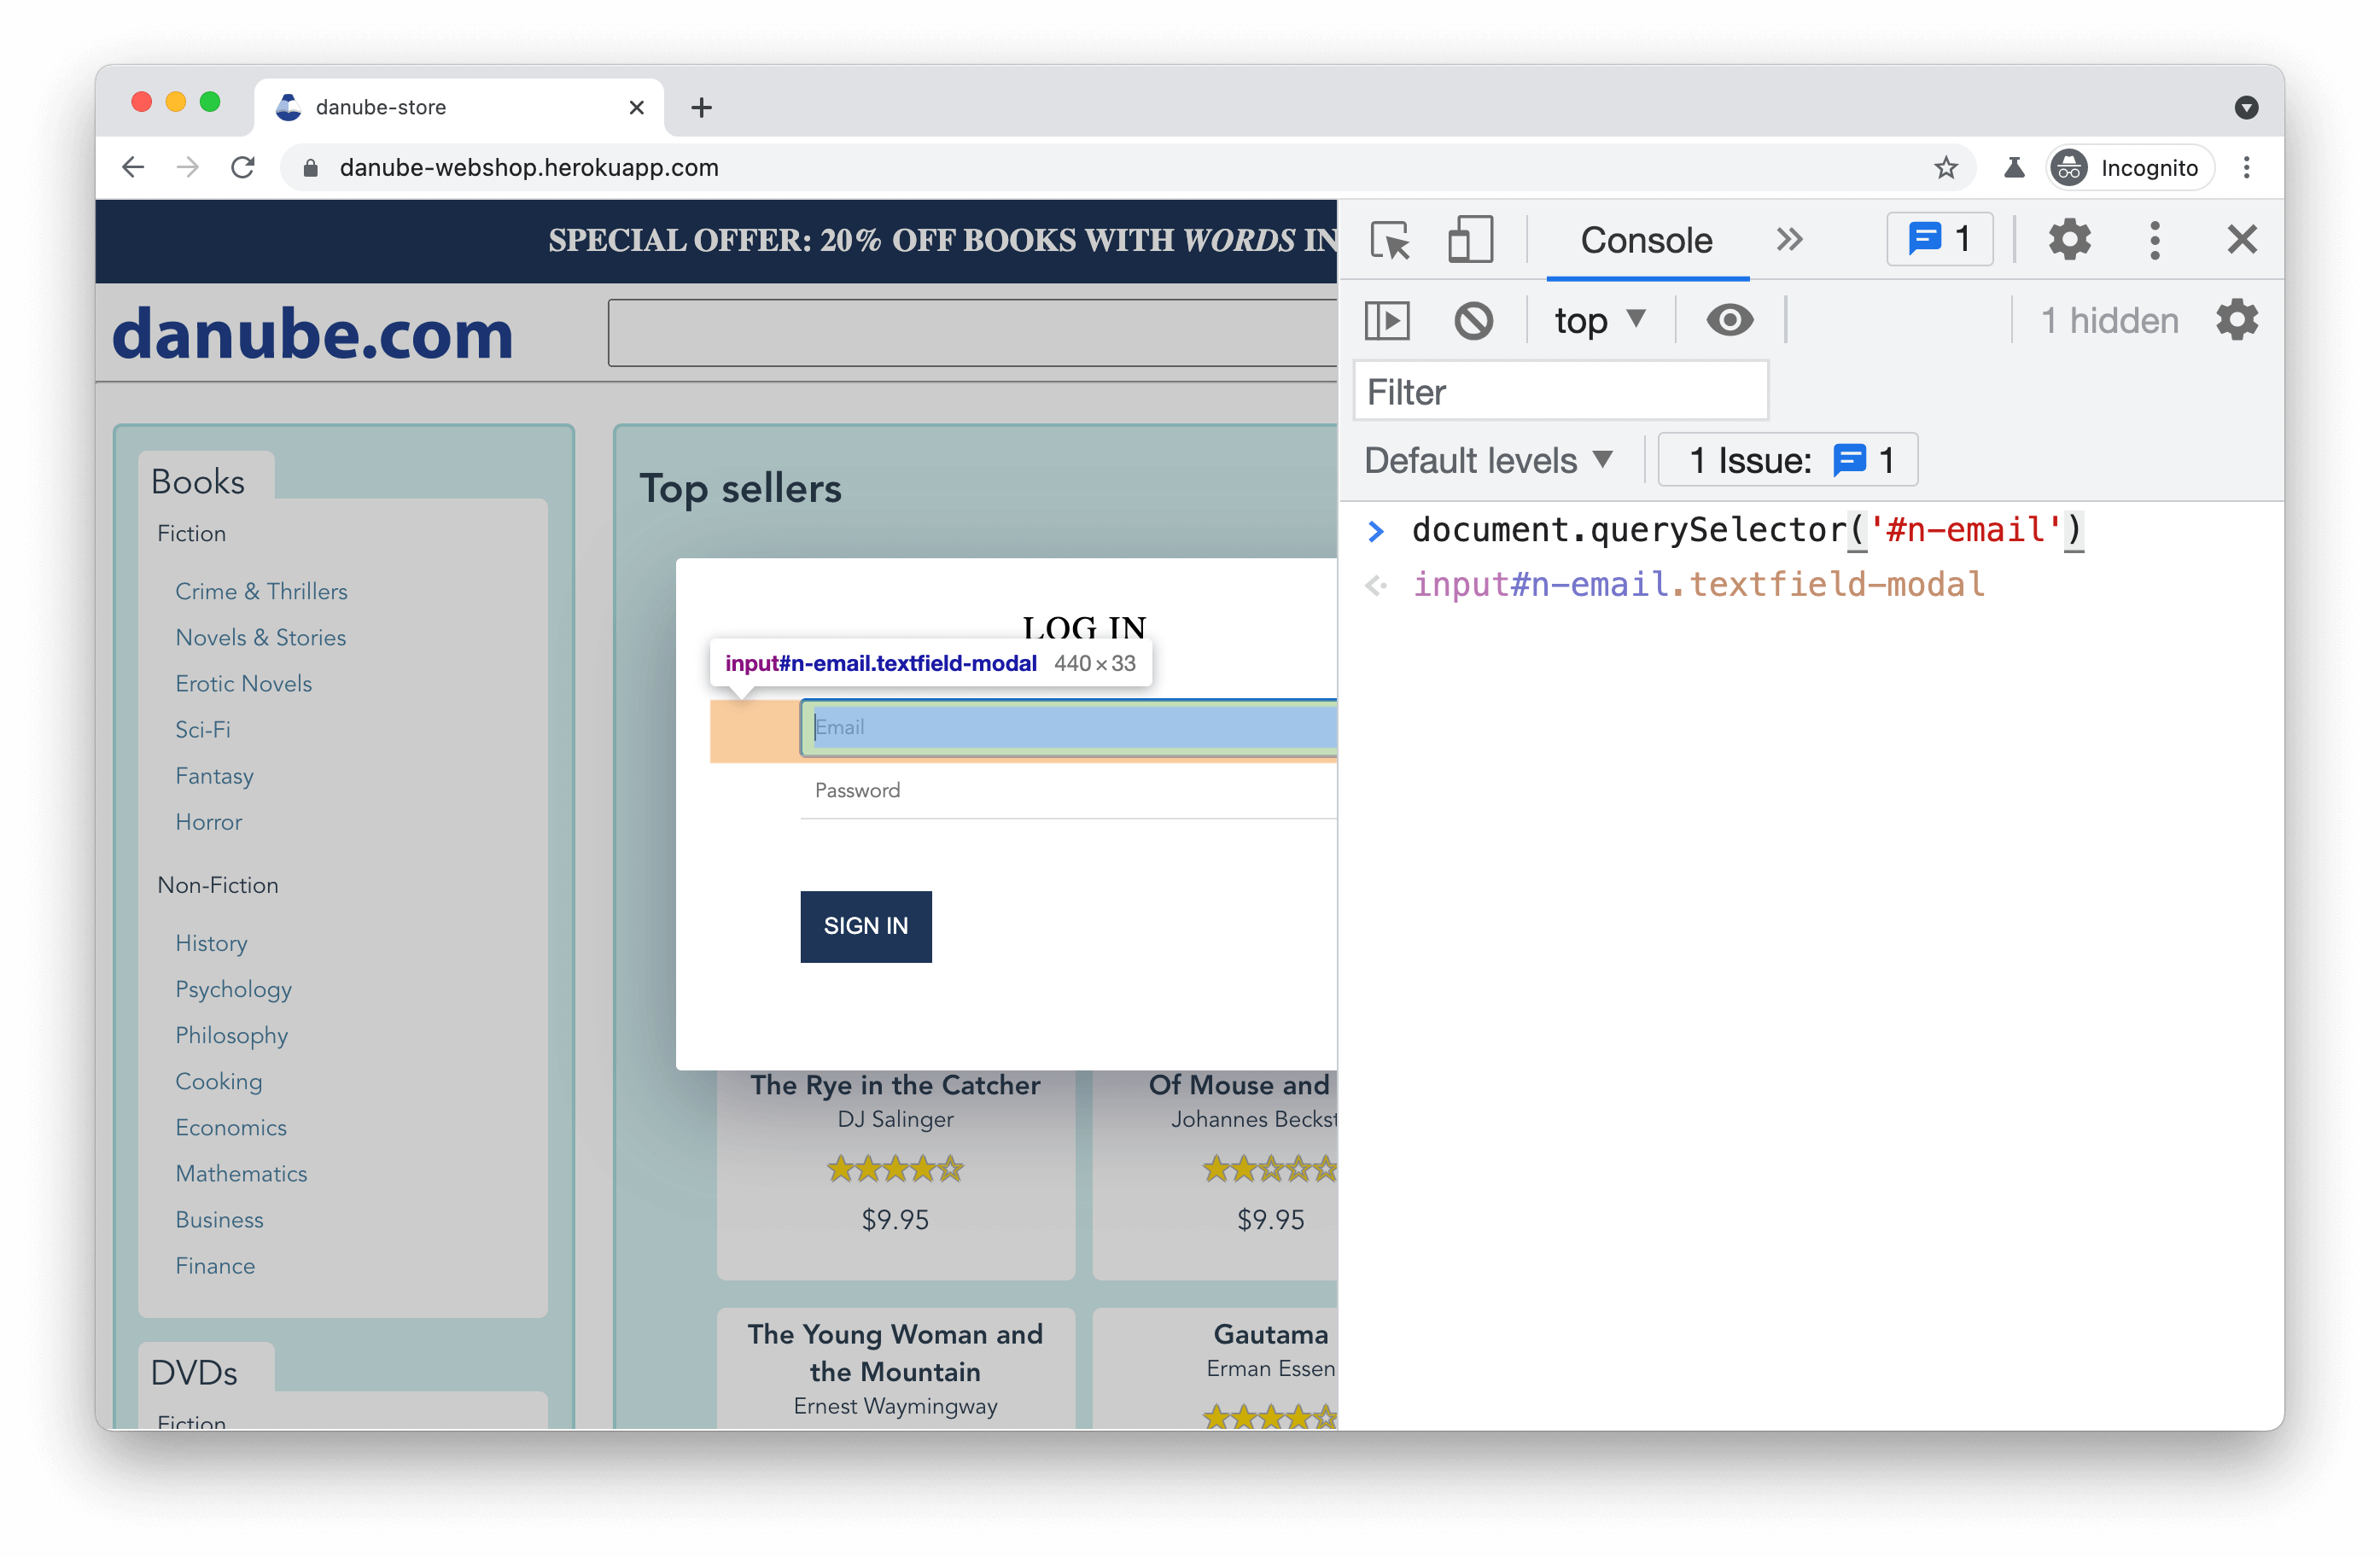
We can also use the console to directly try out a selector on the page in its current state, e.g. with `document.querySelector` or `document.querySelectorAll`.
```js theme={null}
...
await chromium.launch({ devtools: true })
...
```
We can also use the console to directly try out a selector on the page in its current state, e.g. with `document.querySelector` or `document.querySelectorAll`.
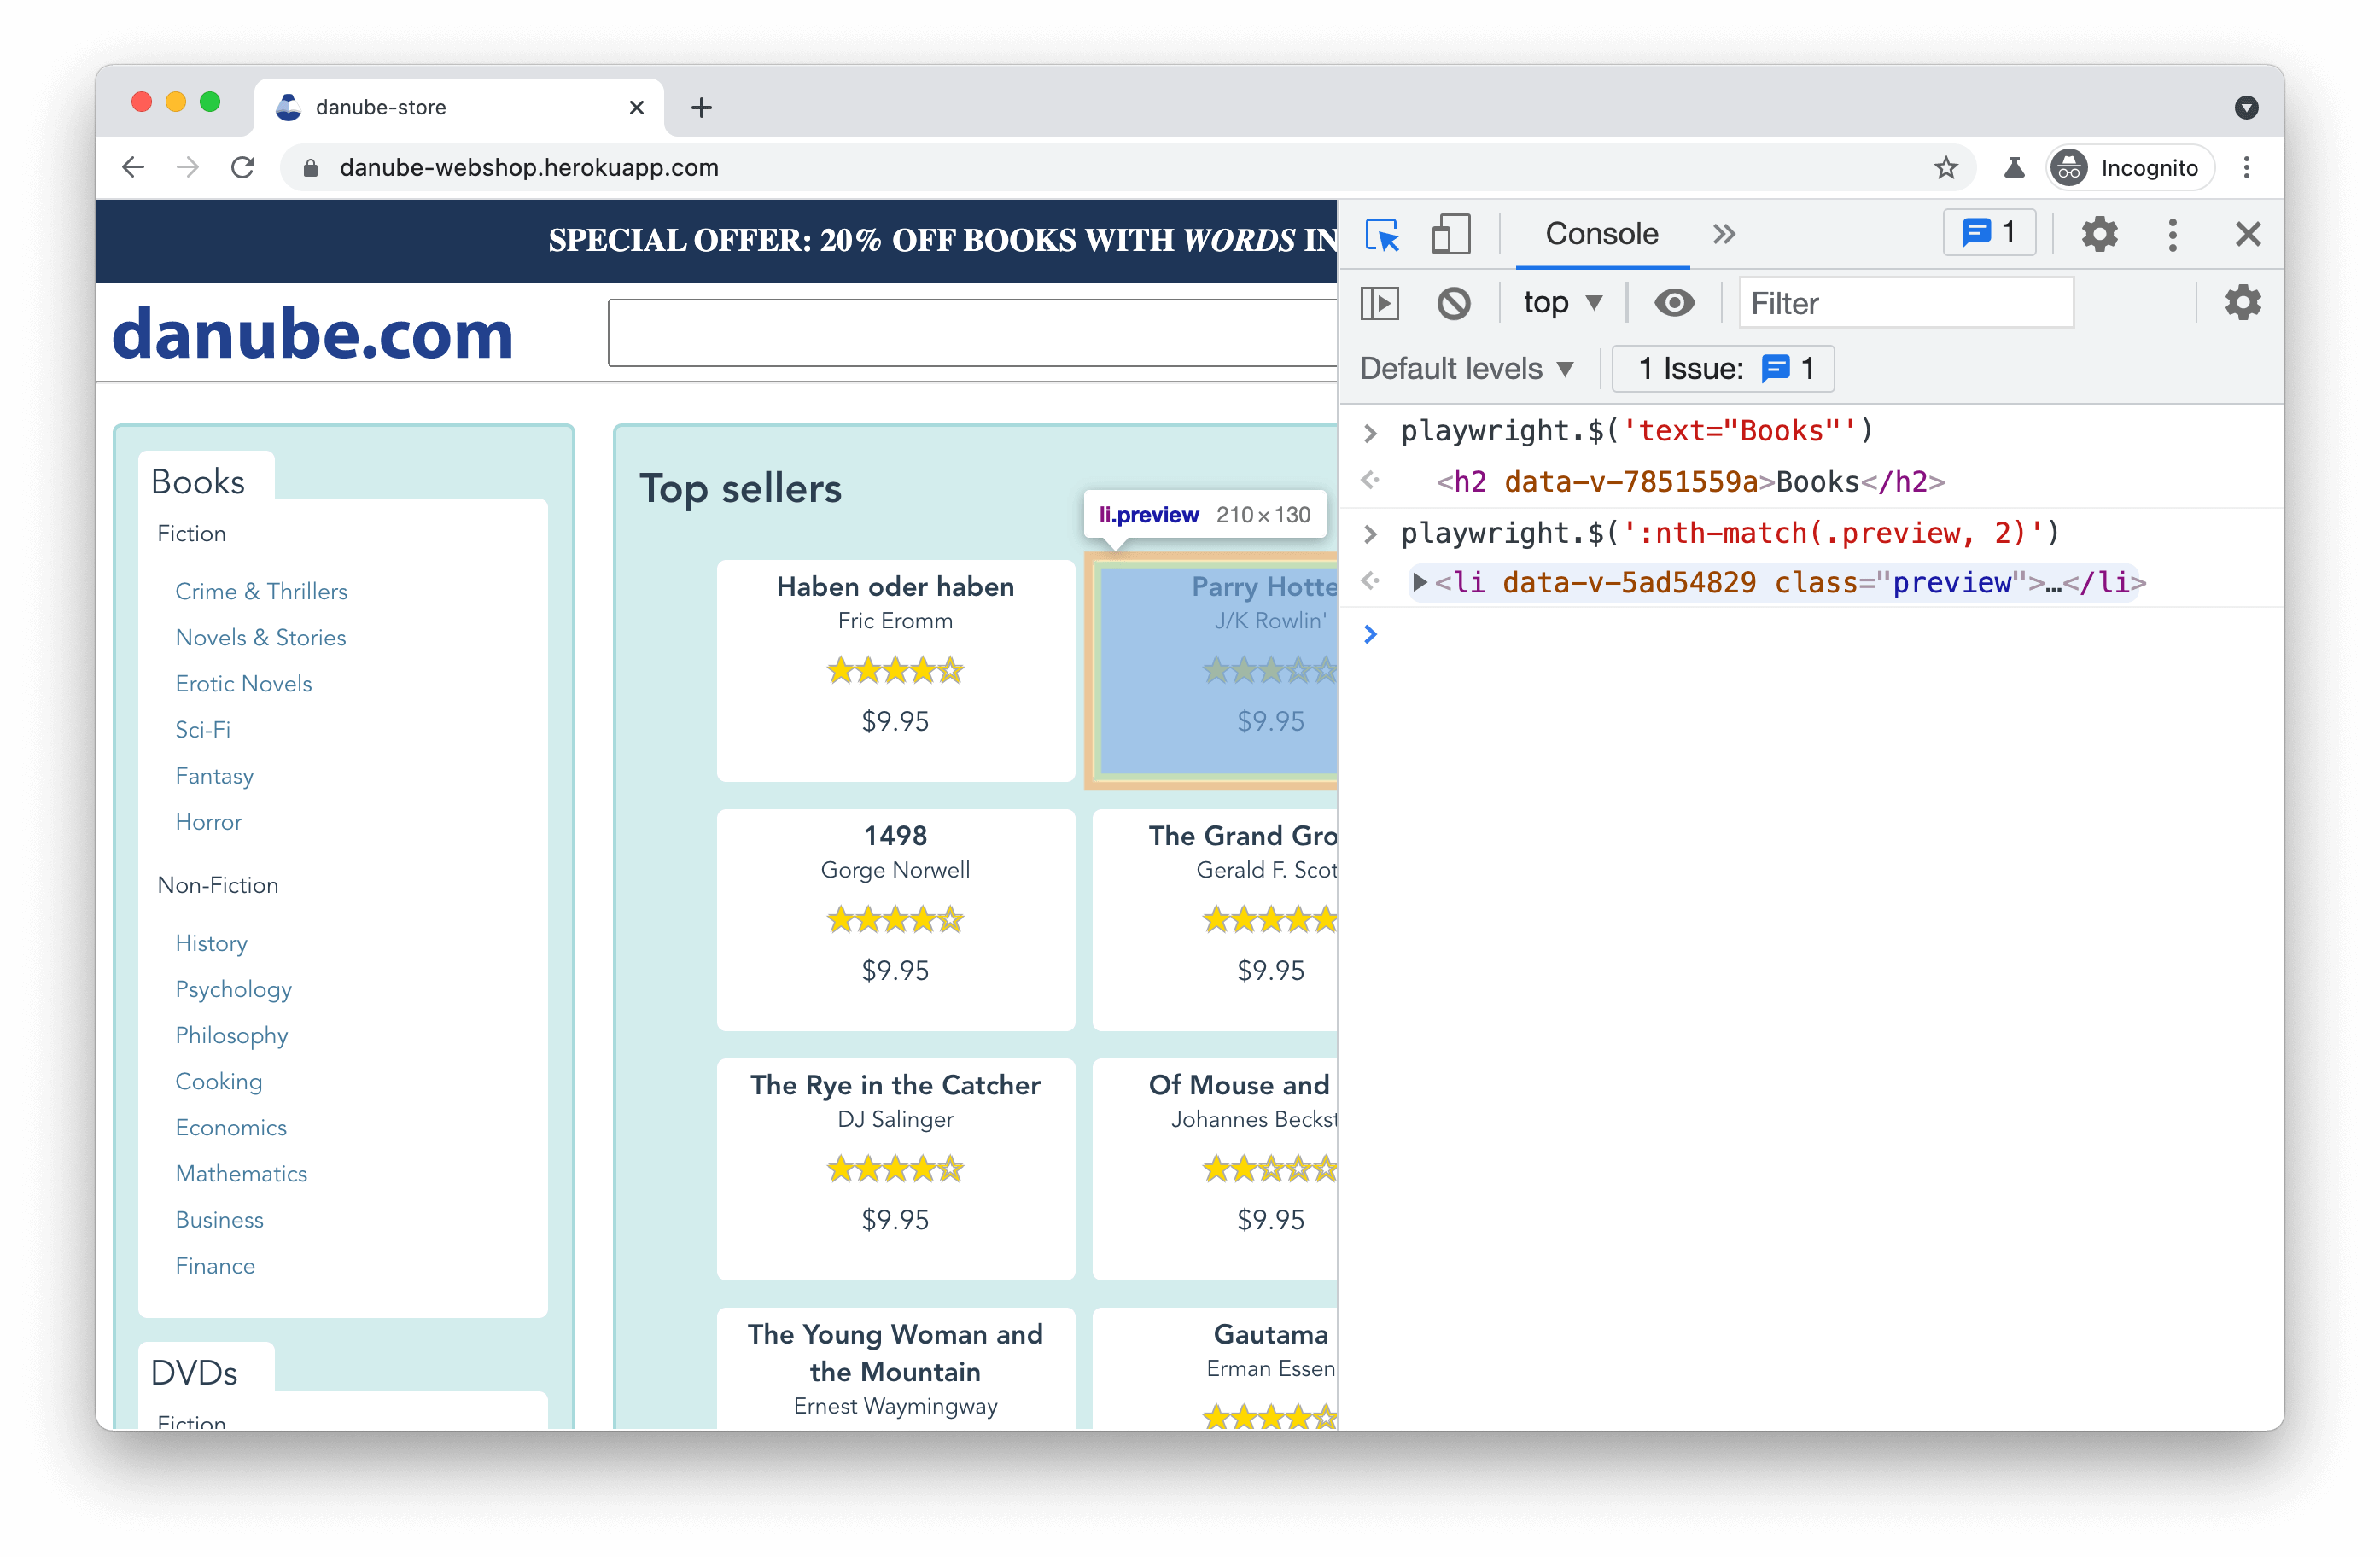
 If we are using Playwright, we can also run in debug mode with `PWDEBUG=console node script.js`. This provisions a `playwright` object in the browser which allows us to also try out [Playwright-specific selectors](https://playwright.dev/docs/selectors).
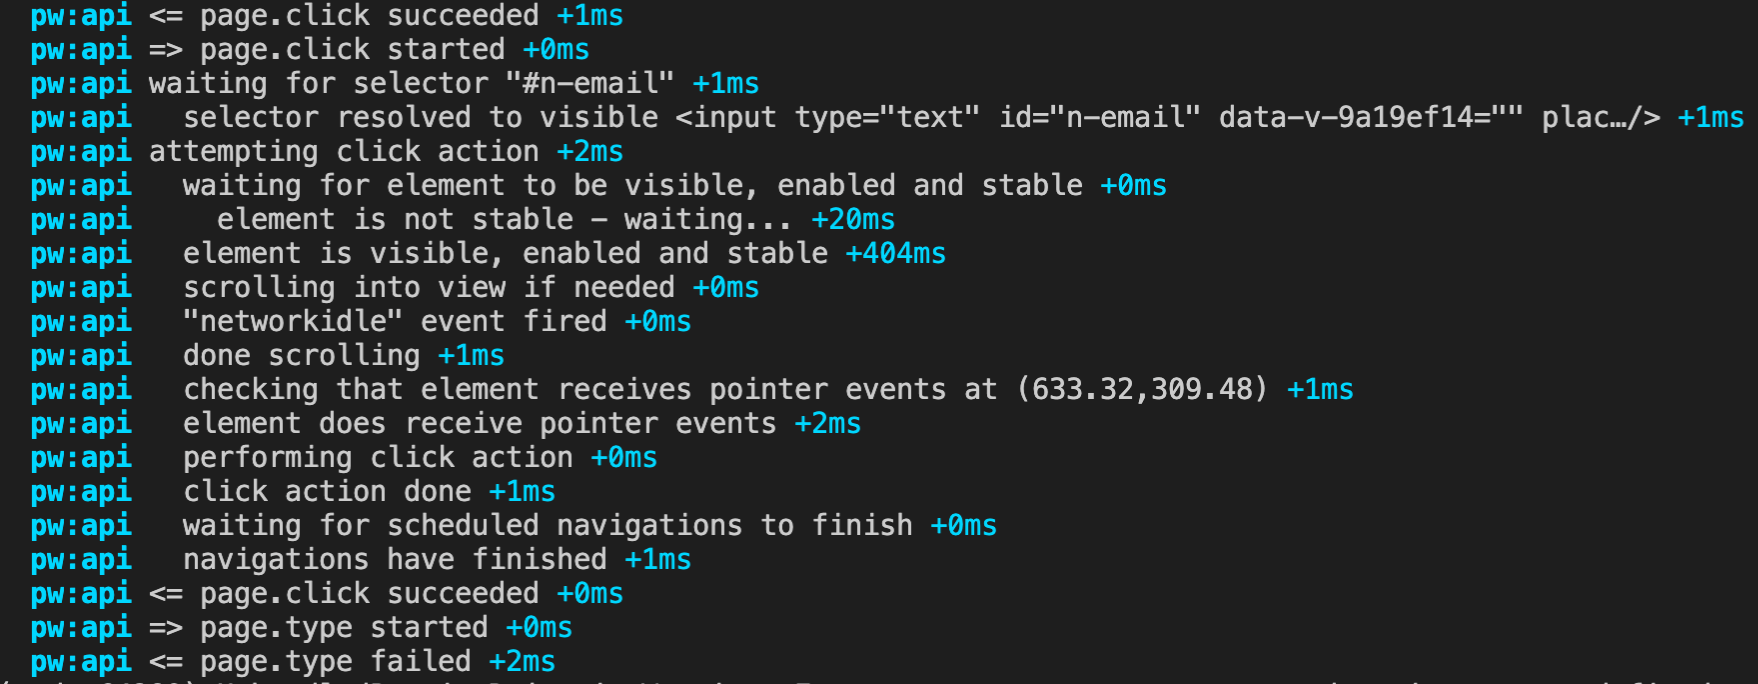
 ## The Playwright Inspector
The Playwright Inspector is a GUI tool which exposes additional debugging functionality, and can be launched using `PWDEBUG=1 npm run test`.
The Inspector allows us to easily step through each instruction of our script, while giving us clear information on the duration, outcome, and functioning of each. This can be helpful in [getting to the root cause](/learn/playwright/debugging-errors/) of some of the more generic errors.
## The Playwright Inspector
The Playwright Inspector is a GUI tool which exposes additional debugging functionality, and can be launched using `PWDEBUG=1 npm run test`.
The Inspector allows us to easily step through each instruction of our script, while giving us clear information on the duration, outcome, and functioning of each. This can be helpful in [getting to the root cause](/learn/playwright/debugging-errors/) of some of the more generic errors.
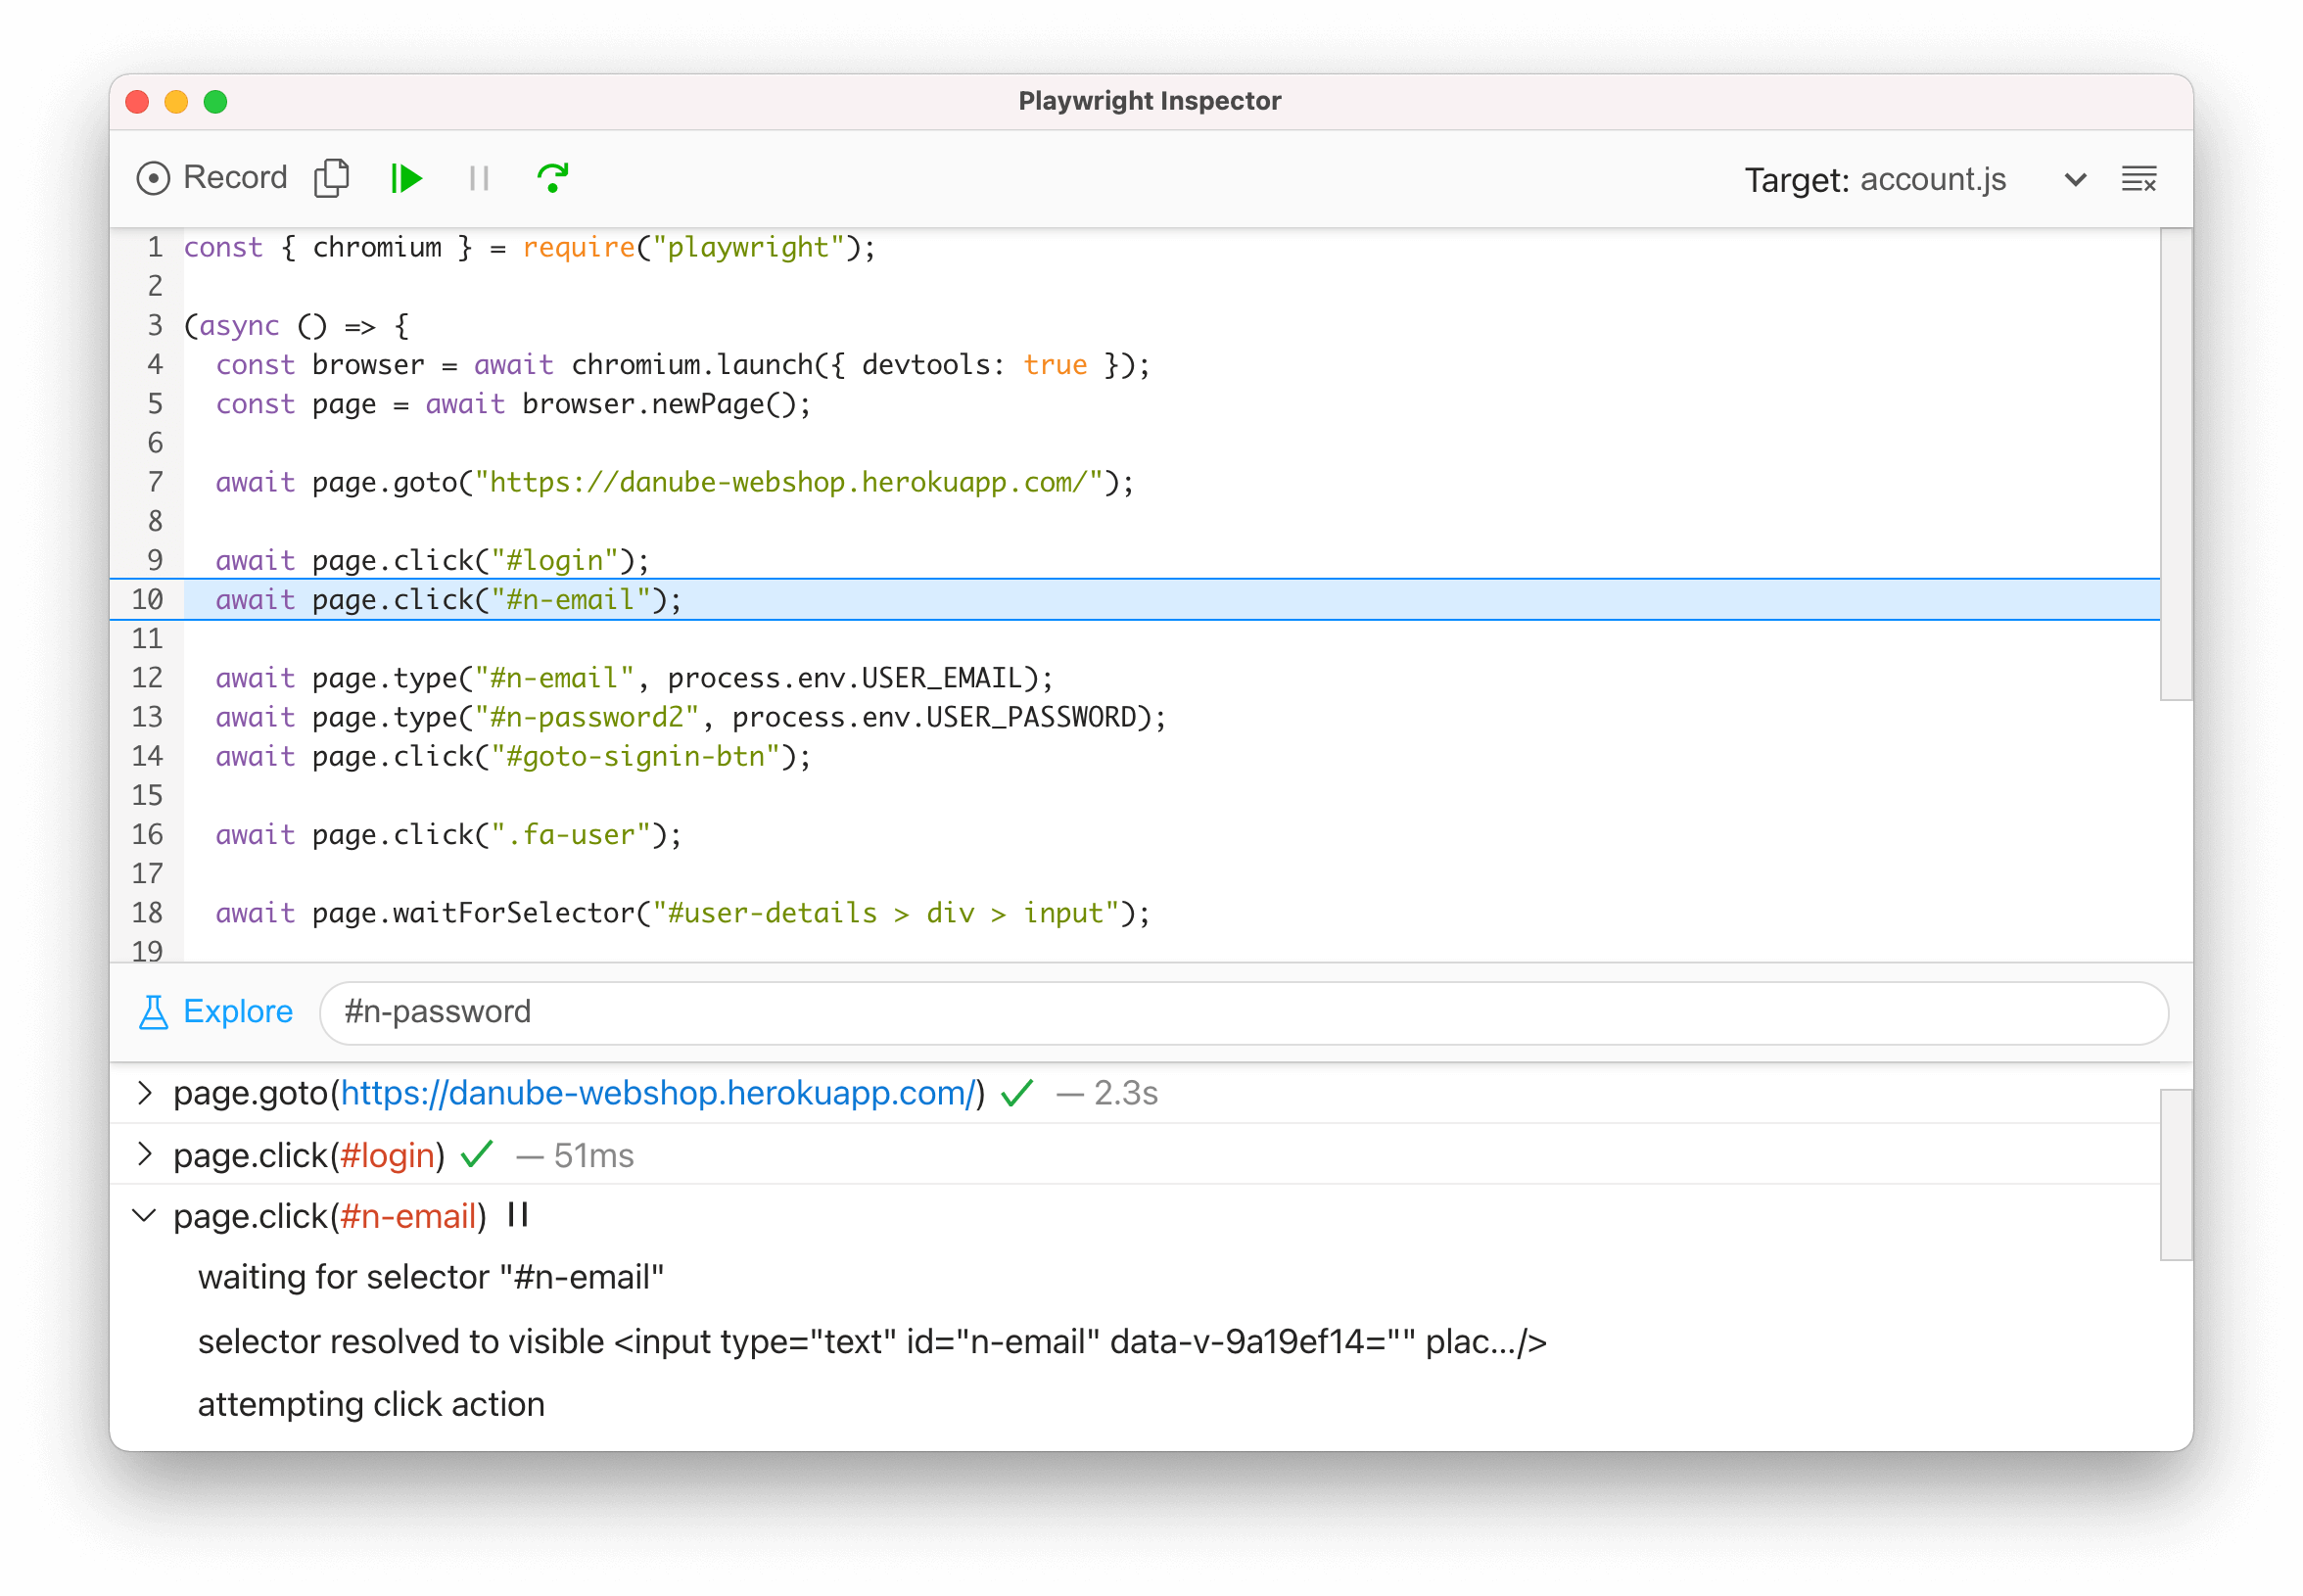 > The Inspector includes additional handy features such as selector generation and debugging, as well as script recording.
## Further reading
1. [Debugging challenges](/learn/playwright/debugging-errors/)
2. [Working with selectors](/learn/playwright/selectors/)
> The Inspector includes additional handy features such as selector generation and debugging, as well as script recording.
## Further reading
1. [Debugging challenges](/learn/playwright/debugging-errors/)
2. [Working with selectors](/learn/playwright/selectors/)