> ## Documentation Index
> Fetch the complete documentation index at: https://www.checklyhq.com/docs/llms.txt
> Use this file to discover all available pages before exploring further.
# Analytics API
With the Analytics API, you can query all check metrics and report on Checkly data in your preferred reporting tool!
The Analytics APIs allows queries across different dimensions:
* **Aggregated**: get the p99, sum, standard deviation or whatever you like from DNS times for API checks, or First Contentful Paint (FCP) score for Browser checks.
* **Non-aggregated**: Get the raw data points so you can aggregate yourself how you want it.
Use powerful options like `quickRange` to select time window presets like `last30Days` or `lastMonth`, and group results
per `location` or per `pageIndex`. For aggregated queries you can set the `aggregationInterval` to get, for instance, data
aggregated per week over the last 30 days.
Dive straight into the [API reference](/api-reference/analytics/api-checks) or keep reading for more examples!
## Analytics API basics
There are several endpoints, with one for each check or monitor type.
| Endpoint | Description | API Reference |
| ---------------------------------------- | ---------------------------------------------------------------------------------------------- | --------------------------------------------------------------------------- |
| `/v1/analytics/metrics/` | Returns all the available metrics for a specific check-type (`API`, `URL`, `TCP` or `BROWSER`) | [Learn more](/api-reference/analytics/list-all-available-reporting-metrics) |
| `/v1/analytics/api-checks/{checkId}` | Returns metrics for API checks | [Learn more](/api-reference/analytics/api-checks) |
| `/v1/analytics/browser-checks/{checkId}` | Returns metrics for Browser checks | [Learn more](/api-reference/analytics/browser-checks) |
| `/v1/analytics/multistep-checks/{id}` | Returns metrics for Multistep checks | [Learn more](/api-reference/analytics/multistep-checks) |
| `/v1/analytics/playwright-checks/{id}` | Returns metrics for Playwright check suites | [Learn more](/api-reference/analytics/playwright-checks) |
| `/v1/analytics/dns/{id}` | Returns metrics for DNS monitors | [Learn more](/api-reference/analytics/dns-monitors) |
| `/v1/analytics/heartbeat-checks/{id}` | Returns metrics for Heartbeat monitors | [Learn more](/api-reference/analytics/heartbeat-checks) |
| `/v1/analytics/tcp-checks/{checkId}` | Returns metrics for TCP monitors | [Learn more](/api-reference/analytics/tcp-checks) |
| `/v1/analytics/url-monitors/{checkId}` | Returns metrics for URL monitors | [Learn more](/api-reference/analytics/url-monitors) |
The specific endpoints per check type return a JSON response that includes a check's attributes, period requested,
grouped `series` and a `metadata` section where you'll have additional information about the metrics to create rich reports.
The example below is from a Browser check that visits three pages in a typical e-commerce flow
* `/login`
* `/cart`
* `/cart/add`
We can query the for this Browser check using a `curl` command like:
```bash theme={null}
curl -x GET https://api.checklyhq.com/v1/analytics/browser-checks/79ad4fe0-589a-4924-a027-d18b12eee9cb?metrics=TTFB_avg,TTFB_p99&groupBy=pageIndex&quickRange=last7Days
```
This command add the following query params:
* `metrics=TTFB_avg,TTFB_p99`: return average and p99 aggregate of the TTFB (Time to First Byte)
* `groupBy=pageIndex`: group by page index, i.e. the pages visited int the Browser check.
* `quickRange=last7Days`: aggregate over the last 7 days.
The response looks as follows 👇
```JSON theme={null}
{
"checkId": "79ad4fe0-589a-4924-a027-d18b12eee9cb",
"name": "Shopping Cart - Add product",
"checkType": "BROWSER",
"activated": true,
"muted": false,
"frequency": 5,
"from": "2023-01-20T12:45:57.494Z",
"to": "2023-01-27T12:45:57.494Z",
"tags": [
"sports"
],
"series": [
{
"pageIndex": 0,
"data": [
{
"pageUrl": "https://mycart.acme.com/login",
"pageIndex": 0,
"responseTime_avg": 7216.8896,
"TTFB_avg": 746.9548609294588,
"TTFB_p99": 1059.7
}
]
},
{
"pageIndex": 1,
"data": [
{
"pageUrl": "https://mycart.acme.com/cart",
"pageIndex": 1,
"responseTime_avg": 7216.8896,
"TTFB_avg": 239.41101193049596,
"TTFB_p99": 310.8
}
]
},
{
"pageIndex": 2,
"data": [
{
"pageUrl": "https://mycart.acme.com/cart/add",
"pageIndex": 2,
"responseTime_avg": 7216.8896,
"TTFB_avg": 1.3732638888888888,
"TTFB_p99": 0
}
]
}
],
"metadata": {
"responseTime_avg": {
"unit": "milliseconds",
"label": "Response time for the full script",
"aggregation": "avg"
},
"TTFB_avg": {
"unit": "milliseconds",
"label": "Time To First Byte",
"aggregation": "avg"
},
"TTFB_p99": {
"unit": "milliseconds",
"label": "Time To First Byte",
"aggregation": "p99"
}
},
"pagination": {
"page": 1,
"limit": 10
}
}
```
## Using the API with Postman
Here you will see an example of a request using [Postman](https://www.postman.com/) where the `/v1/analytics/browser-check` endpoint returns aggregated
data (`TTFB_p50` and `TTFB_p90`) for the last 7 days grouping by page.
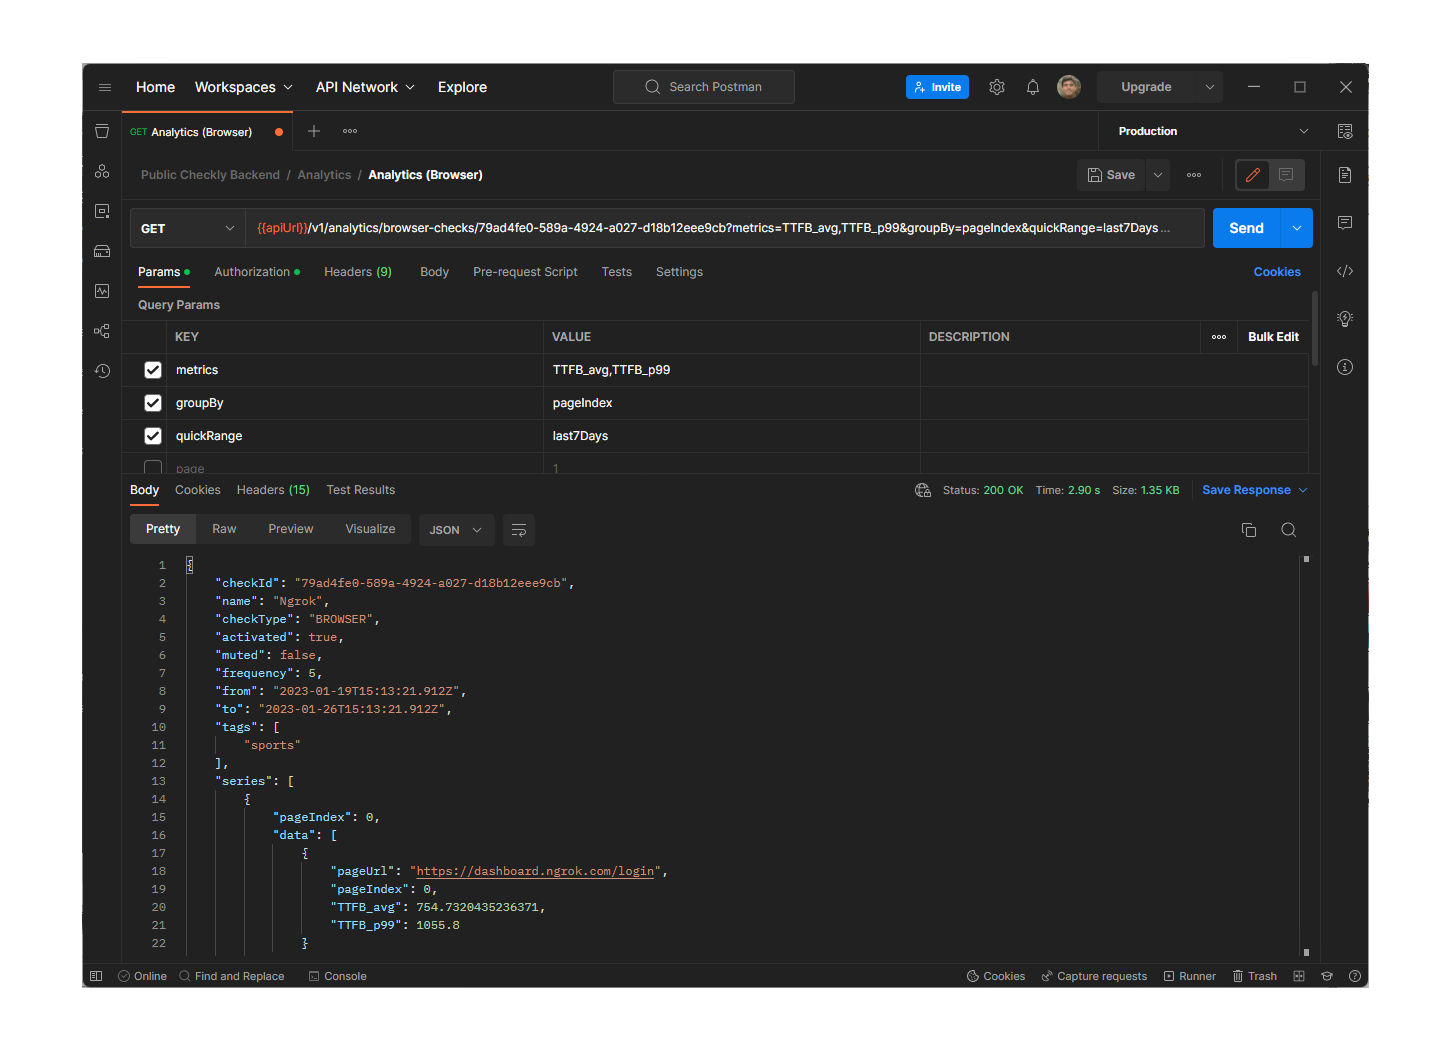 > You **must** add the `X-Checkly-Account` and `Authorization` headers to authenticate.
## Creating a Grafana Dashboard
Following these instructions you'll learn how to use the Analytics API within a [Grafana](https://grafana.com/) dashboard:
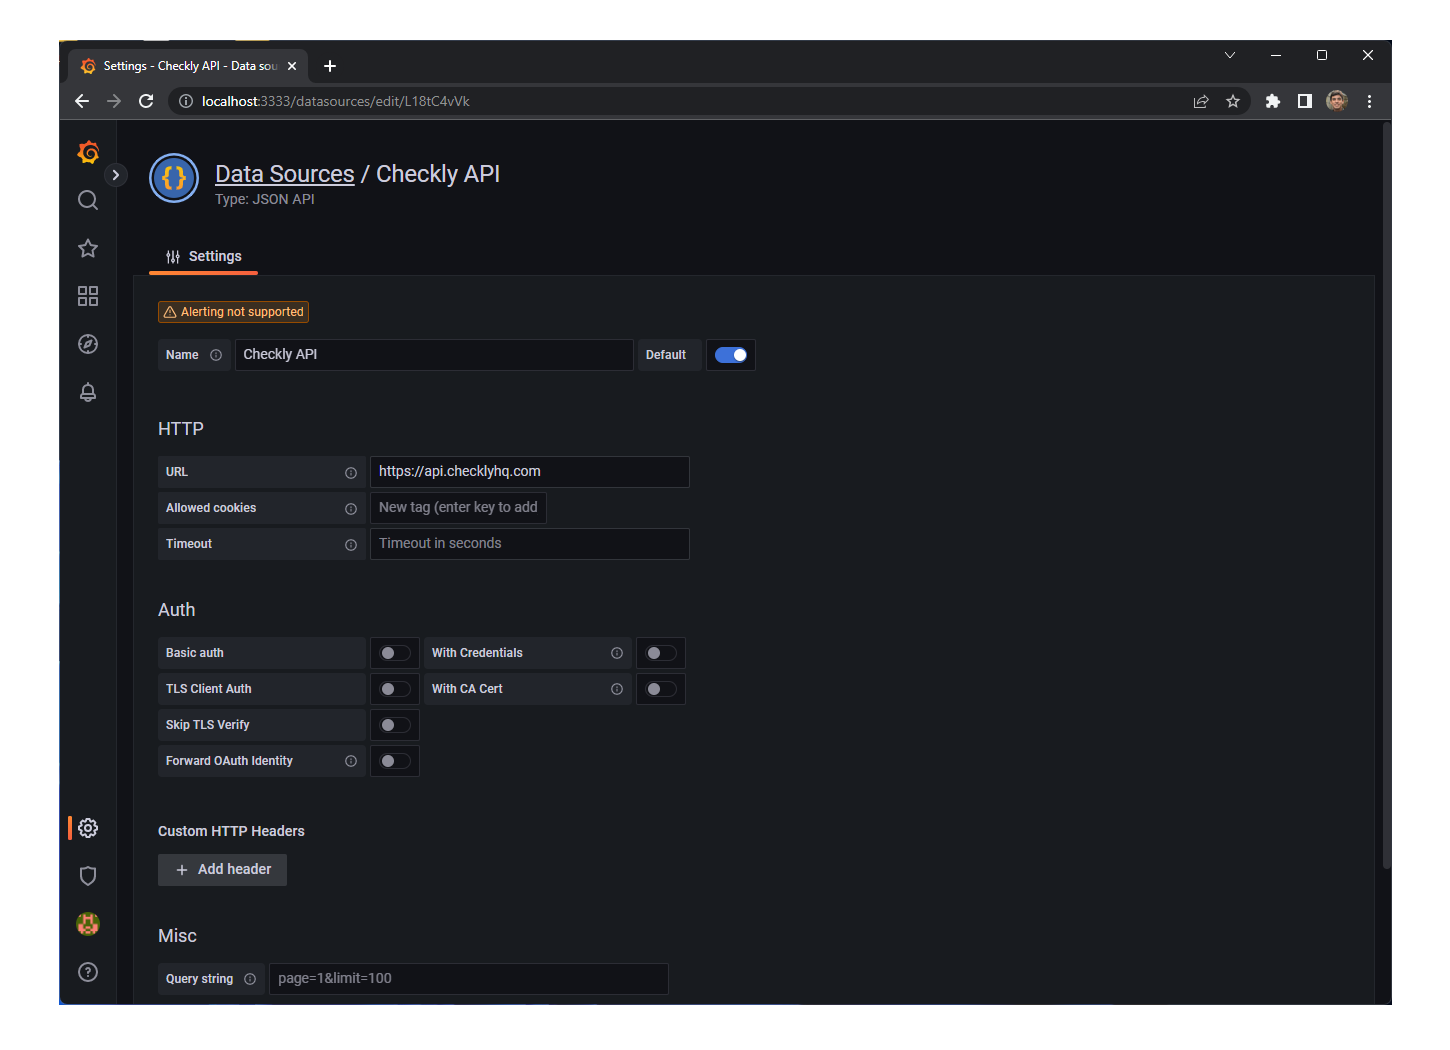
1. Creating the Data Source
First, you need to create the Data Source with the Analytics API connection. After installing the [JSON API](https://grafana.com/grafana/plugins/marcusolsson-json-datasource/) plugin you'll be able to consume any REST API and handle JSON responses.
> You **must** add the `X-Checkly-Account` and `Authorization` headers to authenticate.
## Creating a Grafana Dashboard
Following these instructions you'll learn how to use the Analytics API within a [Grafana](https://grafana.com/) dashboard:
1. Creating the Data Source
First, you need to create the Data Source with the Analytics API connection. After installing the [JSON API](https://grafana.com/grafana/plugins/marcusolsson-json-datasource/) plugin you'll be able to consume any REST API and handle JSON responses.
 2. Configuring a component
Next, you can pick a **time series** component and configure it by selecting the `Checkly Analytics API` data source and
setting the required HTTP header and query parameters to fetch the JSON. You'll find detailed docs on available parameters in the [API docs](/api-reference/analytics/api-checks)
In the following image you'll see all required configuration for a component:
* `Fields`
* `Path`
* `Query parameters`
* `Header`
* `Variables` (optional)
2. Configuring a component
Next, you can pick a **time series** component and configure it by selecting the `Checkly Analytics API` data source and
setting the required HTTP header and query parameters to fetch the JSON. You'll find detailed docs on available parameters in the [API docs](/api-reference/analytics/api-checks)
In the following image you'll see all required configuration for a component:
* `Fields`
* `Path`
* `Query parameters`
* `Header`
* `Variables` (optional)
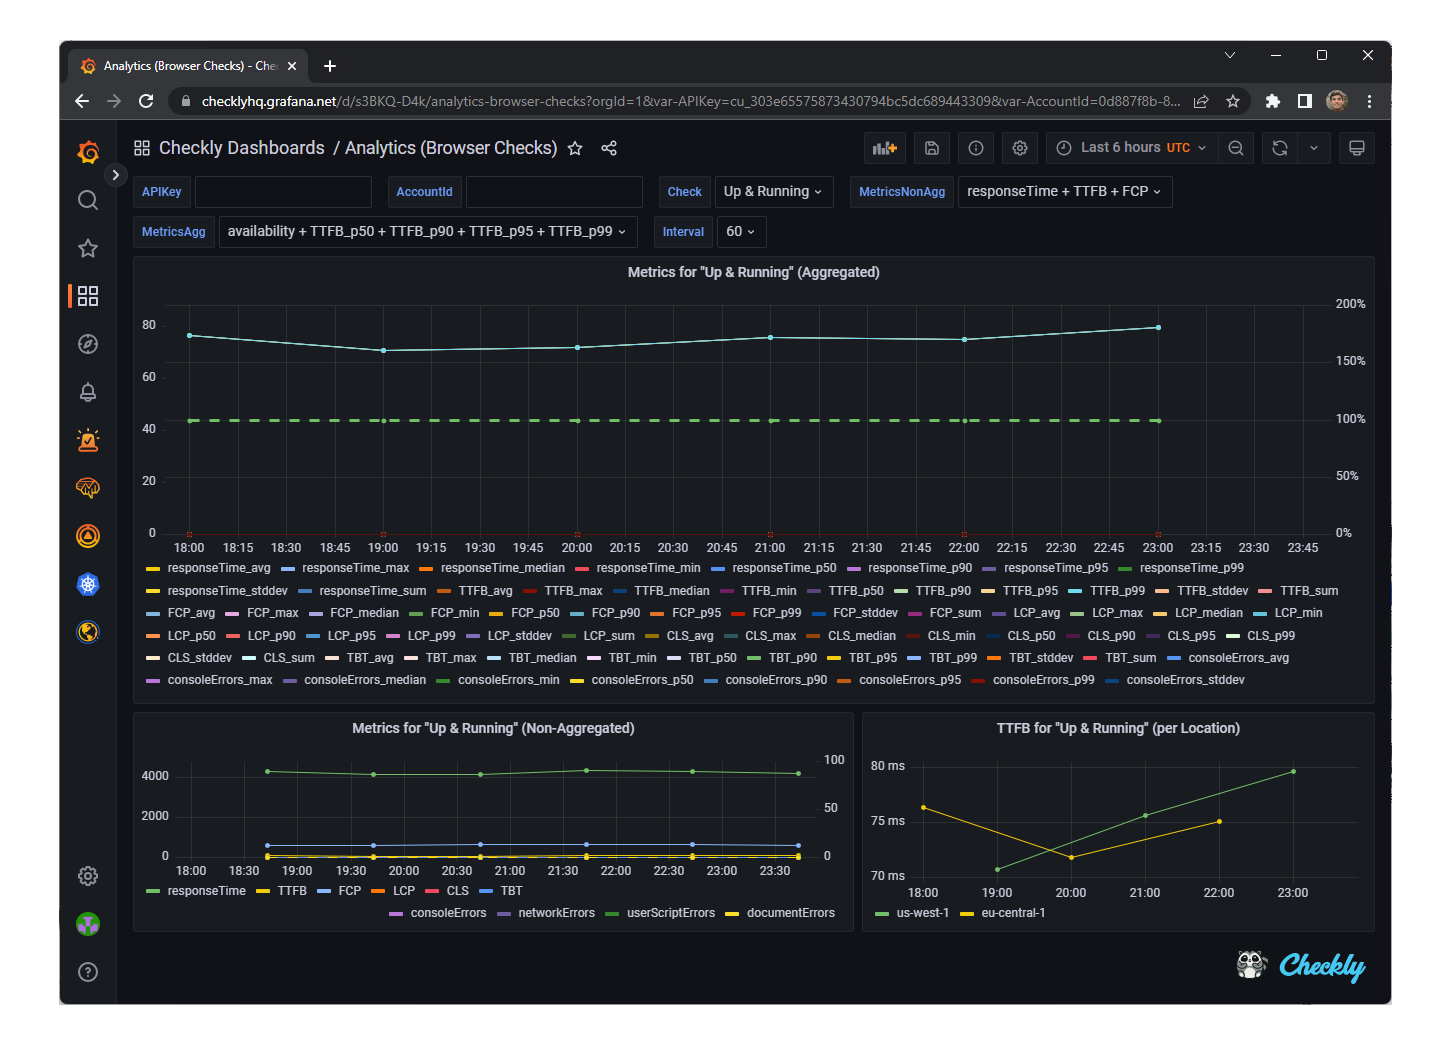
 1. Designing the dashboard
You can mix multiple components to create a beautiful dashboard. The following screenshot shows a dashboard with three types of results:
* aggregated
* non-aggregated
* and summarized grouped by location.
1. Designing the dashboard
You can mix multiple components to create a beautiful dashboard. The following screenshot shows a dashboard with three types of results:
* aggregated
* non-aggregated
* and summarized grouped by location.
 ## Creating reports with Google Sheets
You can start creating your reports by using our public Google Sheets report example template. The spreadsheet includes the `=ChecklyAPI()` function to consume the Checkly Public API just entering configuring your credentials.
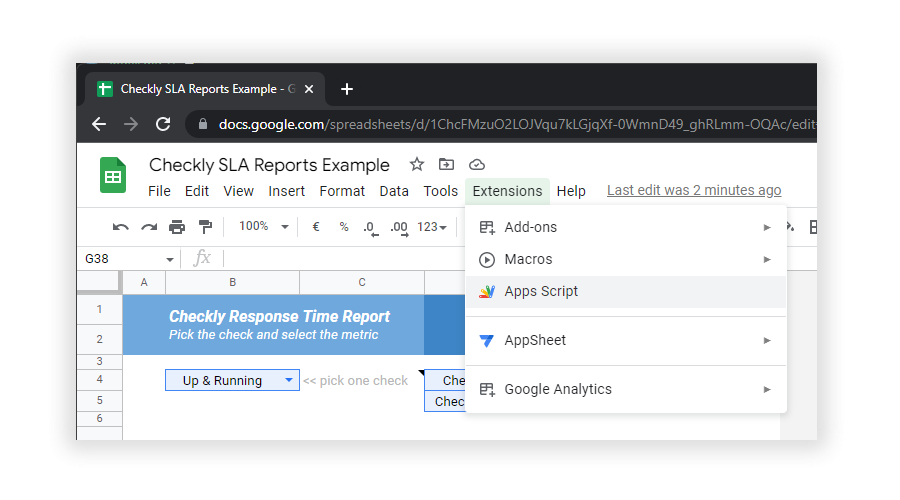
1. Make a copy of our [public Google Sheets template](https://docs.google.com/spreadsheets/d/1ChcFMzuO2LOJVqu7kLGjqXf-0WmnD49_ghRLmm-OQAc/edit#gid=747858019).
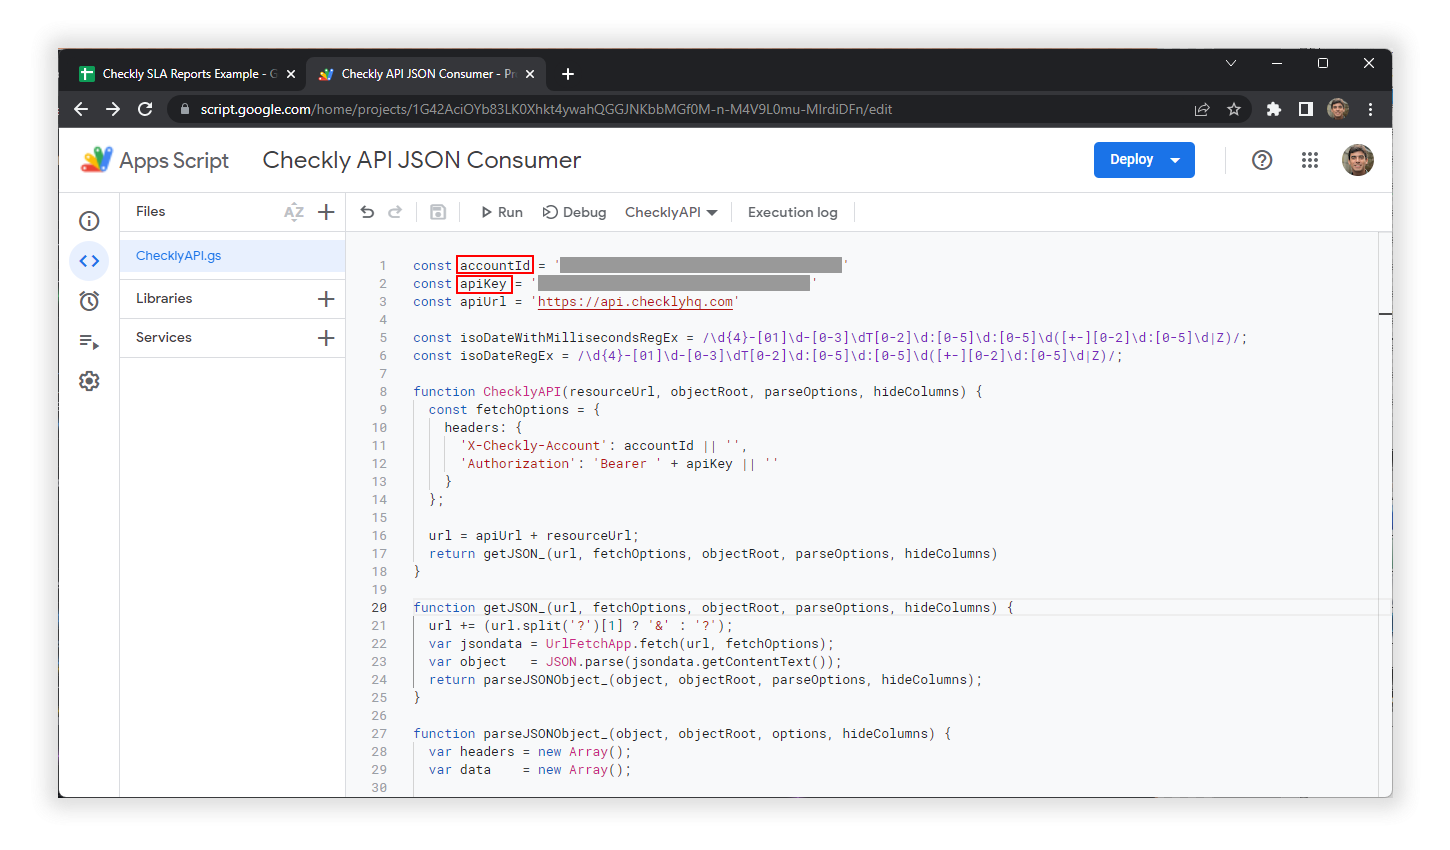
2. Add your `Account Id` and `API Key` in the Apps Script code (be careful if you'll share your spreadsheet with your credentials)
## Creating reports with Google Sheets
You can start creating your reports by using our public Google Sheets report example template. The spreadsheet includes the `=ChecklyAPI()` function to consume the Checkly Public API just entering configuring your credentials.
1. Make a copy of our [public Google Sheets template](https://docs.google.com/spreadsheets/d/1ChcFMzuO2LOJVqu7kLGjqXf-0WmnD49_ghRLmm-OQAc/edit#gid=747858019).
2. Add your `Account Id` and `API Key` in the Apps Script code (be careful if you'll share your spreadsheet with your credentials)
 3. Navigate the `Metrics` and `Checks` pages to confirm `Checkly Public API` requests are working
4. Go to the `Analytics Report` page, pick a check, pick a metric and see if the chart shows the correct information
3. Navigate the `Metrics` and `Checks` pages to confirm `Checkly Public API` requests are working
4. Go to the `Analytics Report` page, pick a check, pick a metric and see if the chart shows the correct information
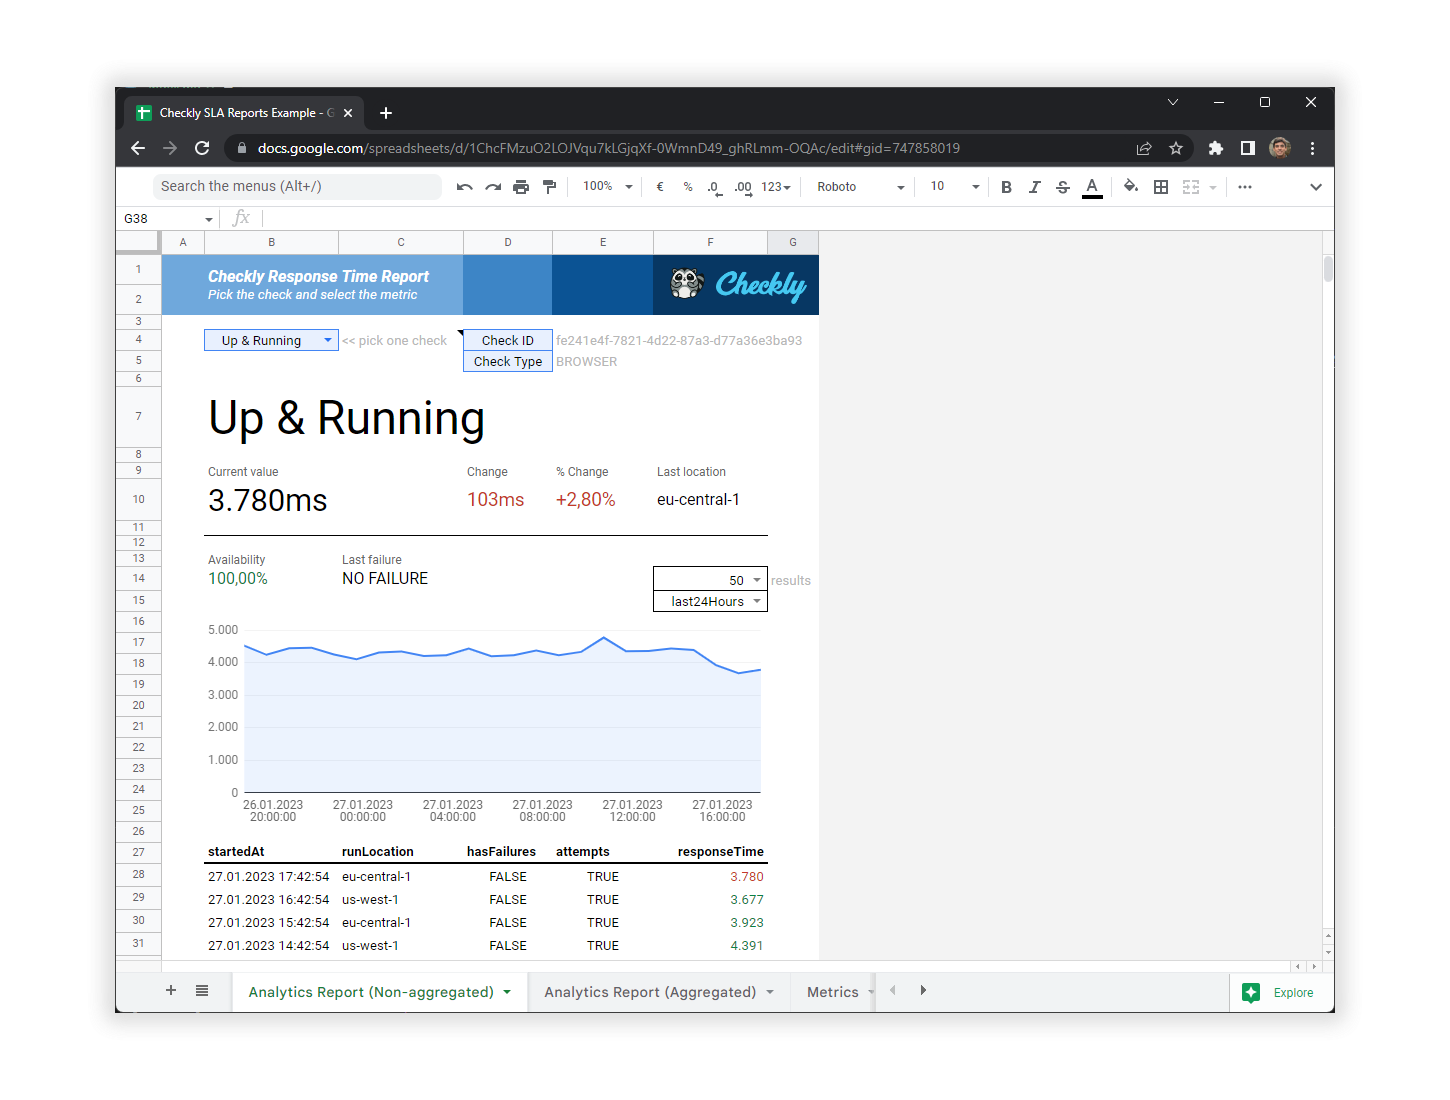
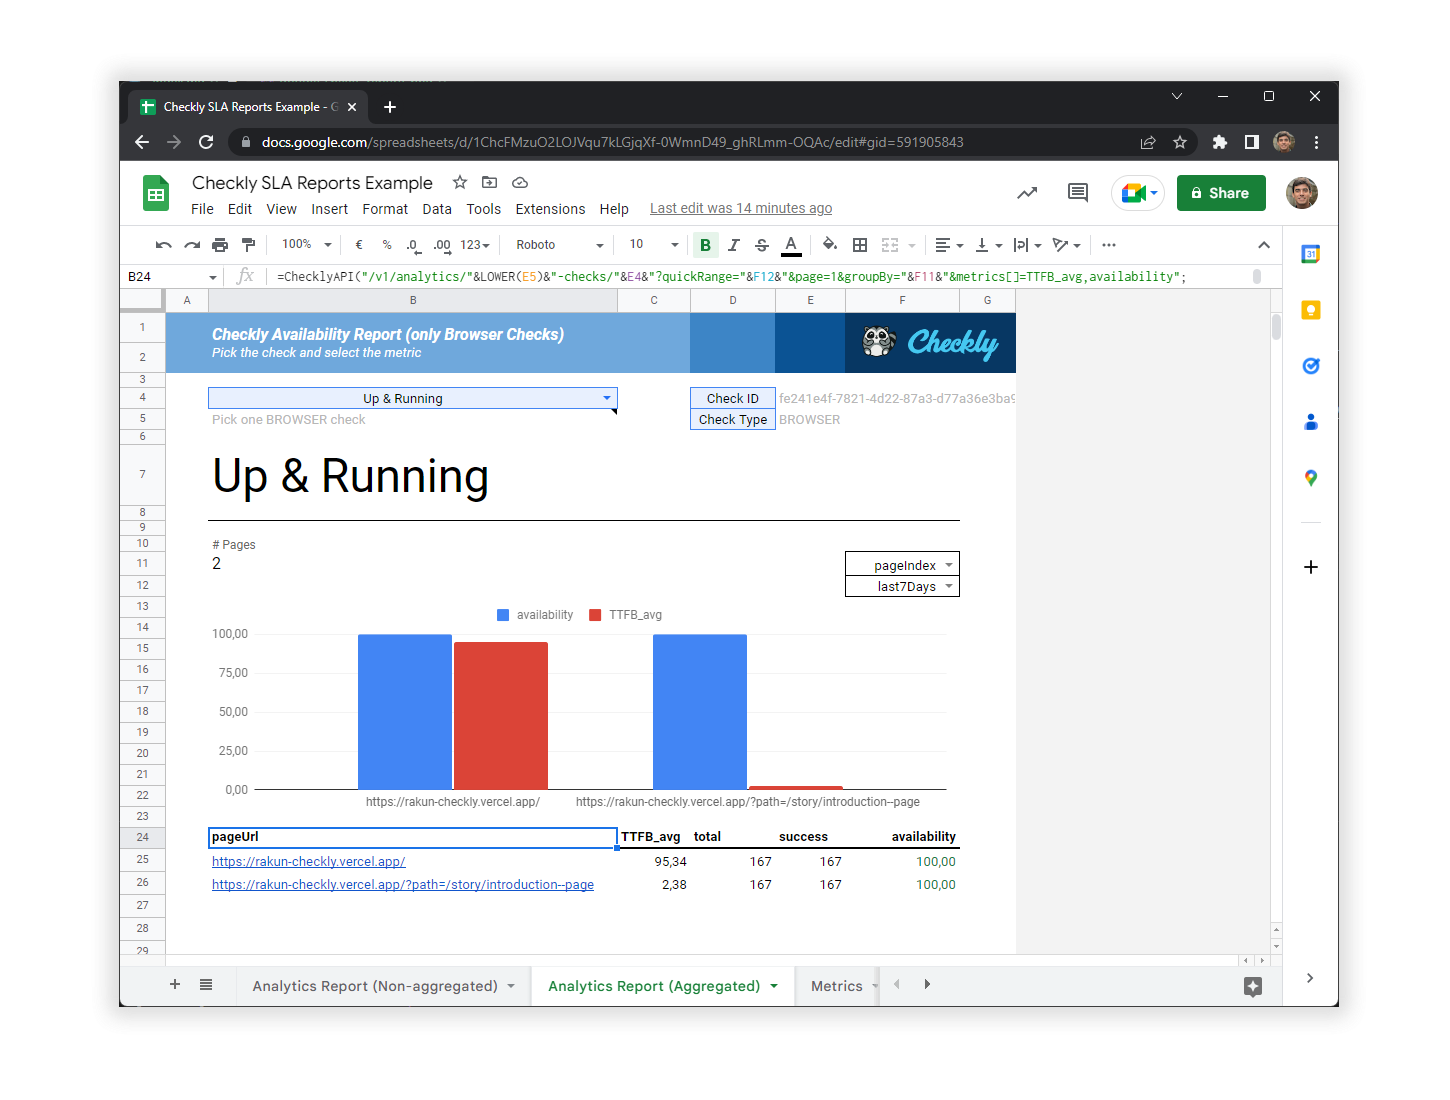 You'll find dropdown cells to select the check, number of results, quick time range presets, or grouping attribute.
## Creating report using `curl` and `jq`
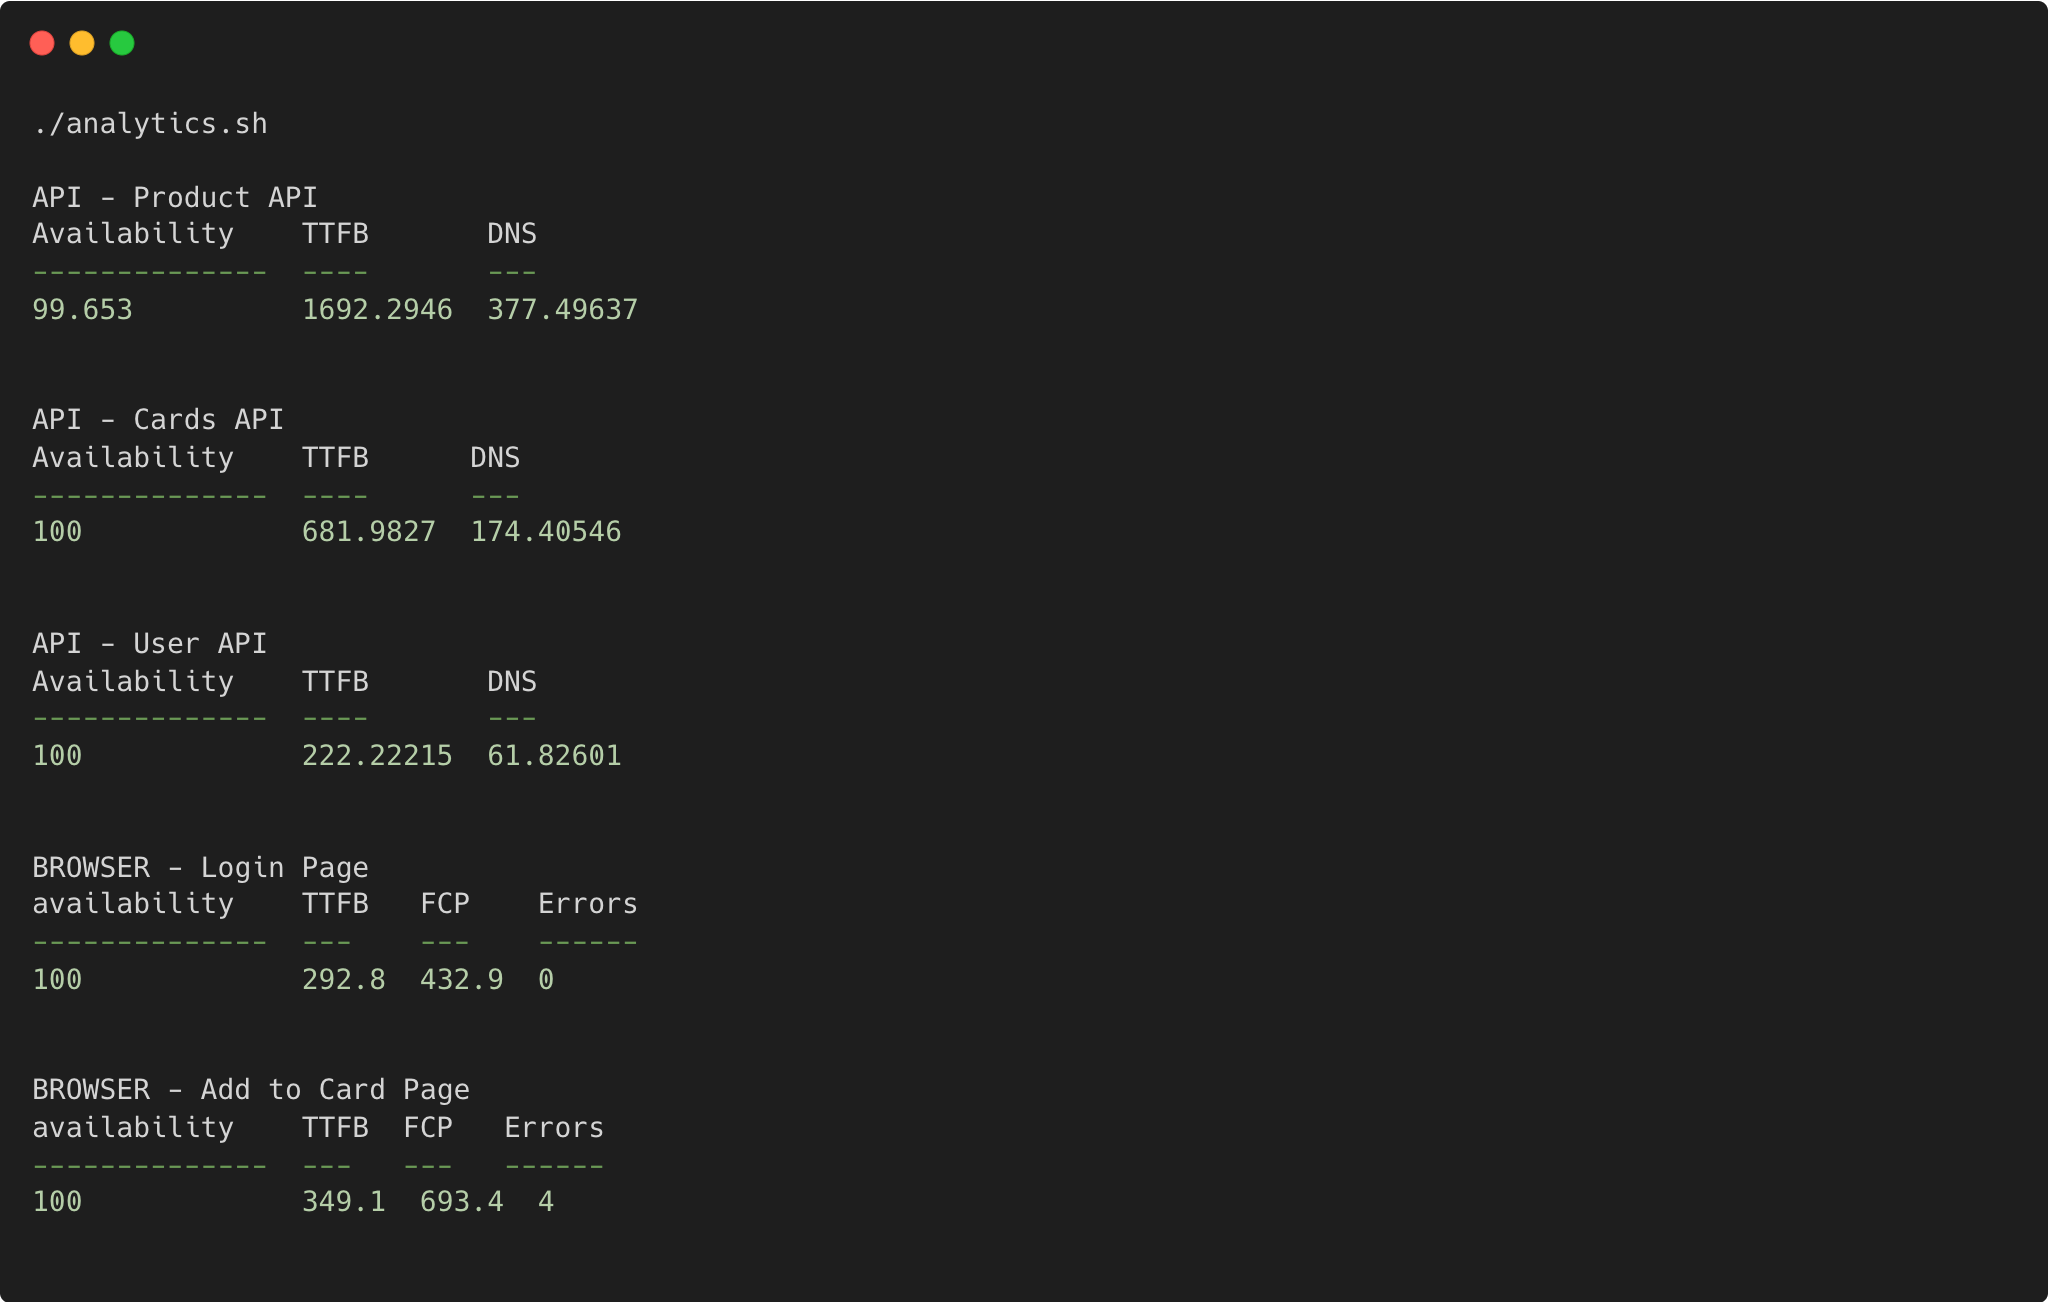
You can even whip up a `bash` script and use `curl` and `jq` to print useful analytics to your terminal. Here is an example
script that does the following:
1. It fetches your checks from the `/v1/checks` endpoint.
2. Loops over your checks and based on the check type, calls the `v1/analytics/` endpoint to gather useful data.
```bash theme={null}
#!
ACCOUNT_ID=
TOKEN=
rawChecks=$(curl -s --request GET \
--url 'https://api-test.checklyhq.com/v1/checks?limit=5&page=1' \
--header "Authorization: Bearer ${TOKEN}" \
--header "X-Checkly-Account: ${ACCOUNT_ID}")
checksAndTypes=$(jq -c 'sort_by(.checkType) | [.[] | {id, checkType}]' <<< "${rawChecks}" )
printf '\n'
for row in $(echo "${checksAndTypes}" | jq -c '.[]'); do
checkType=$(jq -r '.checkType' <<< "${row}")
checkId=$(jq -r '.id' <<< "${row}")
case $checkType in
BROWSER)
rawMetric=$(curl -s --request GET \
--url "https://api-test.checklyhq.com/v1/analytics/browser-checks/${checkId}?metrics%5B%5D=TTFB_p99&metrics%5B%5D=FCP_p99&metrics%5B%5D=consoleErrors_sum&metrics%5B%5D=availability&quickRange=last30Days" \
--header "Authorization: Bearer ${TOKEN}" \
--header "X-Checkly-Account: ${ACCOUNT_ID}")
jq -jr '.checkType, " - ", .name' <<< "${rawMetric}"
printf '\n'
jq -r '"availability\tTTFB\tFCP\tErrors", "--------------\t---\t---\t------", (.series[0].data[]| "\(.availability)\t\(.TTFB_p99)\t\(.FCP_p99)\t\(.consoleErrors_sum)")' <<< "${rawMetric}" | column -t -s $'\t'
;;
API)
rawMetric=$(curl -s --request GET \
--url "https://api-test.checklyhq.com/v1/analytics/api-checks/${checkId}?metrics%5B%5D=firstByte_p99&metrics%5B%5D=availability&metrics%5B%5D=dns_p99" \
--header "Authorization: Bearer ${TOKEN}" \
--header "X-Checkly-Account: ${ACCOUNT_ID}")
jq -jr '.checkType, " - ", .name' <<< "${rawMetric}"
printf '\n'
jq -r '"Availability\tTTFB\tDNS", "--------------\t----\t---", (.series[0].data[]| "\(.availability)\t\(.firstByte_p99)\t\(.dns_p99)")' <<< "${rawMetric}" | column -t -s $'\t'
;;
*)
echo -n "unknown"
;;
esac
printf '%.0s\n' {1..2}
done
```
Save this script in a file called `analytics.sh` and run it. You will get an output similar to:
You'll find dropdown cells to select the check, number of results, quick time range presets, or grouping attribute.
## Creating report using `curl` and `jq`
You can even whip up a `bash` script and use `curl` and `jq` to print useful analytics to your terminal. Here is an example
script that does the following:
1. It fetches your checks from the `/v1/checks` endpoint.
2. Loops over your checks and based on the check type, calls the `v1/analytics/` endpoint to gather useful data.
```bash theme={null}
#!
ACCOUNT_ID=
TOKEN=
rawChecks=$(curl -s --request GET \
--url 'https://api-test.checklyhq.com/v1/checks?limit=5&page=1' \
--header "Authorization: Bearer ${TOKEN}" \
--header "X-Checkly-Account: ${ACCOUNT_ID}")
checksAndTypes=$(jq -c 'sort_by(.checkType) | [.[] | {id, checkType}]' <<< "${rawChecks}" )
printf '\n'
for row in $(echo "${checksAndTypes}" | jq -c '.[]'); do
checkType=$(jq -r '.checkType' <<< "${row}")
checkId=$(jq -r '.id' <<< "${row}")
case $checkType in
BROWSER)
rawMetric=$(curl -s --request GET \
--url "https://api-test.checklyhq.com/v1/analytics/browser-checks/${checkId}?metrics%5B%5D=TTFB_p99&metrics%5B%5D=FCP_p99&metrics%5B%5D=consoleErrors_sum&metrics%5B%5D=availability&quickRange=last30Days" \
--header "Authorization: Bearer ${TOKEN}" \
--header "X-Checkly-Account: ${ACCOUNT_ID}")
jq -jr '.checkType, " - ", .name' <<< "${rawMetric}"
printf '\n'
jq -r '"availability\tTTFB\tFCP\tErrors", "--------------\t---\t---\t------", (.series[0].data[]| "\(.availability)\t\(.TTFB_p99)\t\(.FCP_p99)\t\(.consoleErrors_sum)")' <<< "${rawMetric}" | column -t -s $'\t'
;;
API)
rawMetric=$(curl -s --request GET \
--url "https://api-test.checklyhq.com/v1/analytics/api-checks/${checkId}?metrics%5B%5D=firstByte_p99&metrics%5B%5D=availability&metrics%5B%5D=dns_p99" \
--header "Authorization: Bearer ${TOKEN}" \
--header "X-Checkly-Account: ${ACCOUNT_ID}")
jq -jr '.checkType, " - ", .name' <<< "${rawMetric}"
printf '\n'
jq -r '"Availability\tTTFB\tDNS", "--------------\t----\t---", (.series[0].data[]| "\(.availability)\t\(.firstByte_p99)\t\(.dns_p99)")' <<< "${rawMetric}" | column -t -s $'\t'
;;
*)
echo -n "unknown"
;;
esac
printf '%.0s\n' {1..2}
done
```
Save this script in a file called `analytics.sh` and run it. You will get an output similar to: