> ## Documentation Index
> Fetch the complete documentation index at: https://checklyhq.com/docs/llms.txt
> Use this file to discover all available pages before exploring further.
# Exporting Traces to Grafana Tempo
> Learn how to export traces from Checkly to Grafana Tempo.
You can connect the Traces export to Grafana using the OpenTelemetry Integration and Grafana Tempo.
1. Make sure that you have Tempo running on your Grafana Cloud Instance at `yourOrganization.grafana.net`. Find it at **Connections > Search for Tempo > Check if Tempo Data source is marked as installed**.
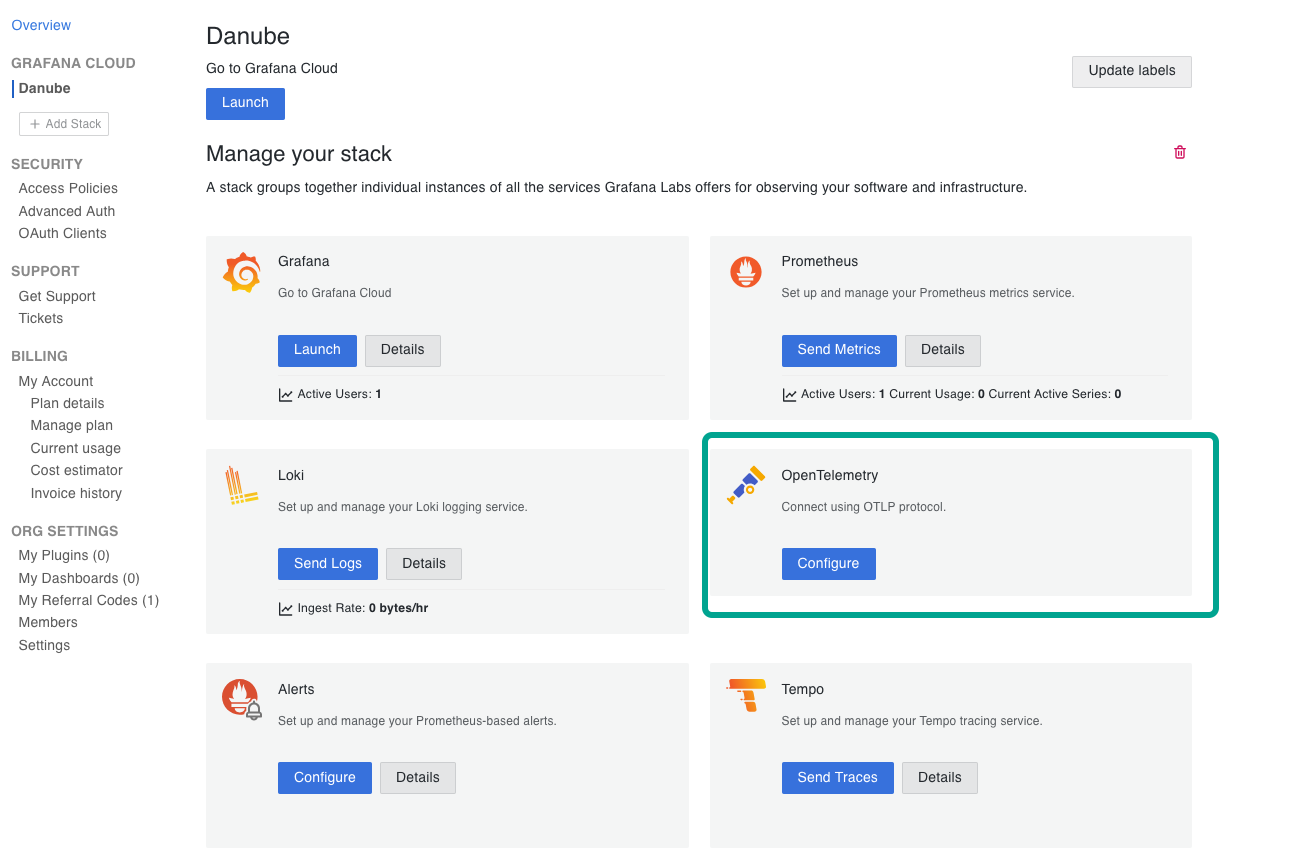
2. In Grafana Cloud (`grafana.com/orgs/yourOrganization`), head over to **Connections** > **Add new connection** > **OpenTelemetry (OTLP)**.
 3. Copy the endpoint URL and append `v1/traces` to it.
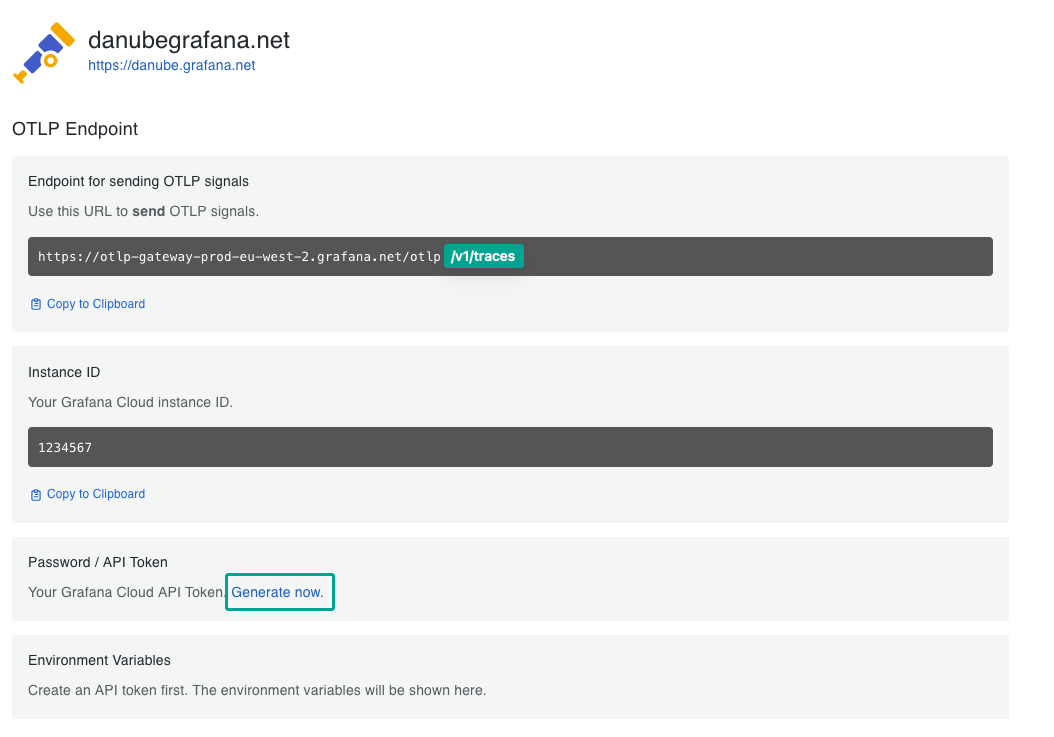 It should be similar to:`https://otlp-gateway-prod-eu-west-2.grafana.net/otlp/v1/traces`.
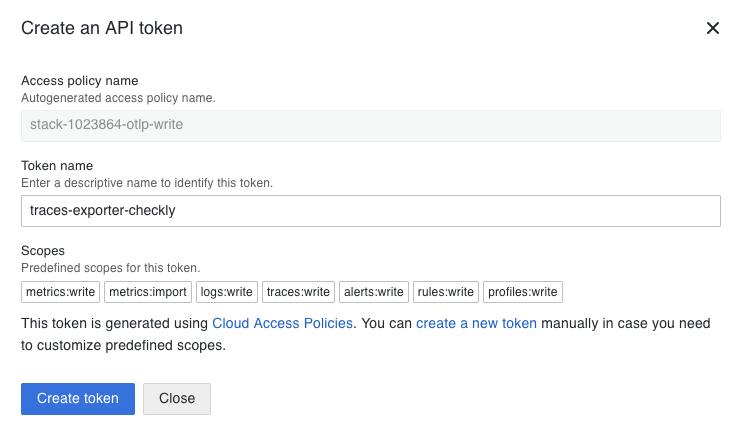
4. Generate an OTLP Token, and copy both the Instance ID and the OTLP Token as well.
It should be similar to:`https://otlp-gateway-prod-eu-west-2.grafana.net/otlp/v1/traces`.
4. Generate an OTLP Token, and copy both the Instance ID and the OTLP Token as well.
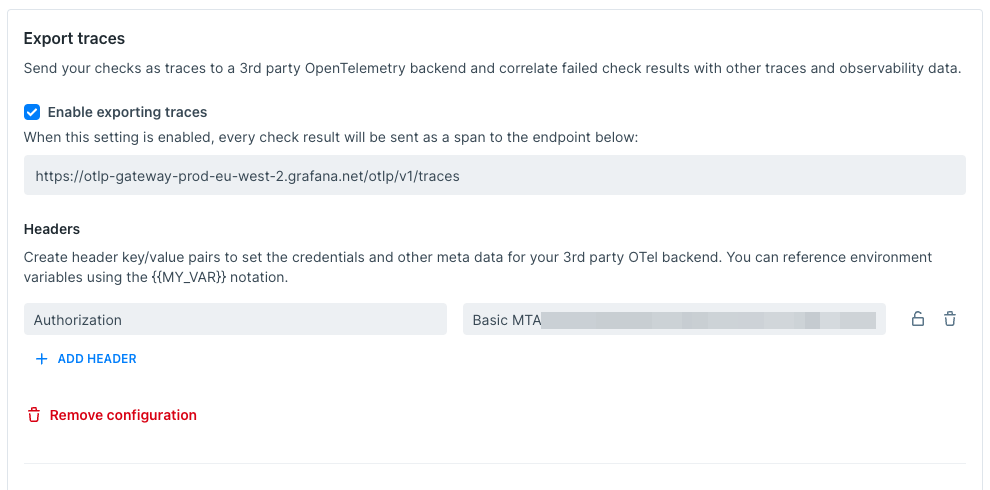
 5. Head back to the [Traces Settings page](https://app.checklyhq.com/settings/account/traces) on Checkly.
* Enable exporting traces and add the endpoint URL from step 3.
* and in the **Headers** section, specify the HTTP Header: `Authorization` and `Basic instance:token`, where `instance:token` is base64 encoded.
You can use an online tool like [base64encode.net](https://www.base64encode.net/)
to encode your instance and token.
5. Head back to the [Traces Settings page](https://app.checklyhq.com/settings/account/traces) on Checkly.
* Enable exporting traces and add the endpoint URL from step 3.
* and in the **Headers** section, specify the HTTP Header: `Authorization` and `Basic instance:token`, where `instance:token` is base64 encoded.
You can use an online tool like [base64encode.net](https://www.base64encode.net/)
to encode your instance and token.
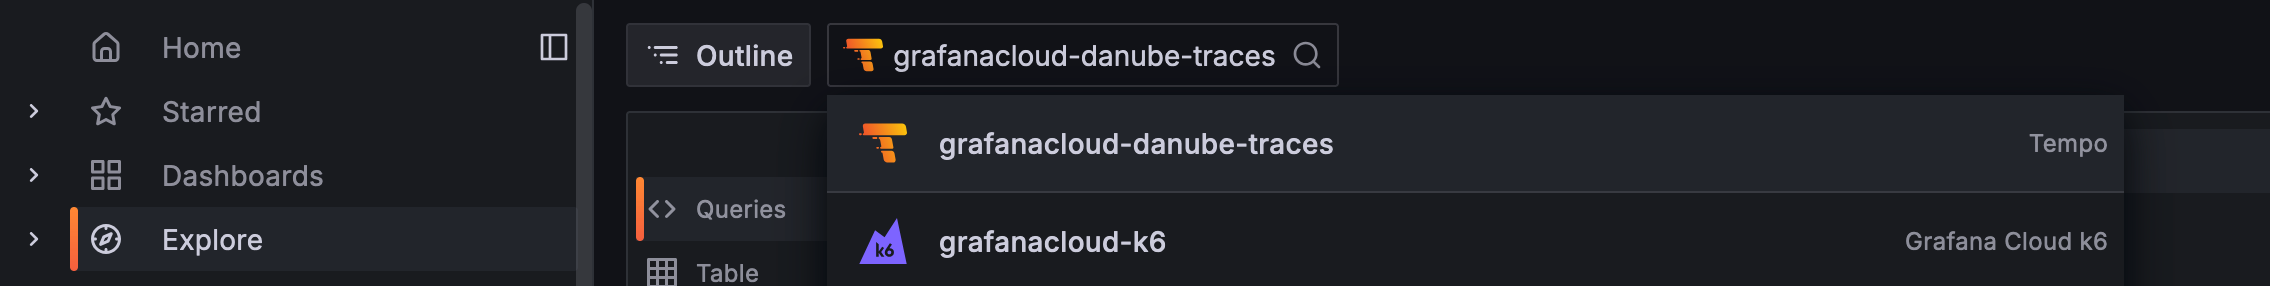
 2. Back in your Grafana Cloud Instance (for example danube.grafana.net), head over to "Explore", select the *Tempo* source that is named `grafanacloud-yourOrganization-traces`:
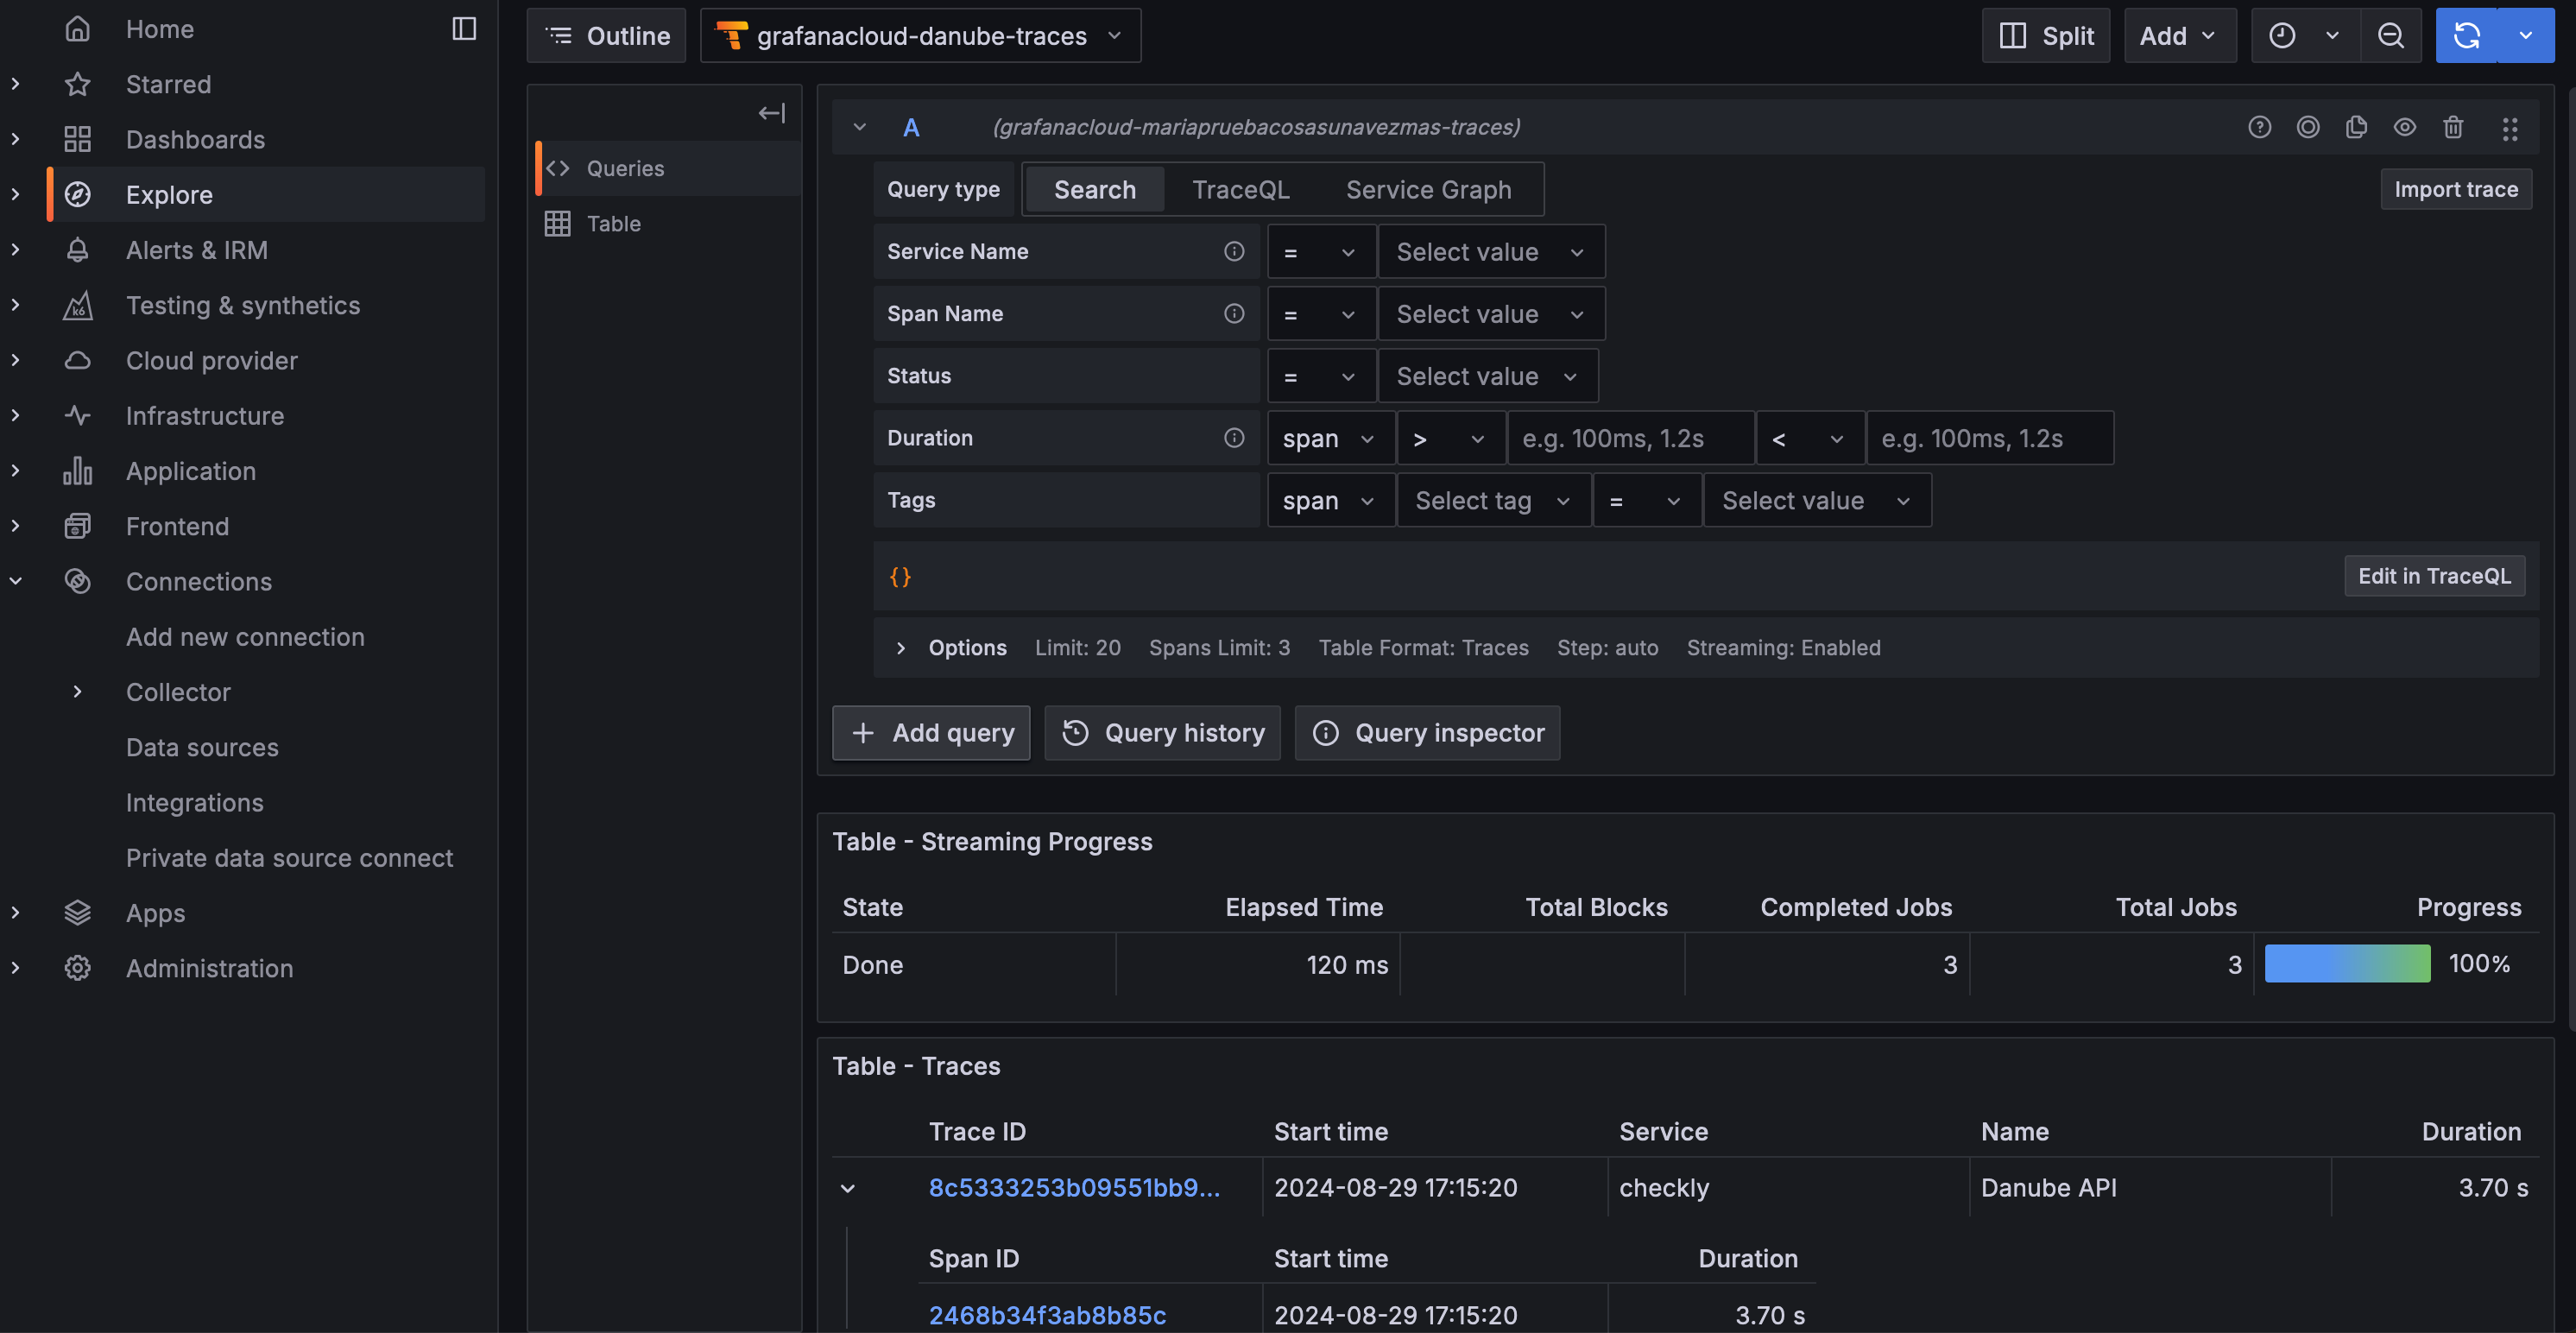
 Now, click **Search** to see the table of Traces received. The ones exported by Checkly, have `checkly` in the service column.
 Find more the details in the [Grafana OpenTelemetry documentation](https://grafana.com/docs/grafana-cloud/send-data/otlp/send-data-otlp/?pg=traces\&plcmt=hero-btn-2#before-you-begin).