> ## Documentation Index
> Fetch the complete documentation index at: https://checklyhq.com/docs/llms.txt
> Use this file to discover all available pages before exploring further.
# Node.js
> Learn how to instrument your Node.js code with OpenTelemetry.
This guide will help you instrument your Node.js application(s) with OpenTelemetry and send traces to Checkly.
## Step 1: Install the OpenTelemetry packages
Install the relevant OpenTelemetry packages:
```bash Terminal theme={null}
npm install --save \
@opentelemetry/sdk-node \
@opentelemetry/exporter-trace-otlp-proto \
@opentelemetry/auto-instrumentations-node \
@opentelemetry/sdk-trace-base \
@opentelemetry/api
```
## Step 2: Initialize the instrumentation
Create a file called `tracing.js` at the root of your project and add the following code:
```javascript tracing.js theme={null}
const { NodeSDK } = require('@opentelemetry/sdk-node')
const { OTLPTraceExporter } = require('@opentelemetry/exporter-trace-otlp-proto')
const { getNodeAutoInstrumentations } = require('@opentelemetry/auto-instrumentations-node')
const { BatchSpanProcessor, SamplingDecision } = require('@opentelemetry/sdk-trace-base')
const { trace } = require('@opentelemetry/api')
const exporter = new OTLPTraceExporter({
timeoutMillis: 2000,
})
const sdk = new NodeSDK({
instrumentations: [getNodeAutoInstrumentations()],
spanProcessors: [new BatchSpanProcessor(exporter)],
sampler: {
shouldSample: (context, traceId, spanName, spanKind, attributes, links) => {
const isChecklySpan = trace.getSpan(context)?.spanContext()?.traceState?.get('checkly')
if (isChecklySpan) {
return { decision: SamplingDecision.RECORD_AND_SAMPLED }
} else {
return { decision: SamplingDecision.NOT_RECORD }
}
},
},
})
sdk.start()
process.on('SIGTERM', () => {
sdk.shutdown()
.then(() => console.log('OTel Tracing terminated'))
.catch((error) => console.log('Error terminating OTel tracing', error))
.finally(() => process.exit(0))
})
```
Notice the `sampler` configuration. This is a custom, **head-based sampler** that will only sample spans that are generated by Checkly by
inspecting the trace state. This way you only pay for the egress traffic generated by Checkly and not for any other traffic.
## Step 3: Start your app with the instrumentation
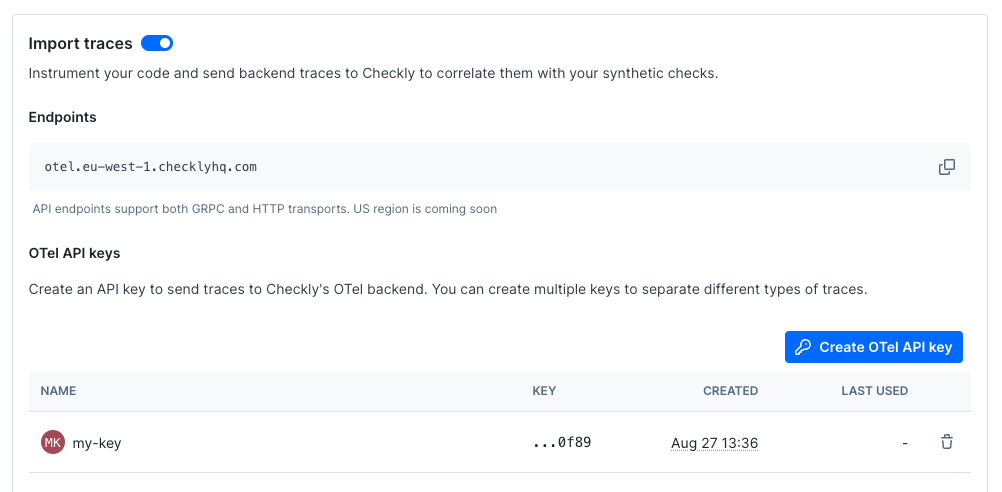
Toggle on **Import Traces** and grab your OTel API key in the **OTel API keys** section of the [Traces page in the Checkly app](https://app.checklyhq.com/settings/account/traces) and take a note of the endpoint for the region you want to use.
 Now, export your API key in your shell by setting the `OTEL_EXPORTER_OTLP_HEADERS` environment variable.
```bash Terminal theme={null}
export OTEL_EXPORTER_OTLP_HEADERS="authorization="
```
Next, export the endpoint for the region you want to use and give your service a name.
```bash Terminal theme={null}
export OTEL_EXPORTER_OTLP_ENDPOINT="https://otel.eu-west-1.checklyhq.com"
export OTEL_SERVICE_NAME="your-service-name"
```
Then, explicitly set the protocol to use for the OTLP exporter.
```bash Terminal theme={null}
export OTEL_EXPORTER_OTLP_PROTOCOL="http/protobuf"
```
We are using the standard OpenTelemetry environment variables here to configure the OTLP exporter.
| Variable | Description |
| ----------------------------- | ---------------------------------------------------------------------- |
| `OTEL_EXPORTER_OTLP_HEADERS` | The `Authorization` HTTP header containing your Checkly OTel API key. |
| `OTEL_EXPORTER_OTLP_ENDPOINT` | The Checkly OTel API endpoint for the region you want to use. |
| `OTEL_EXPORTER_OTLP_PROTOCOL` | The protocol to use for the OTLP exporter. |
| `OTEL_SERVICE_NAME` | The name of your service to identify it among the spans in the web UI. |
Then start your app with the extra `-r` flag to load the `tracing.js` file before any other files are loaded.
```bash Terminal theme={null}
node -r ./tracing.js index.js
```
🎉 You are done. Any interactions with your app that are triggered by a Checkly synthetic monitoring check will now generate
traces, which are sent back to Checkly and displayed in the Checkly UI.
## Reducing noise in the auto Node.js instrumentation
We found the Node.js auto-instrumentation a bit noisy. There can be a lot of file i/o and a ton of DNS calls you might not
be interested in. Luckily, you can easily tweak that by providing some extra options to the `getNodeAutoInstrumentations()` function.
We use the following configuration to filter out some of the noise:
```javascript tracing.js theme={null}
instrumentations: [getNodeAutoInstrumentations({
'@opentelemetry/instrumentation-fs': {
enabled: false,
},
'@opentelemetry/instrumentation-net': {
enabled: false,
},
'@opentelemetry/instrumentation-dns': {
enabled: false,
},
'@opentelemetry/instrumentation-http': {
enabled: true,
},
})]
```
Now, export your API key in your shell by setting the `OTEL_EXPORTER_OTLP_HEADERS` environment variable.
```bash Terminal theme={null}
export OTEL_EXPORTER_OTLP_HEADERS="authorization="
```
Next, export the endpoint for the region you want to use and give your service a name.
```bash Terminal theme={null}
export OTEL_EXPORTER_OTLP_ENDPOINT="https://otel.eu-west-1.checklyhq.com"
export OTEL_SERVICE_NAME="your-service-name"
```
Then, explicitly set the protocol to use for the OTLP exporter.
```bash Terminal theme={null}
export OTEL_EXPORTER_OTLP_PROTOCOL="http/protobuf"
```
We are using the standard OpenTelemetry environment variables here to configure the OTLP exporter.
| Variable | Description |
| ----------------------------- | ---------------------------------------------------------------------- |
| `OTEL_EXPORTER_OTLP_HEADERS` | The `Authorization` HTTP header containing your Checkly OTel API key. |
| `OTEL_EXPORTER_OTLP_ENDPOINT` | The Checkly OTel API endpoint for the region you want to use. |
| `OTEL_EXPORTER_OTLP_PROTOCOL` | The protocol to use for the OTLP exporter. |
| `OTEL_SERVICE_NAME` | The name of your service to identify it among the spans in the web UI. |
Then start your app with the extra `-r` flag to load the `tracing.js` file before any other files are loaded.
```bash Terminal theme={null}
node -r ./tracing.js index.js
```
🎉 You are done. Any interactions with your app that are triggered by a Checkly synthetic monitoring check will now generate
traces, which are sent back to Checkly and displayed in the Checkly UI.
## Reducing noise in the auto Node.js instrumentation
We found the Node.js auto-instrumentation a bit noisy. There can be a lot of file i/o and a ton of DNS calls you might not
be interested in. Luckily, you can easily tweak that by providing some extra options to the `getNodeAutoInstrumentations()` function.
We use the following configuration to filter out some of the noise:
```javascript tracing.js theme={null}
instrumentations: [getNodeAutoInstrumentations({
'@opentelemetry/instrumentation-fs': {
enabled: false,
},
'@opentelemetry/instrumentation-net': {
enabled: false,
},
'@opentelemetry/instrumentation-dns': {
enabled: false,
},
'@opentelemetry/instrumentation-http': {
enabled: true,
},
})]
```