> ## Documentation Index
> Fetch the complete documentation index at: https://checklyhq.com/docs/llms.txt
> Use this file to discover all available pages before exploring further.
# Ruby on Rails
> Learn how to instrument your Ruby on Rails code with OpenTelemetry.
This guide will help you instrument your Ruby on Rails application(s) with OpenTelemetry and send traces to Checkly.
Although this guide is for [Ruby on Rails](https://rubyonrails.org/), the steps are largely the same as instrumenting
any Ruby application with OpenTelemetry. This guide assumes you have a basic understanding of Ruby on Rails and already
have a working Rails application.
## Step 1: Install the OpenTelemetry packages
Go to the root of your Rails app and add the basic OpenTelemetry SDK, OTLP exporter and instrumentation gems to your Gemfile:
```bash Terminal theme={null}
bundle add opentelemetry-sdk \
opentelemetry-exporter-otlp \
opentelemetry-instrumentation-all
```
This should add the following lines:
```ruby Gemfile theme={null}
gem "opentelemetry-sdk", "~> 1.4"
gem "opentelemetry-exporter-otlp", "~> 0.26.3"
gem "opentelemetry-instrumentation-all", "~> 0.60.0"
```
## Step 2: Initialize the instrumentation
As per the Ruby on Rails convention, we add an `instrumentation.rb` file to the `config/initializers` directory.
```ruby config/initializers/instrumentation.rb theme={null}
require 'opentelemetry/sdk'
require 'opentelemetry/instrumentation/all'
class ChecklySampler
def should_sample?(trace_id:, parent_context:, links:, name:, kind:, attributes:)
tracestate = OpenTelemetry::Trace.current_span(parent_context).context.tracestate
decision = tracestate.value('checkly') ? OpenTelemetry::SDK::Trace::Samplers::Decision::RECORD_AND_SAMPLE :
OpenTelemetry::SDK::Trace::Samplers::Decision::DROP
puts(decision)
OpenTelemetry::SDK::Trace::Samplers::Result.new(decision: decision, attributes: {}, tracestate: tracestate)
end
def description
'ChecklySampler'
end
end
OpenTelemetry::SDK.configure do |c|
c.use_all()
end
OpenTelemetry.tracer_provider.sampler = ChecklySampler.new
```
Notice the `ChecklySampler` configuration. This is a custom, **head-based sampler** that will only sample spans that
are generated by Checkly by inspecting the trace state. This way you only pay for the egress traffic generated by Checkly
and not for any other traffic. Also note that the `use_all()` method will automatically install all available
instrumentation libraries.
## Step 3: Start your app with the instrumentation
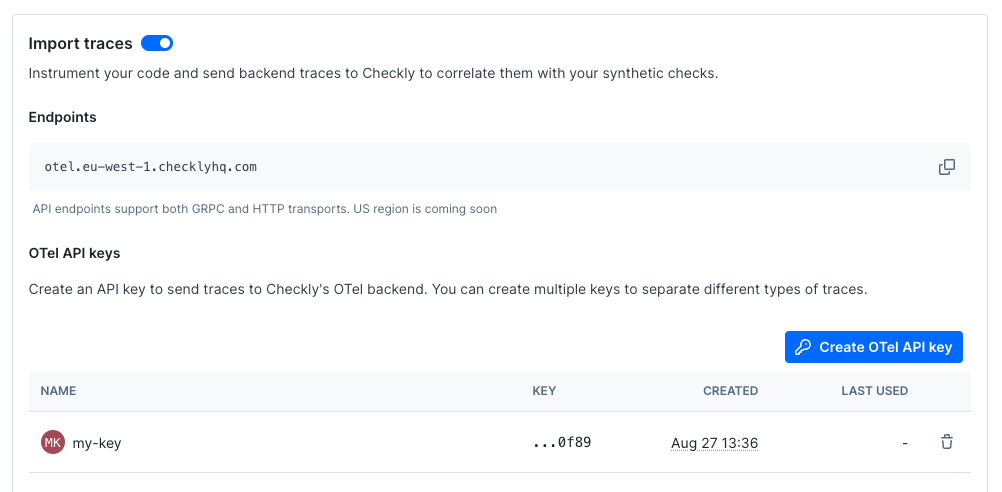
Toggle on **Import Traces** and grab your OTel API key in the **OTel API keys** section of the [Traces page in the Checkly app](https://app.checklyhq.com/settings/account/traces) and take a note of the endpoint for the region you want to use.
 Now, export your API key in your shell by setting the `OTEL_EXPORTER_OTLP_HEADERS` environment variable.
```bash Terminal theme={null}
export OTEL_EXPORTER_OTLP_HEADERS="authorization="
```
Next, export the endpoint for the region you want to use and give your service a name.
```bash Terminal theme={null}
export OTEL_EXPORTER_OTLP_ENDPOINT="https://otel.eu-west-1.checklyhq.com"
export OTEL_SERVICE_NAME="your-service-name"
```
Then, explicitly set the protocol to use for the OTLP exporter.
```bash Terminal theme={null}
export OTEL_EXPORTER_OTLP_PROTOCOL="http/protobuf"
```
We are using the standard OpenTelemetry environment variables here to configure the OTLP exporter.
| Variable | Description |
| ----------------------------- | ---------------------------------------------------------------------- |
| `OTEL_EXPORTER_OTLP_HEADERS` | The `Authorization` HTTP header containing your Checkly OTel API key. |
| `OTEL_EXPORTER_OTLP_ENDPOINT` | The Checkly OTel API endpoint for the region you want to use. |
| `OTEL_EXPORTER_OTLP_PROTOCOL` | The protocol to use for the OTLP exporter. |
| `OTEL_SERVICE_NAME` | The name of your service to identify it among the spans in the web UI. |
You can now restart your Rails app with the instrumentation enabled.
```bash Terminal theme={null}
rails server
```
## Debugging and troubleshooting
If you run into any issues, you can also output any traces to the console as follows:
```bash Terminal theme={null}
env OTEL_TRACES_EXPORTER=console rails server
```
Similarly, you can set the `OTEL_LOG_LEVEL` environment variable to `DEBUG` to get more detailed logs.
```bash Terminal theme={null}
env OTEL_LOG_LEVEL=DEBUG rails server
```
## Further reading
* [https://opentelemetry.io/docs/languages/ruby/getting-started/](https://opentelemetry.io/docs/languages/ruby/getting-started/)
Now, export your API key in your shell by setting the `OTEL_EXPORTER_OTLP_HEADERS` environment variable.
```bash Terminal theme={null}
export OTEL_EXPORTER_OTLP_HEADERS="authorization="
```
Next, export the endpoint for the region you want to use and give your service a name.
```bash Terminal theme={null}
export OTEL_EXPORTER_OTLP_ENDPOINT="https://otel.eu-west-1.checklyhq.com"
export OTEL_SERVICE_NAME="your-service-name"
```
Then, explicitly set the protocol to use for the OTLP exporter.
```bash Terminal theme={null}
export OTEL_EXPORTER_OTLP_PROTOCOL="http/protobuf"
```
We are using the standard OpenTelemetry environment variables here to configure the OTLP exporter.
| Variable | Description |
| ----------------------------- | ---------------------------------------------------------------------- |
| `OTEL_EXPORTER_OTLP_HEADERS` | The `Authorization` HTTP header containing your Checkly OTel API key. |
| `OTEL_EXPORTER_OTLP_ENDPOINT` | The Checkly OTel API endpoint for the region you want to use. |
| `OTEL_EXPORTER_OTLP_PROTOCOL` | The protocol to use for the OTLP exporter. |
| `OTEL_SERVICE_NAME` | The name of your service to identify it among the spans in the web UI. |
You can now restart your Rails app with the instrumentation enabled.
```bash Terminal theme={null}
rails server
```
## Debugging and troubleshooting
If you run into any issues, you can also output any traces to the console as follows:
```bash Terminal theme={null}
env OTEL_TRACES_EXPORTER=console rails server
```
Similarly, you can set the `OTEL_LOG_LEVEL` environment variable to `DEBUG` to get more detailed logs.
```bash Terminal theme={null}
env OTEL_LOG_LEVEL=DEBUG rails server
```
## Further reading
* [https://opentelemetry.io/docs/languages/ruby/getting-started/](https://opentelemetry.io/docs/languages/ruby/getting-started/)