Why Real User Monitoring Matters
Real User Monitoring (RUM) gives you actual performance data from real people using your website or app. Unlike synthetic tests (which simulate users), RUM shows you exactly what your customers experience—the promise is that if even one of your users encounters an error, you’ll know about it.Key Benefits:
- Pinpoint Performance Issues – Discover which pages load slowly or behave poorly on specific devices (e.g., mobile vs. desktop).
- Reduce User Frustration – Catch errors before they drive users away.
- Optimize Business Impact – Faster pages = happier users = more conversions (sales, signups, engagement).
- Identify Trends — Will users trigger this edge case error often? Don’t just speculate, observe!
- Prioritize Fixes – Instead of guessing, use real data to decide what to improve first.
How RUM Works: From Data to Insights
1. Data Collection (The “What”)
A lightweight JavaScript snippet (or mobile SDK) tracks:- Page load times How long until the page is usable?
- Resource timing Did slow images or APIs delay rendering?
- User interactions Clicks, scrolls, form submissions
- Errors JavaScript crashes, failed API calls, broken assets
2. Data Transmission (The “How”)
- Data is sent to a monitoring backend
- Sampling (optional) reduces cost by sending only a % of sessions.
3. Analysis & Action (The “Why”)
- Dashboards show performance trends (e.g., “Mobile users in Europe are 40% slower”).
- Alerts notify you when error rates spike.
- Session replay (in some tools) lets you watch real users struggle with bugs.
Sampling & Storage: Balancing Cost and Detail
The Data Fire Hose Problem
RUM generates massive amounts of data. If you track every click, scroll, and page load for millions of users, costs can spiral. Storing RUM data isn’t just expensive for your storage solutions, it also means incredibly slow queries for trying to see historical performance.Solution: Tiered Storage (Like a “Data Lake”)
- Raw Bucket – Store everything (for rare deep dives).
- Example: Keep 100% of data for 7 days, then archive.
- Refined Bucket – Keep only key metrics (for daily dashboards).
- Example: Sample 10% of sessions to track trends.
- Engineers can query raw data when debugging.
- Product teams use refined data for high-level trends.
The limitations of RUM
The data fire hose problem mentioned above points to a more general issue with Real User Monitoring as a solution to observability problems: when compared with a measurement and testing tool using synthetics monitoring, the advantage of RUM is supposed to be that it measures every user everywhere. However as we see above the first solution to issues of storage and bandwidth is to start sampling data. Suddenly our monitoring of all users became ‘some users, sometimes.’RUM and the panopticon: you can’t really see everything
The issues with RUM are rather well correlated to the story of another ‘total observability’ solution, the classic panopticon. Originally conceived by Jeremy Bentham in the 1780’s, the idea is familiar to anyone who’s noticed hundreds of camera installations at their local Wal-Mart: a prison or factory where everyone could be observed at any time, but cannot see their observer.

Ready to start low-overhead frontend monitoring today? check out our practical guide on how to start frontend monitoring with Checkly and Playwright.
Sampling and its discontents
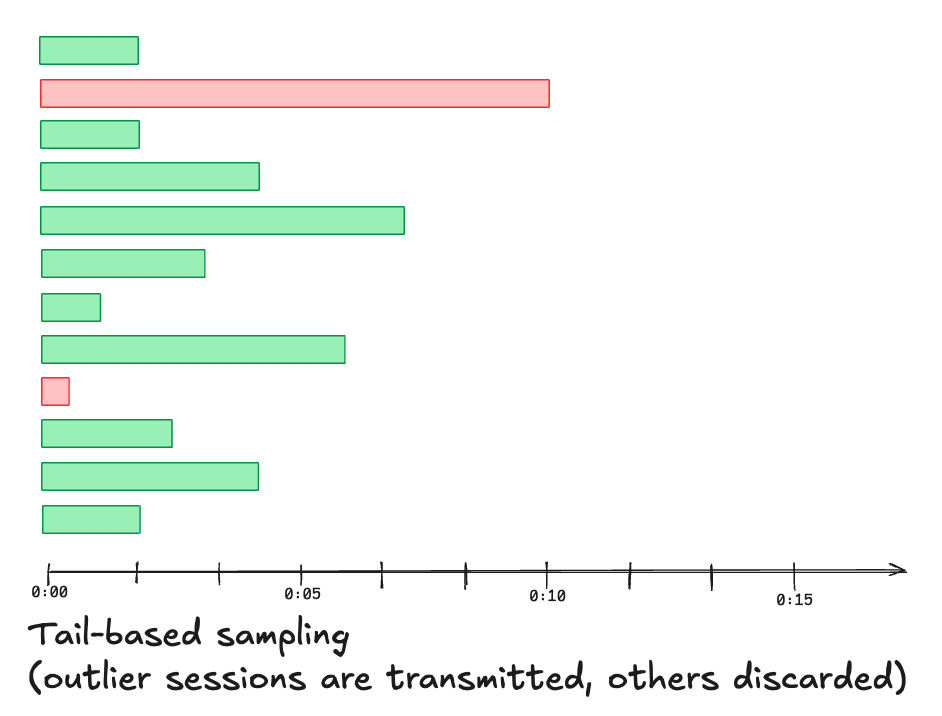
Since it is impractical to store every click, scroll, action, and web response for each user, real RUM implementations generally involve some form of sampling. This has some notable drawbacks:- If you’re sampling only after data storage, the data lake model mentioned above, it means the vast majority of data that you paid to transmit, and process, is getting thrown away relatively soon. Further if your RUM monitoring slows down the user experience at all, it does so for everyone.
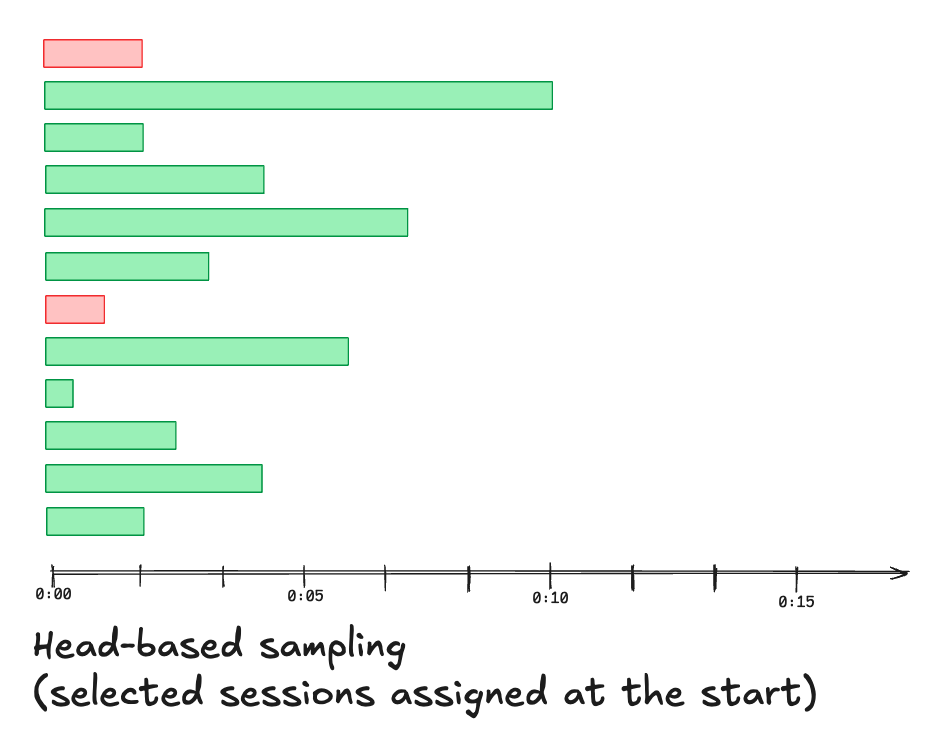
- With random sampling, the chance that a specific user report won’t have RUM data available starts to increase
Another kind of sampling problem: the level of RUM measurement
A key recommendation for monitoring with RUM is to start small: observe overall page load times and errors in the browser, send that data, and build from there. Eventually though we’d like to monitor lots of things about the user session: what’s being loaded, requested, what’s happening in the background, what third party plugins are doing, etc. But by implementing all this added instrumentation it’s unavoidable that we end up slowing down the user experience the more we want to observe. Since some of the most concerning user sessions are those that end either in an app crash or the user exiting the page or service, it’s further tempting to have RUM data report frequently during the user session. This may be a necessary step to ensure the most troublesome traces are sent, at least partially, but it further adds to the network overhead. In the end both in trace detail and number of sessions traced, RUM monitoring by its nature is limited in how closely it can observe all users.Conclusions: RUM is about aggregate performance, not high resolution
Given the concerns about RUM in practice, it rarely succeeds in delivering the promise of detailed data on every user session. If a sales rep were to call and say: ”Jeff Roberts was logging in to view his photos yesterday and all his photos showed error messages, what happened?” It’s unlikely that Real User Monitoring, as it works in the real world, would be able to provide an answer. Does that mean that we shouldn’t bother with real user monitoring? No, RUM is a core part of monitoring your service, but it’s more about trends and collective observation than high resolution tracing. Consider questions like:- What percentage of our users experience this error?
- When an image takes more than 8 seconds to load, how many users leave the page?
- What’s the request that’s taking up the most total user time (number of requests x time taken)?