

Before you begin
Before you begin
- Connect the Checkly MCP Server to your client.
- Use a client that supports MCP Apps, such as Claude Desktop. Support for MCP tools alone does not guarantee that a client can display interactive views.
- Allow the
checkly:checks:readsession permission and use an account role withchecks:readaccess.
Check status
Ask for a check card to see one check’s current status, type, tags, and availability and response-time percentiles over the last 24 hours, when available.Prompt

Check status card with sample data.
show-check-status. It shows aggregate metrics, without individual run history.
Check list
Ask for a check list to browse current status. You can filter by name, tag, check type, or passing, failing, and degraded status.Prompt
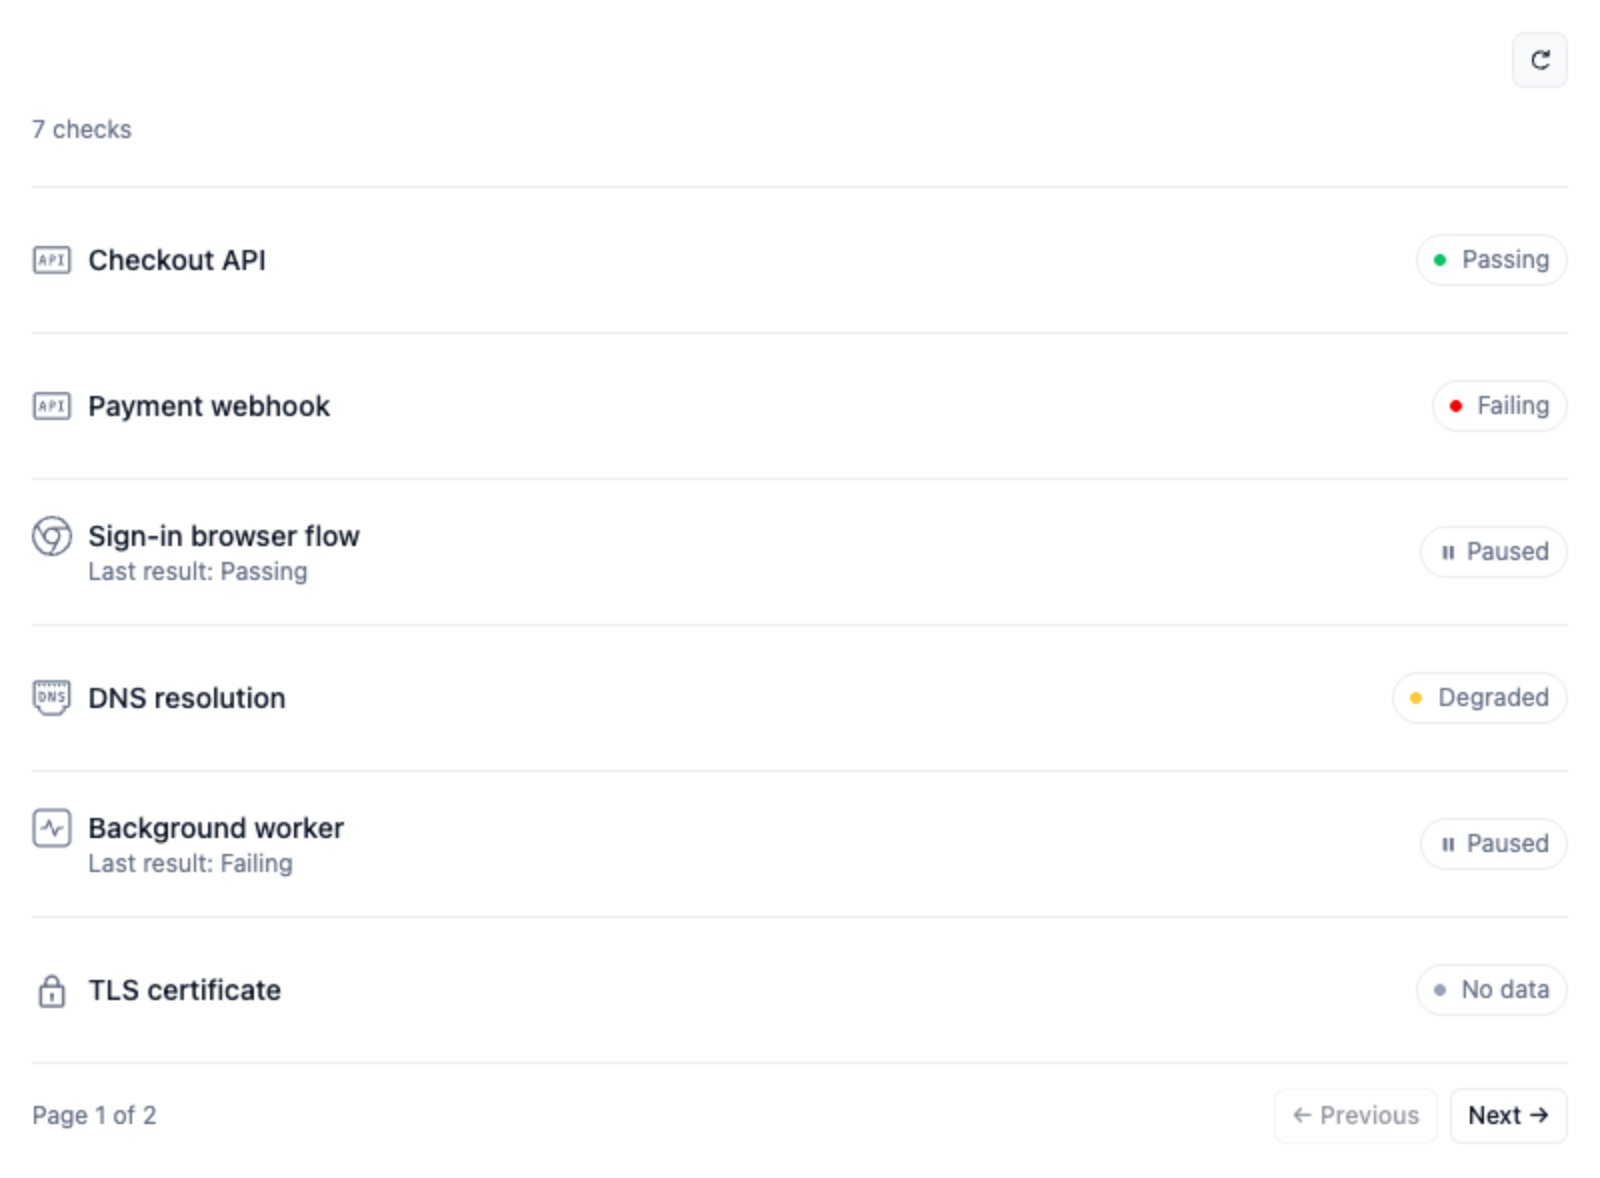
Paginated check list with sample data.
show-check-list and displays up to 20 checks per page. Use Previous and Next to browse more results. Pagination keeps your filters. The list shows current status without historical metrics.
Response-time chart
Ask for a chart to explore one check’s response times. The default time window is the last 24 hours.Prompt
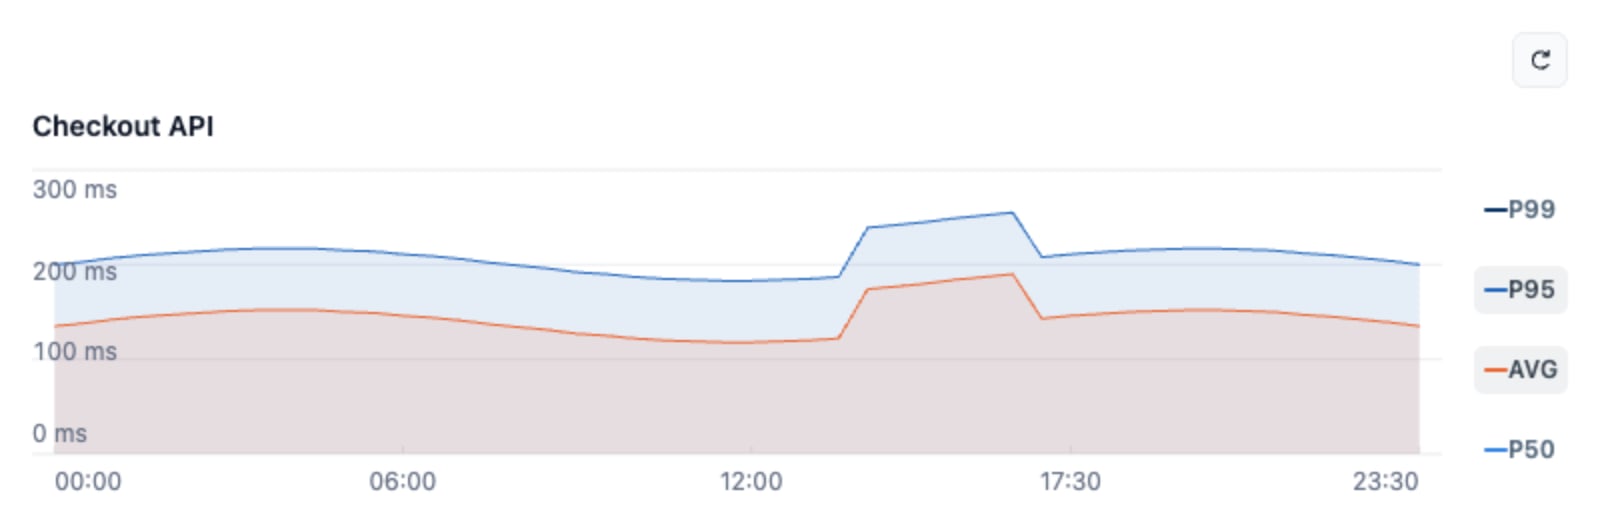
Response-time chart with sample data.
Prompt
show-check-response-time. Time windows must be in the past, span at most seven days, and fall within your plan’s data retention. Chart times use UTC, and periods without results appear as gaps.
Response-time charts are unavailable for Heartbeat, ICMP, traceroute, and SSL monitors.