

-
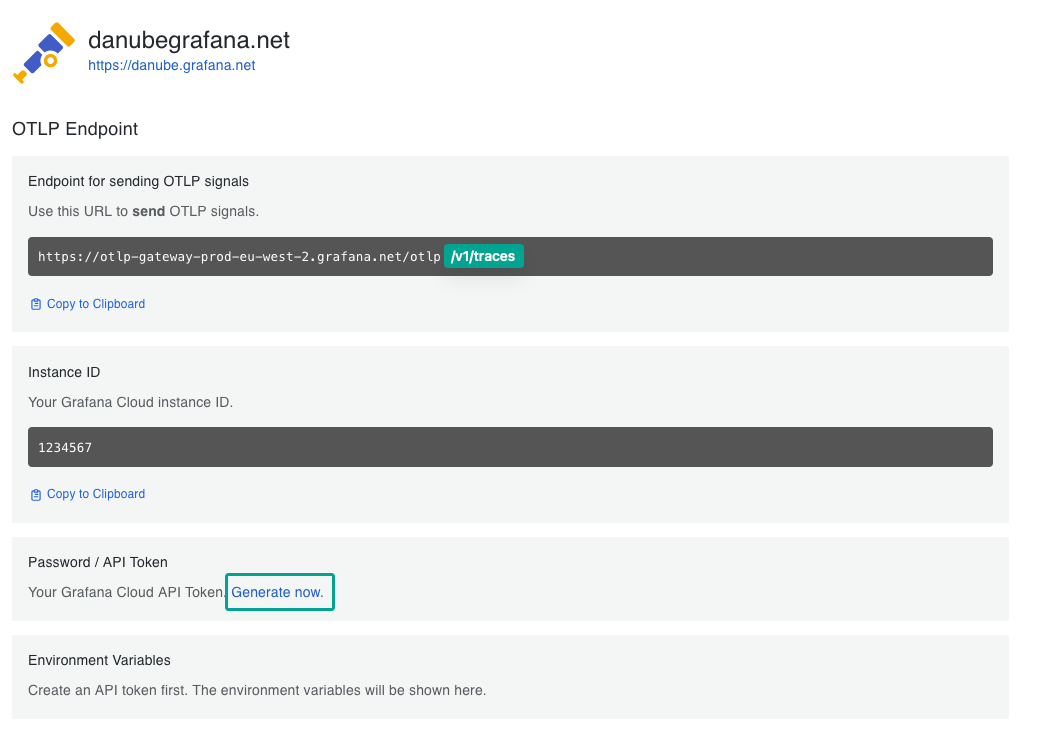
Get the endpoint. In the Grafana Cloud portal, open your stack, select the OpenTelemetry tile, then Configure. Copy the host from the tile instead of building it yourself, because it depends on your stack’s region. The Checkly URL ends in
/otlp/v1/traces, for examplehttps://otlp-gateway-prod-eu-west-2.grafana.net/otlp/v1/traces. Grafana rejects traces sent to<stack>.grafana.net/tempo.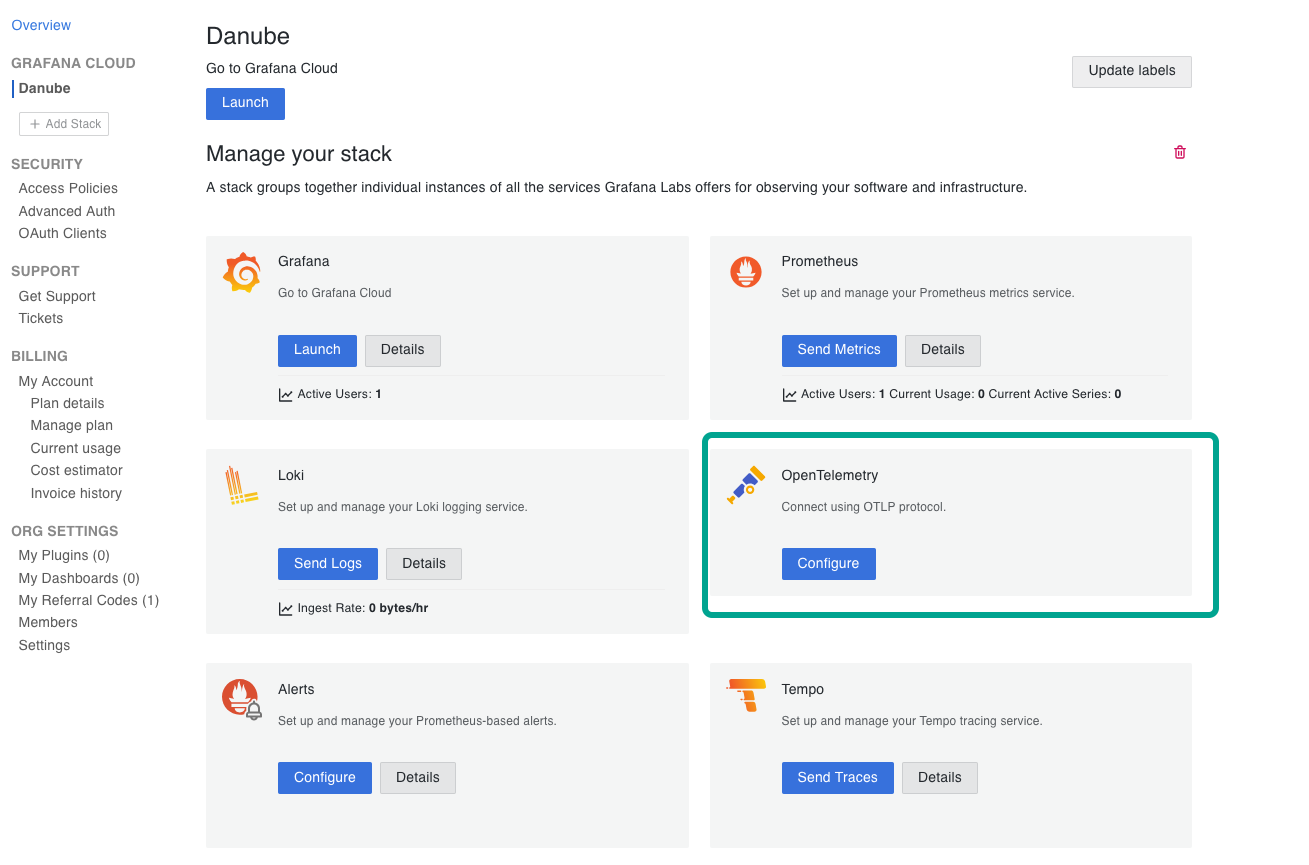
-
Get the key. On the same page, create a token with the
traces:writescope and copy your instance ID. Then base64 encode both on your own machine. The output must be one line without a trailing newline.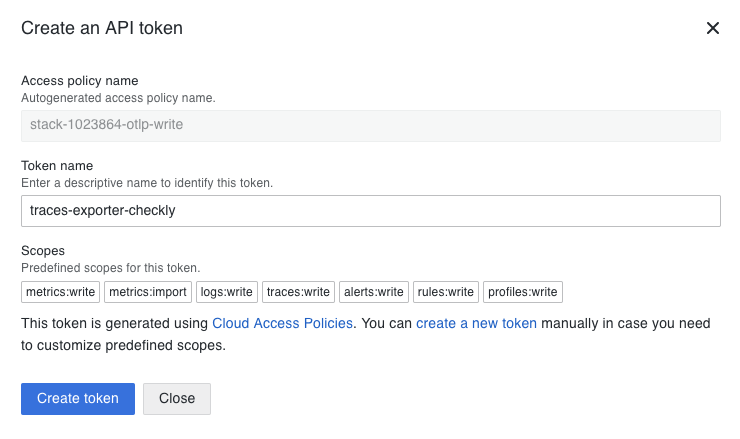
-
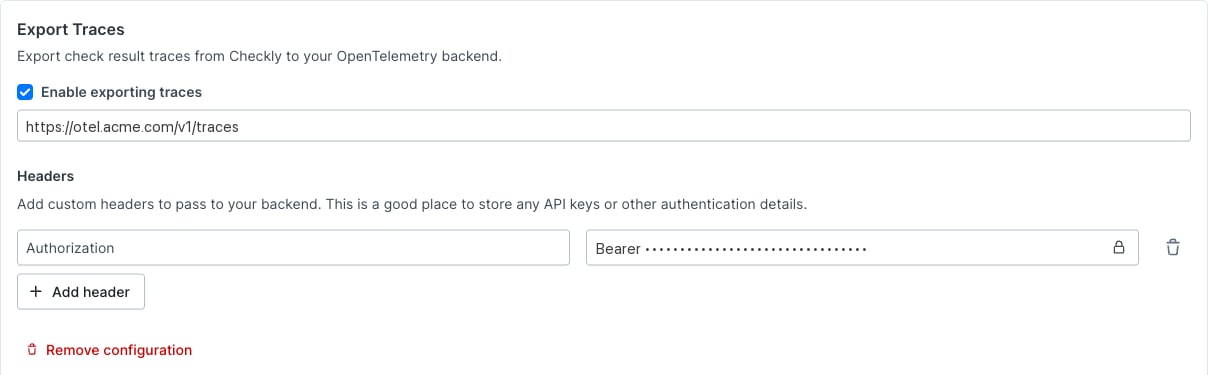
Paste the values into Checkly. On the Traces settings page, turn on Enable exporting traces, paste the URL, and add the header from the table below.
-
Find the spans. In Grafana, open Explore and select your stack’s traces data source, named
grafanacloud-<stack>-traces. The spans appear under servicecheckly.
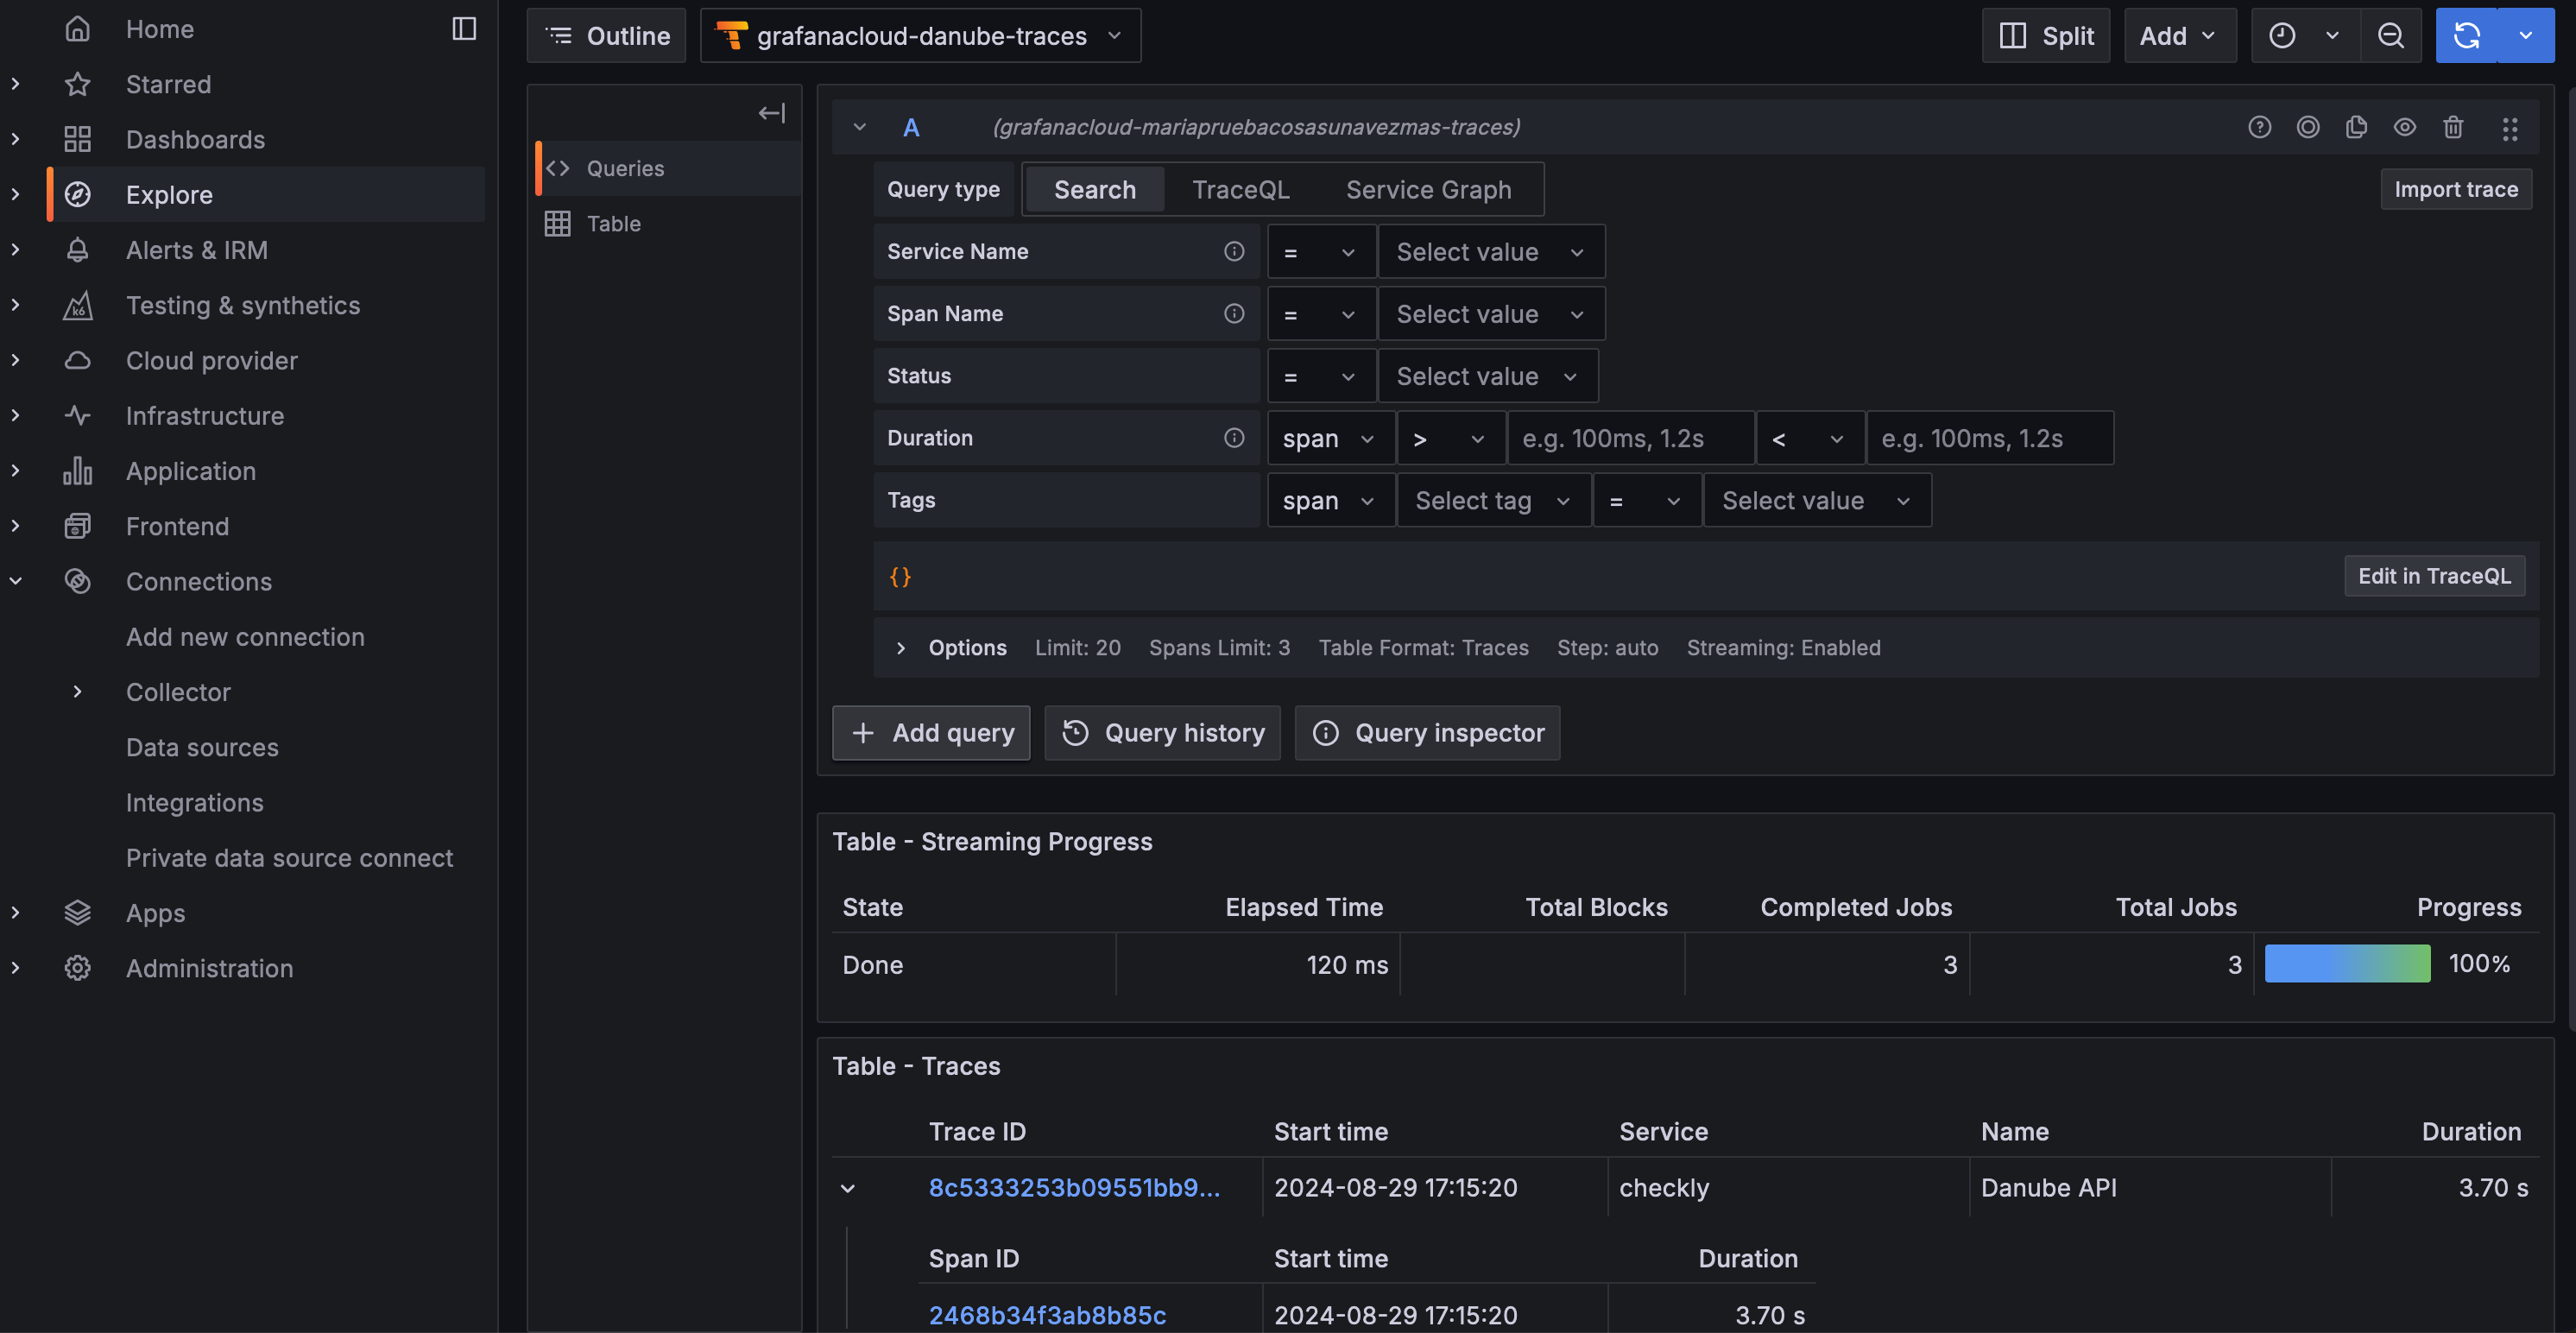
For self-hosted Tempo, use the OTLP export page with your distributor’s
/v1/traces URL.
Grafana documents the endpoint and token in Send data using OpenTelemetry Protocol.
To see failed runs, filter on the attribute checkly.check.status with the value FAILED.
The OTLP export page has the span schema.