Why isn’t logging fully supported in so many OTel SDKs?
Taking a look at the ‘Language APIs and SDKs’ section of the OpenTelemetry documentation, and you’ll discover something odd or even concerning, many languages don’t have full logging support!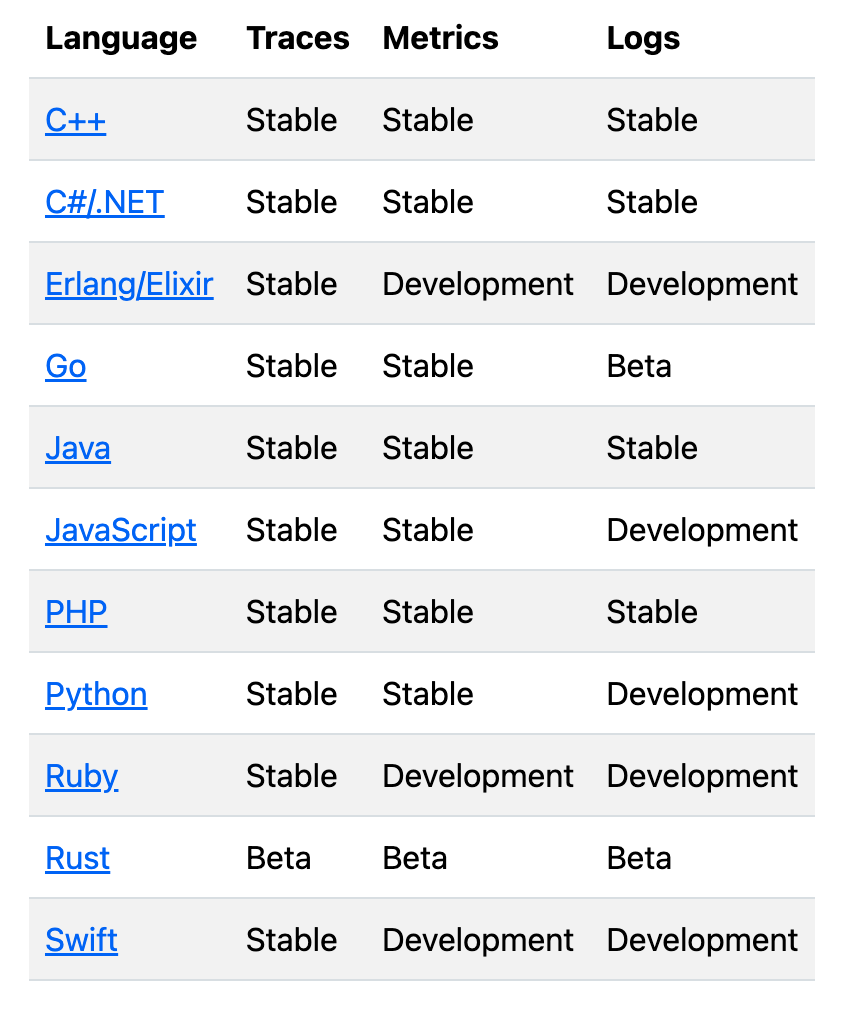
OpenTelemetry and Structured Logging
When you send logs from traces or events, you could just write raw text. But raw logs are hard to read and parse later. OpenTelemetry prefers structured logging instead. Structured logging is a best practice recommended by AWS and other cloud providers as well, since even a simple search of past logs can become prohibitively expensive if you’reWhat is Structured Logging?
Structured logging means logs are saved in a clear, machine-readable format—like JSON—instead of plain text. Each log has:- Fields (key-value pairs) for details like timestamps, severity, and context.
- Consistent formatting, making logs easier to search, filter, and analyze.
Why OpenTelemetry Uses Structured Logs
- Better for Machines – Tools can automatically process logs without messy parsing.
- Connects to Traces – Logs can link to traces and spans, helping debug issues faster.
- Standardized – OTel defines a common schema so logs work across different systems.
How OTel Handles Logs
- Log Records include:
- Timestamp
- Severity (e.g., ERROR, INFO)
- Message body
- Attributes (extra context like
user_id)
- Integration with traces and metrics for full observability.
Example (Structured vs. Raw)
Raw (Hard to Parse):"Error: User login failed"
Structured (Easy to Use):
Even in logging, cardinality explosion is possible
When asking for advice from a senior engineer on labelling new entries into logging with structured labels, and deriving metrics from logs, she replied: If you turn high-cardinality fields (likeuser_ip) into metric labels, you’ll create thousands of unique time series. 💥 Boom—metrics get huge, slow, and expensive!
✅ Structured logs are safer—you don’t have to predefine every possible label combo. Just extract metrics after filtering/aggregating logs (e.g., count errors by error_type, not by user_id).
🔥 Why? Every unique label combination:
- Becomes a separate metric line 📈
- Lives in memory (your app + Prometheus) ��
- Slows down scrapes & garbage collection 🐌
The Promise of OpenTelemetry Logging: Full Context on Every Line
The Problem with Traditional Logging
Today, logs, traces, and metrics live in separate worlds. They use different tools, formats, and collection methods, making it hard to connect them.- Weak links between signals – Logs might have timestamps or vague tags, but they don’t truly connect to traces or metrics.
- No shared context – In distributed systems, logs from different services don’t automatically tie together.
- Manual, messy correlation – You often stitch things together using timestamps or guesswork.
OpenTelemetry’s Solution: Built-in Context
OpenTelemetry (OTel) fixes this by propagating full context in every log line.- Traces + logs = best friends – Each log carries trace and span IDs, so you can jump from a log to the exact trace (and vice versa).
- Consistent metadata – Kubernetes pod info, service names, and other attributes are added automatically by the OTel Collector—no manual tagging needed.
- Distributed systems just work – Logs from different services share the same context, so you can follow a request across your entire system.
How It Works
- Structured logs – Logs follow OTel’s data model (like JSON with clear fields).
- Automatic enrichment – The OTel Collector adds context (e.g.,
k8s.pod.name) to logs, traces, and metrics the same way. - No re-engineering of existing libraries – Works with existing logging libraries (Log4j, Logback, etc.) via bridges.
Why This Matters
- No more guessing – Every log line knows exactly where it came from and how it fits into the bigger picture.
- Better debugging – Jump from a log error directly to the trace, metrics, and related logs—no manual searching.
- Future-proof – Even legacy apps can join the OTel ecosystem via the Collector.
The Promise, not yet fulfilled
OpenTelemetry promises to turn logs from isolated snippets into fully connected observability data. As noted above, not every language SDK has full logging support, meaning this isn’t completely possible now. And the addition of enrichment data isn’t an easy or automatic process at the collector level (the collector is stateless and can only enrich logs based on what it’s processing at that moment). However, logging with OpenTelemetry has a bright future, and adopting now means you’re likely to be producing highly valuable logs in the next few years that prove worth the effort.The Collector: OpenTelemetry’s Super-Powered Logging Proxy
The Problem with Legacy Log Collection
Most apps today log to files or stdout—simple, but messy. To get those logs into observability tools, you need:- Parsers (for JSON, CSV, plain text, etc.)
- Log tailing (handling rotation, partial reads)
- Enrichment (adding metadata like
trace_id)
Enter the OpenTelemetry Collector 🦸
The Collector acts as a universal log processor. It can:- Read logs from files/stdout – No app changes needed.
- Auto-add context – Injects
trace_id, Kubernetes labels, and more. - Convert to OTLP – Sends logs in OpenTelemetry’s clean, structured format.
Two Ways to Use It
Option 1: File/Stdout → Collector (No Code Changes)
- How it works: The Collector tails log files, parses them, and adds context.
- Good for: Legacy apps, third-party software.
- Tradeoff: Parsing can be tricky if log formats are inconsistent.
Option 2: App → Collector (Direct OTLP)
- How it works: Use an OTel “log appender” (e.g., for Log4j) to send logs directly to the Collector.
- Good for: New apps or those you control.
- Why? No file parsing, no lost logs on crashes, full structured data.
The Best Part: Zero Manual Enrichment
No more editing everylog.info() call! The Collector handles:
- Trace context (auto-injects
trace_id/span_id) - Resource attributes (like
k8s.pod.name) - Routing (send logs to Loki, Splunk, etc.)
Why This Wins
- No more “log soup” – Every log line has rich, queryable fields.
- Correlation just works – Logs link to traces automatically.
- One tool to rule them all – Same Collector works for logs, traces, and metrics.