What is Context?
In OpenTelemetry, context is the information that flows through your system with each request. It carries important details like:- Trace IDs (to connect all operations in a request)
- Baggage (custom key-value pairs you want to pass along)
- Other metadata needed for observability
Why Context Matters
As mentioned above, modern architectures are complicated. Many outages and other incidents end with engineers examining the logs from a single service, but to get real insight into how requests are processed by your system as a whole, you need context. Without context:- Logs, traces, and metrics can’t be connected
- You lose visibility in distributed systems
- Debugging becomes much harder
How Propagation Works
- Injection: When a request starts, the context (trace ID, etc.) gets added to headers
- Extraction: When another service receives the request, it pulls the context from headers
- Passing Along: The context continues flowing through all services in the request
The Standards Behind It
OpenTelemetry uses the W3C Trace Context standard (traceparent header) for compatibility. This means:- Works across different languages and frameworks
- Supported by many observability tools
- Ensures consistent behavior everywhere
Key Components
- Context API: Stores and manages the current context
- Propagators: Handle injecting/extracting context (usually from HTTP headers)
- Baggage: Lets you add custom data that travels with the trace
In Practice
When Service A calls Service B:- Service A adds trace context to the request headers
- Service B reads those headers to continue the trace
- All spans from both services connect automatically
Why This is Powerful
- No manual correlation needed
- Works across any protocol (HTTP, gRPC, queues, etc.)
- Enables complete observability of distributed transactions
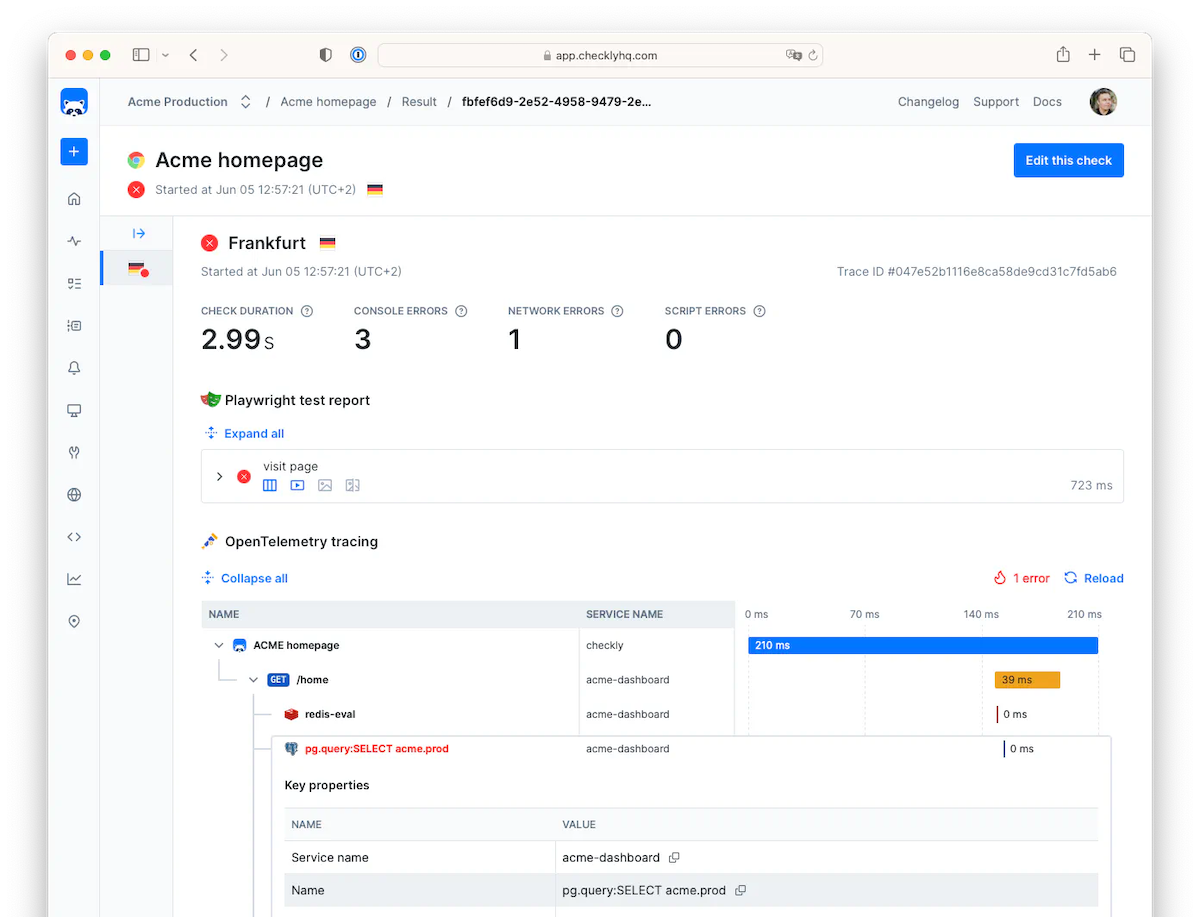
How Context Propagation Unlocks Efficient Monitoring: Checkly Traces
At Checkly, we had a problem. We wanted to let our users connect data on the backend performance of their application when handling requests sent by Checkly as part of synthetic user monitoring. For example, if a single postgres query was taking a long time and slowing down one type of user request, we wanted to see what request had taken so long. But we didn’t want to send large amounts of unnecessary data, using up user’s bandwidth and resources. To continue the analogy, we only wanted to send the postgres query data for our specific test request, not all postgres query performance from everywhere. With OpenTelemetry context propagation, this proved feature was easy to implement, and performs well.How it works: Context Propagation and Checkly Traces
- A user configures their Checkly test service to send requests with an additional header, marking this request as coming from Checkly
- The user adds a few lines of configuration to their OTel Collector, to send on relevant traces
- The service, instrumented with OpenTelemetry libraries, sees the header and passes it on between services
- When reporting a trace to the OpenTelemetry Collector, if the trace has the Checkly header, it’s sent on to Checkly
- Checkly’s reports on check results now have backend data, having sent only relevant traces to the Checkly server
Conclusions: OpenTelemetry Context Propagation is Fundamental to Observability
Context propagation turns separate service logs into complete traces. It’s what makes modern observability possible. As systems grow more complex, this simple way of connecting services becomes essential for:- Faster debugging
- Better performance tuning
- Understanding real user experiences