- URL Monitors
- TCP Monitors
- Heartbeat Monitors
URL Monitors
While Synthetic Monitoring can simulate complex user behaviors in a browser and alert you if performance or functionality degrades, Uptime Monitoring excels at continous validation that URLs and Services are available. URL monitoring sends high-frequency requests and can alert you of failures within seconds. This can be useful for monitoring your homepage, landing pages, product pages, and even blog and docs. Our scalable, affordable approach of implementing monitors as code makes Checkly perfect for applying blanketed monitor coverage across your entire digitial footprint. It’s easy to create a URL Monitor from your IDE with Checkly CLI, just create a check file in your project with theURLMonitor type:
UptimeMonitoring.check.ts
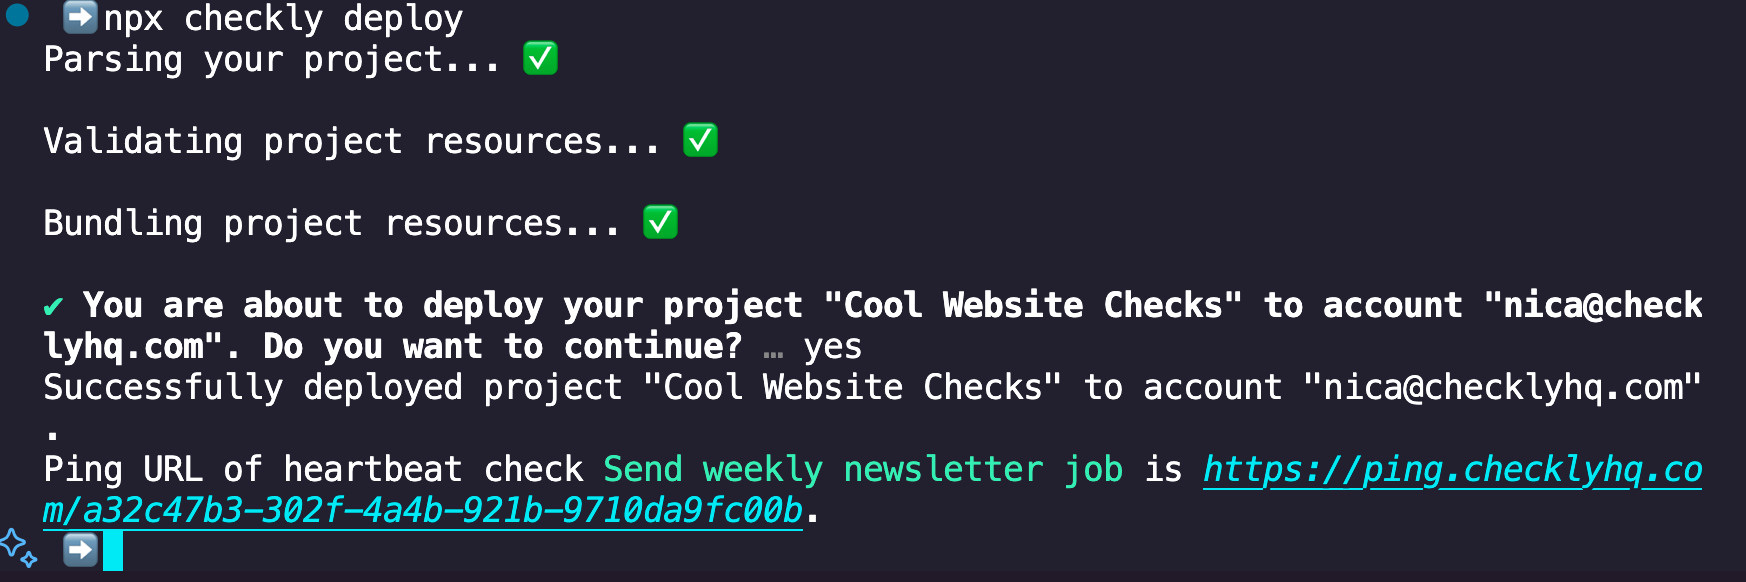
npx checkly deploy command.
Along with monitoring your own services, both URL monitors and synthetics checks can monitor third party services. With the high frequency and low cost of URL monitors, they’re an easy way to ensure the services you rely on are up and running.
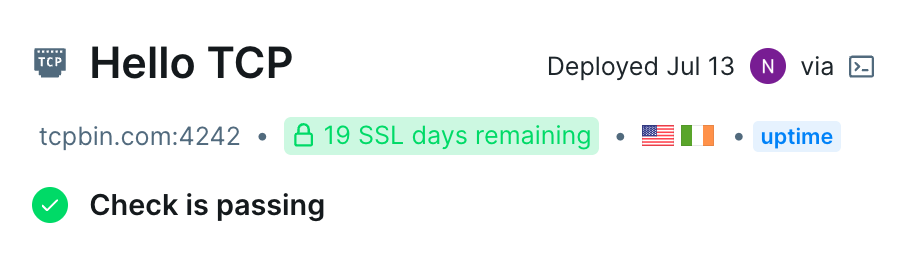
TCP requests for TCP services
While URL checks will send regular HTTP requests, we all still have services that will only respond to TCP requests, for example mail services and ftp services. For these there’s TCP checks. Just like the other checks in this guide, you can create monitors from your IDE with Monitoring as code. Here’s an example:UptimeMonitoring.check.ts
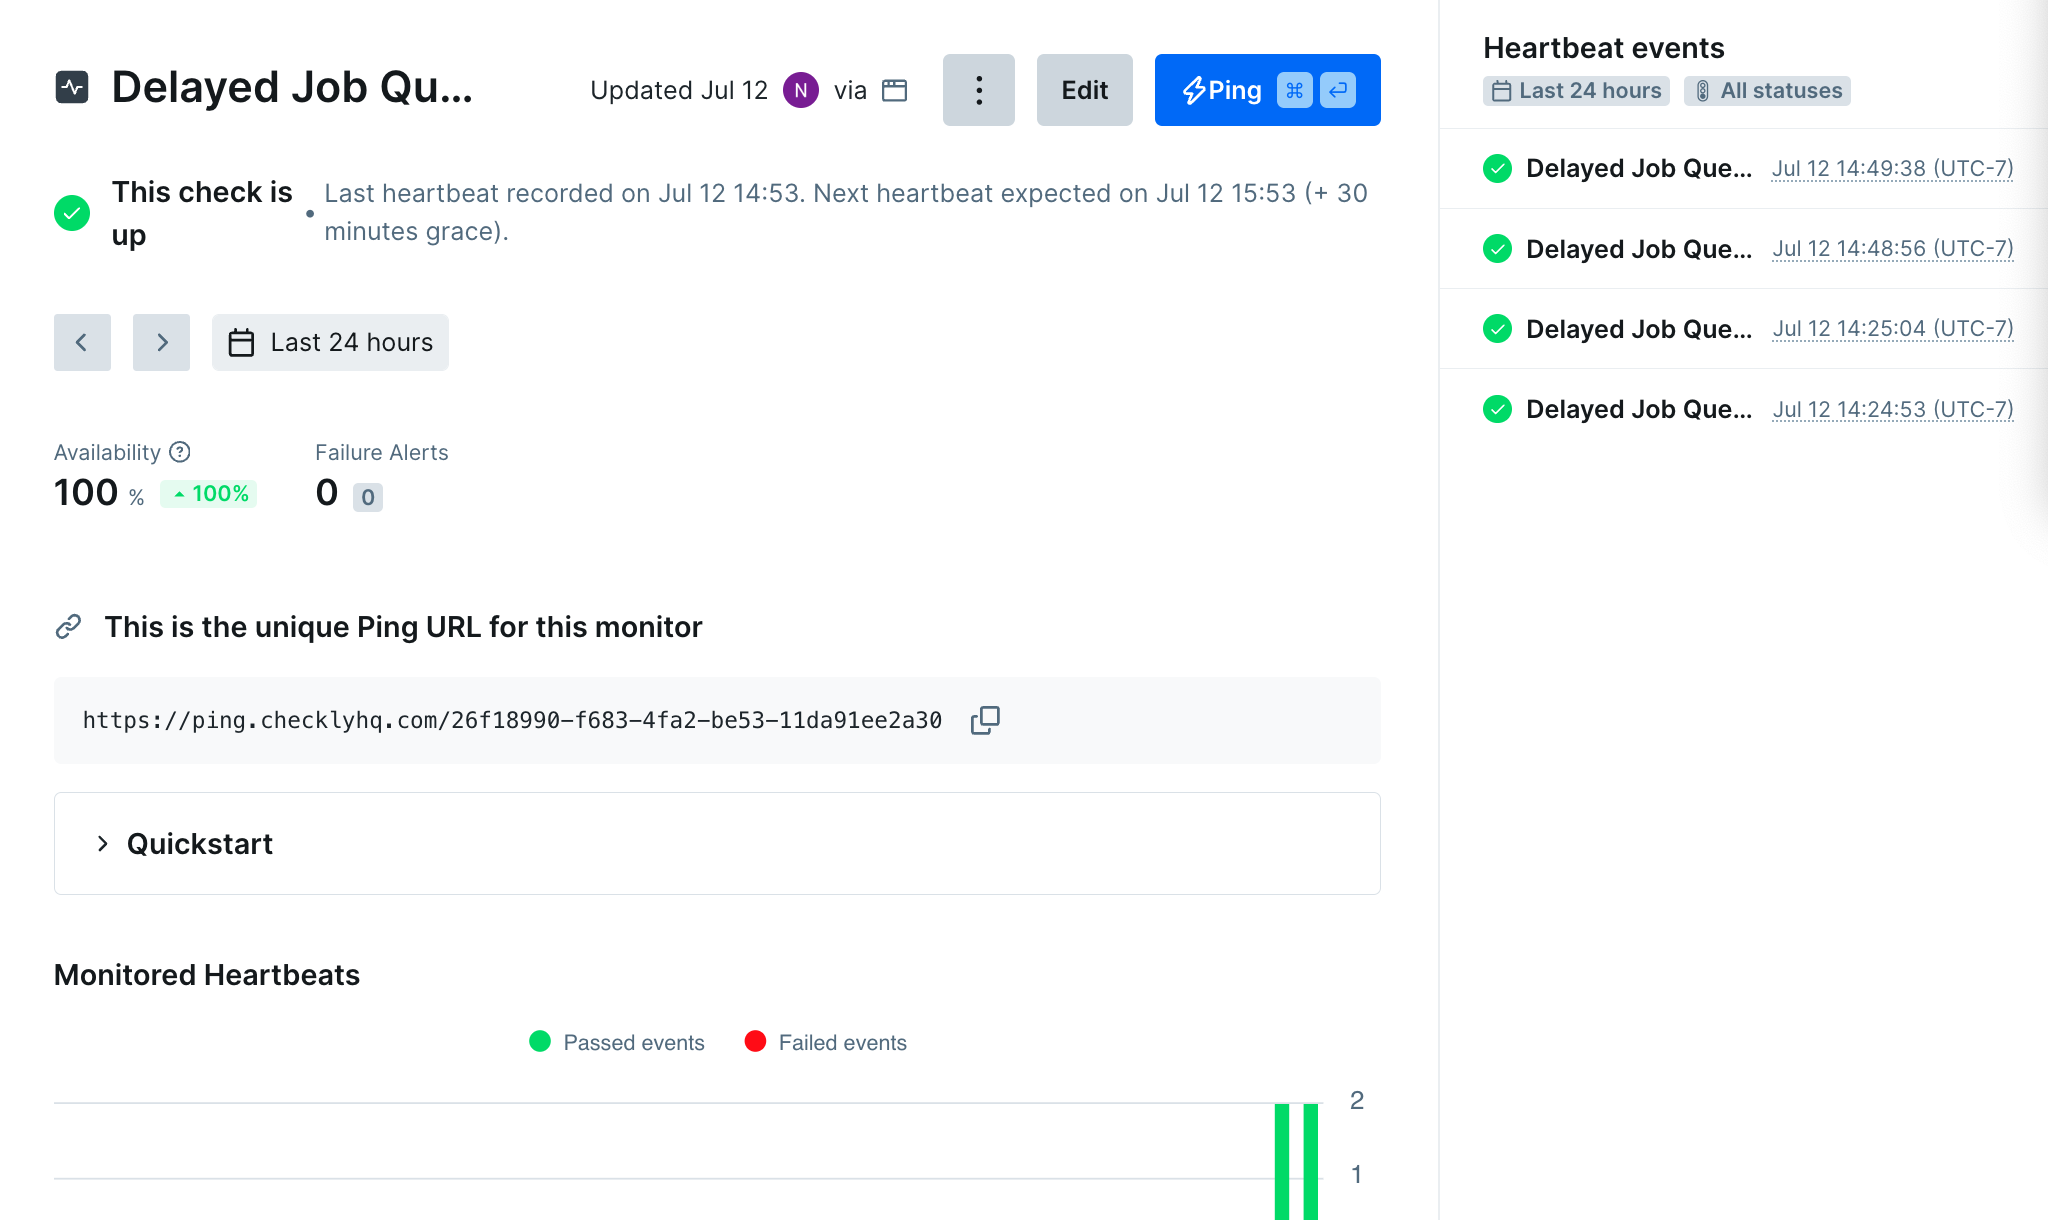
The Heartbeat Monitor, for services that don’t accept incoming requests
Another type of service you’ll want to monitor is one that doesn’t accept any kind of incoming requests. There’s really not much to getting one to work, just set up a heartbeat in the Checkly UI or with the Checkly CLI. For example, the following codeUptimeMonitoring.check.ts
hearbeatDemo.check.ts to your project file, you can create this check with npx checkly deploy