From alerts to root causes: the big leap
Not every team will have the depth of Checkly’s synthetic monitoring to watch every common user path and test any critical interaction with a site and its API.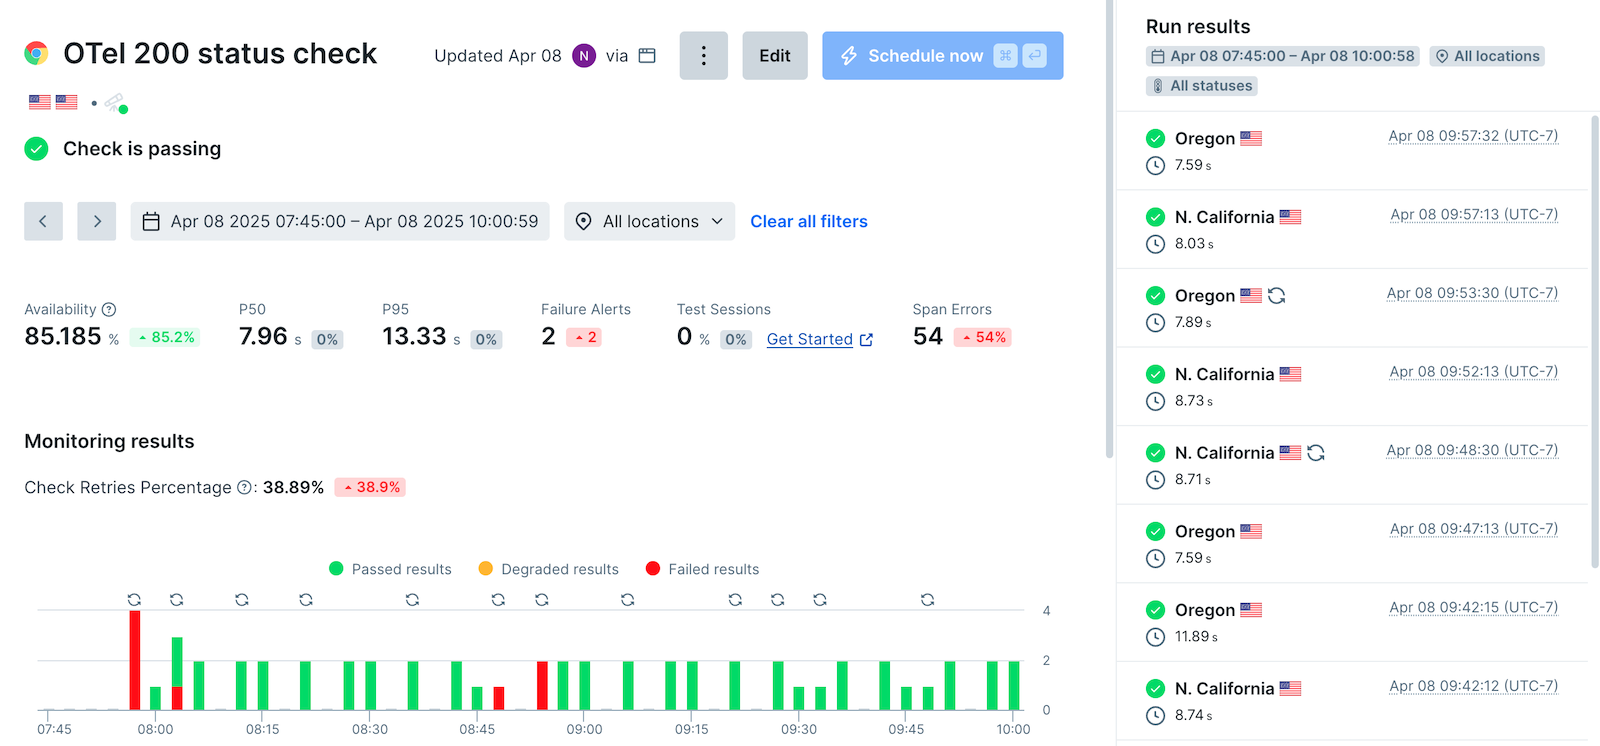

Key Improvements in Modern RCA:
- Automated Correlation – With distributed tracing and context propagation, we shouldn’t be trying to line up time codes to correlate observability data from multiple services
- Context-Aware Alerts – Alerts prioritize issues impacting business metrics (like checkout errors vs. low-severity logs). Sophisticated routing and status updates on tools like Rootly mean only the right team members get woken up during incidents.
- Proactive Detection – Once solely used for end-to-end testing, synthetic user testing is now available to development and operations teams. Any activity frequently performed by users can be performed in automatic test sessions with deep assertions to make sure the responses look correct.
Example:
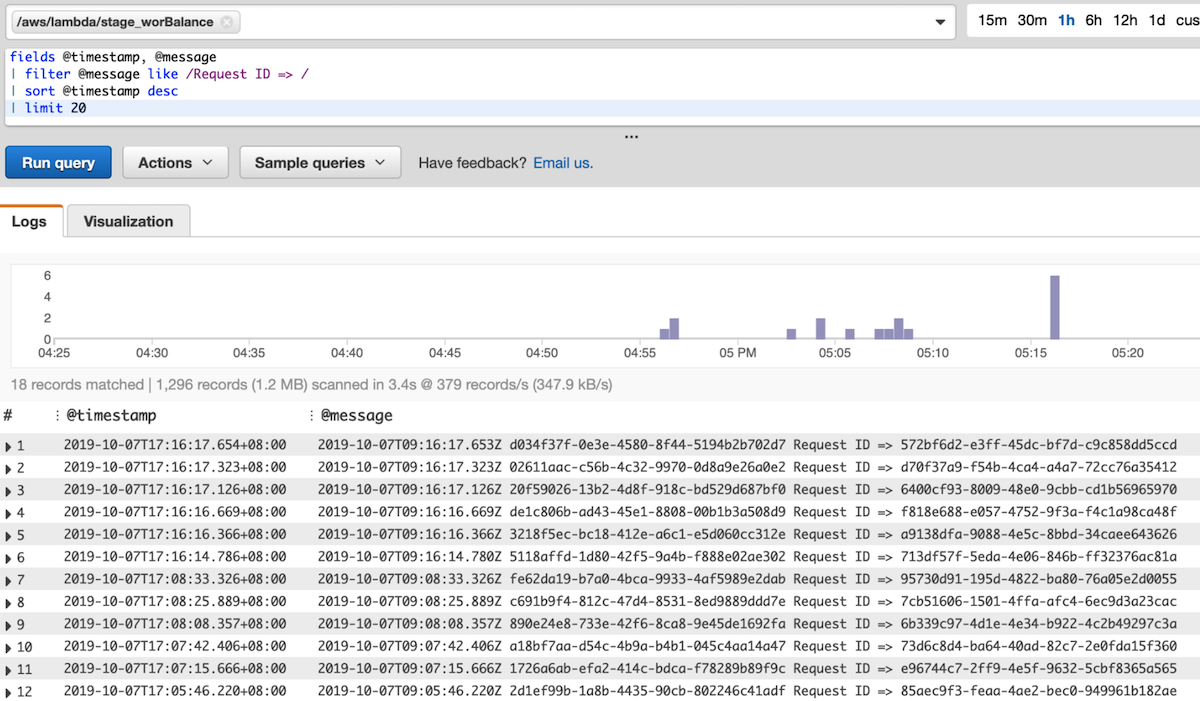
A payment service fails intermittently. Traditional RCA might check logs in isolation, wasting hours. With modern observability tools:- Metrics show elevated error rates.
- Traces reveal timeouts between checkout and fraud-detection microservices.
- Logs highlight a third-party API throttling connections.
- Dashboards correlate this with a recent deployment, suggesting a rollback.
Tools for Effective RCA:
- OpenTelemetry (unified data collection for the back end)
- Prometheus/Grafana (metrics visualization)
- Jaeger (distributed tracing)
- Checkly (synthetic monitoring of the frontend, correlated with OpenTelemetry traces)
Conclusion
Modern root cause analysis is no longer about digging through logs. Today’s systems are too complex for old methods. But with the right tools—unified tracing, smart alerts, and synthetic checks—teams can find and fix issues fast. Instead of guessing, you get:- Connected data (logs, traces, metrics in one place)
- Clear paths (see how failures spread across services)
- Faster fixes (know what broke and why)