

Collection is on by default on all browsers. TBT and INP are available on Chromium and shown as a dash where unsupported.
Where Web Vitals appear
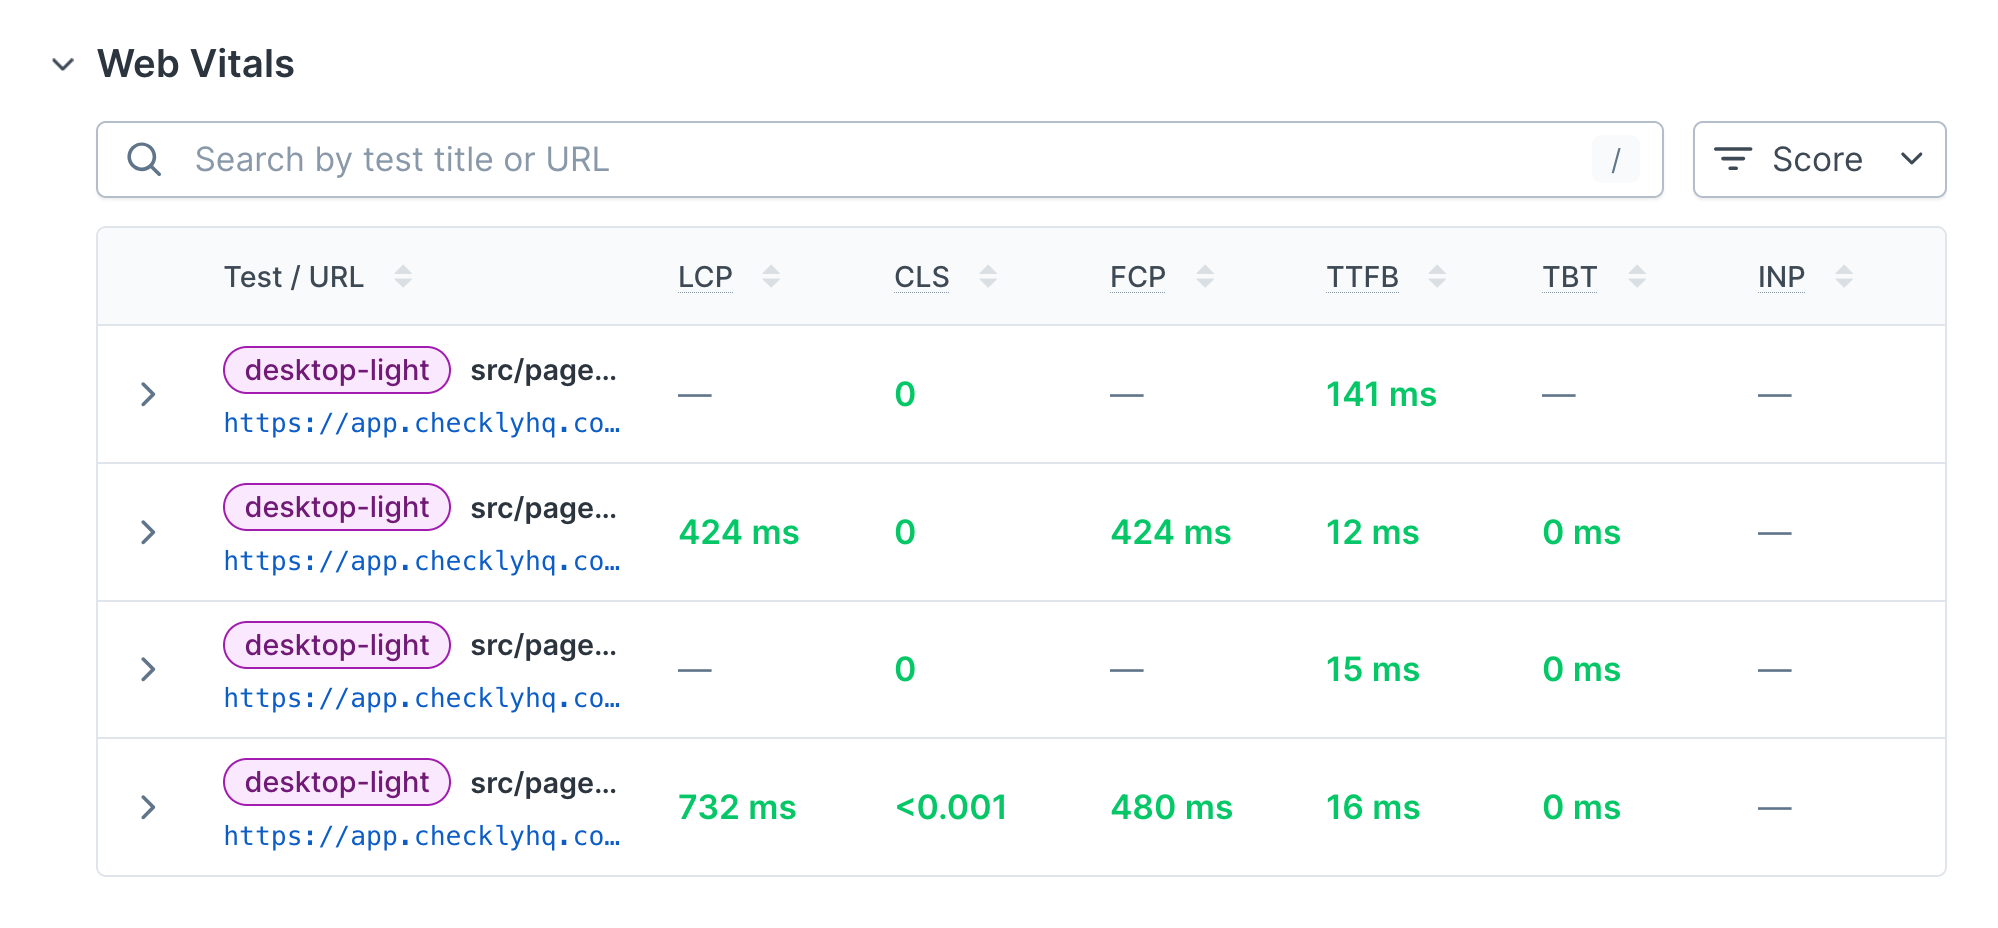
A single run can visit many pages across its tests, so Web Vitals are reported per page visit rather than once per check. You find them in two places:- The check result’s Performance tab, which lists every page visited across the run.
- Each test result’s Web Vitals section.
Web Vitals
For each page a test visits, Checkly collects six Web Vitals and scores each one good, needs improvement, or poor against the canonical web.dev thresholds.First Contentful Paint (FCP)
First Contentful Paint (FCP)
Initial Content Display
Measures the time from when the page starts loading to when any content is rendered. A large FCP means users see a white screen for too long, doubting whether the page works at all.Read more about FCP over at web.dev
Largest Contentful Paint (LCP)
Largest Contentful Paint (LCP)
Main Content Loading
Measures the time to render the largest visual item within the browser viewport. High LCP means users wait too long before the most useful part of your page loads.Read more about LCP over at web.dev
Cumulative Layout Shift (CLS)
Cumulative Layout Shift (CLS)
Visual Stability
An aggregate metric that signals screen elements “jumping around” as the page loads. Low CLS means you have a stable page layout.Read more about CLS over at web.dev
Total Blocking Time (TBT)
Total Blocking Time (TBT)
Main Thread Responsiveness
Reflects the time a web page is “blocked” from receiving user input because the main rendering thread is busy. High TBT means sluggish user interactions.Read more about TBT over at web.dev
Time to First Byte (TTFB)
Time to First Byte (TTFB)
Server Response Time
Indicates how long it took for your server to respond with the first byte of content. TTFB can vary based on location and network conditions.Read more about TTFB over at web.dev
Interaction to Next Paint (INP)
Interaction to Next Paint (INP)
Interaction Responsiveness
Measures how quickly the page responds to user interactions like clicks, taps, and key presses, from the input to the next frame painted. A high INP means interactions feel sluggish.Read more about INP over at web.dev
A metric can show a dash instead of a score. That is not an error. Some metrics only exist under certain conditions, for example a page your test never interacts with has no INP. INP also relies on the Event Timing API, which is well supported on Chromium and weaker on WebKit and Firefox.
What caused the LCP
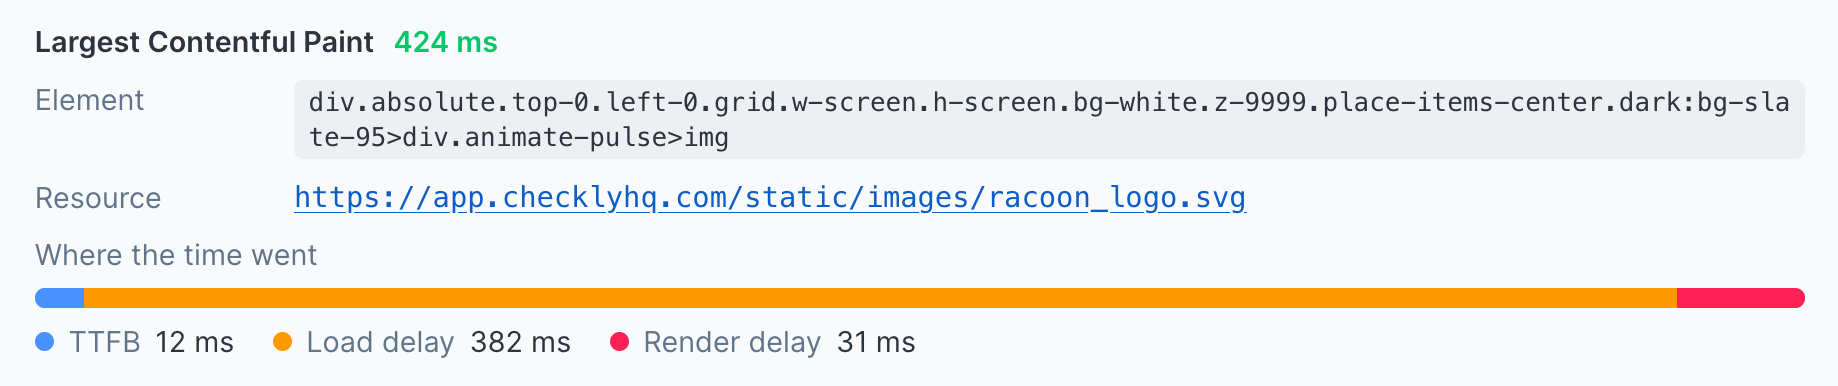
Expand a page visit to see what produced its Largest Contentful Paint and where the time went:- The element that painted, shown as a CSS selector you can paste into your browser devtools.
- The LCP resource, matched to the request in the trace’s network log so you can see its load time.
- A phase breakdown of the LCP time: time to first byte, then resource load delay, resource load time, and element render delay. For a text element the two resource phases are zero.
What caused the INP
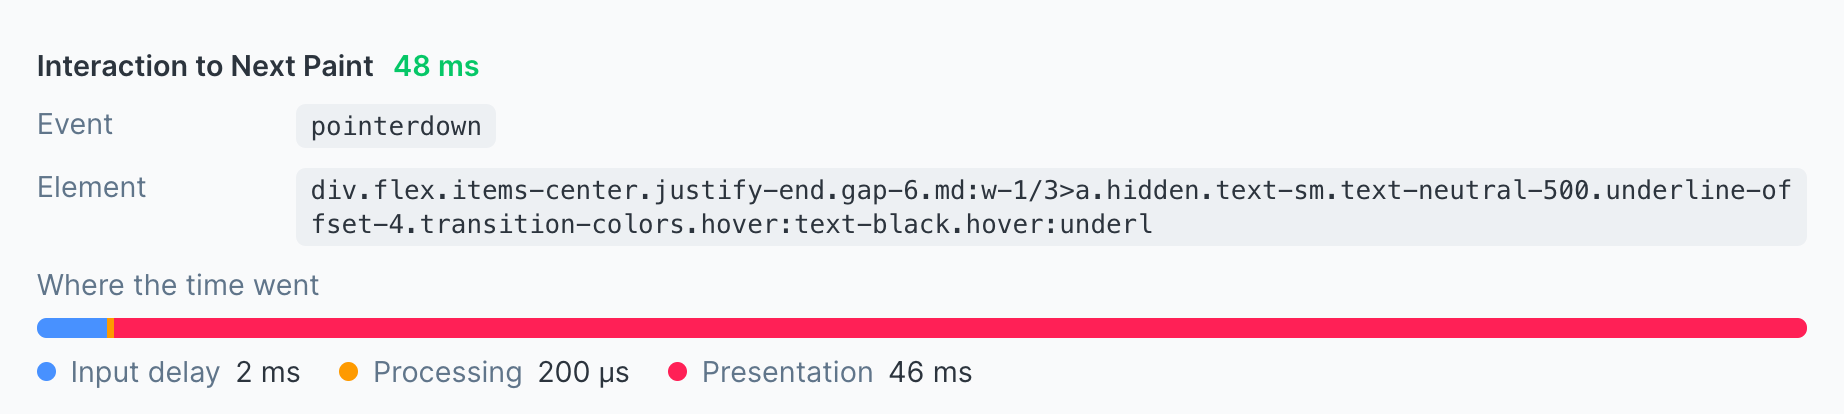
The same panel breaks down the page’s INP, its slowest interaction:- The element the user interacted with, as a CSS selector.
- The event type, such as
pointerdown,click, orkeydown. - A phase breakdown: input delay (time before your handlers run), processing (your handlers running), and presentation delay (time until the next frame paints).
Single-page apps and soft navigations
Core Web Vitals are measured per page load. A single-page app changes routes withhistory.pushState and no full reload, so to the browser it is still the same document, and the load metrics do not fire again for the new route.
Checkly reports these visits honestly rather than showing stale or misleading numbers. A page reached by a soft navigation is marked with a Soft nav badge, and:
- Its load metrics (LCP, FCP, TTFB) are blank. They describe a document load, not a client-side route change.
- CLS and TBT are also blank. They accumulate over the whole document and would be misleading pinned to a single route.
- INP is still reported. It is measured per visit, so an in-app route change keeps a real responsiveness signal, often the most useful number for that page.
A soft-nav row with mostly empty cells is intentional, not a failure to collect data. Read its INP, and the INP breakdown, for that route’s responsiveness.