Dashboard Overview
The reporting dashboard displays your first 15 checks with key performance metrics at a glance. Use this view to:- Quickly identify underperforming checks
- Monitor trends across your monitoring infrastructure
- Compare performance between different check types
- Spot patterns in success ratios and response times
Filtering and Sorting
Customize your view using the toolbar filters and sorting options:Date Range
Date Range
Select the time period for your analysis. The dashboard adjusts data granularity automatically based on your selection.
Check Filters
Check Filters
Filter by:
- Check Type: API, Browser, or Multistep checks
- Check Tags: Filter by tags applied to individual checks
- Check Group Tags: Filter by tags applied to check groups
Sorting Options
Sorting Options
Sort your results by:
- Name: Alphabetical order (ASC/DESC)
- Check Type: Group similar check types together (ASC/DESC)
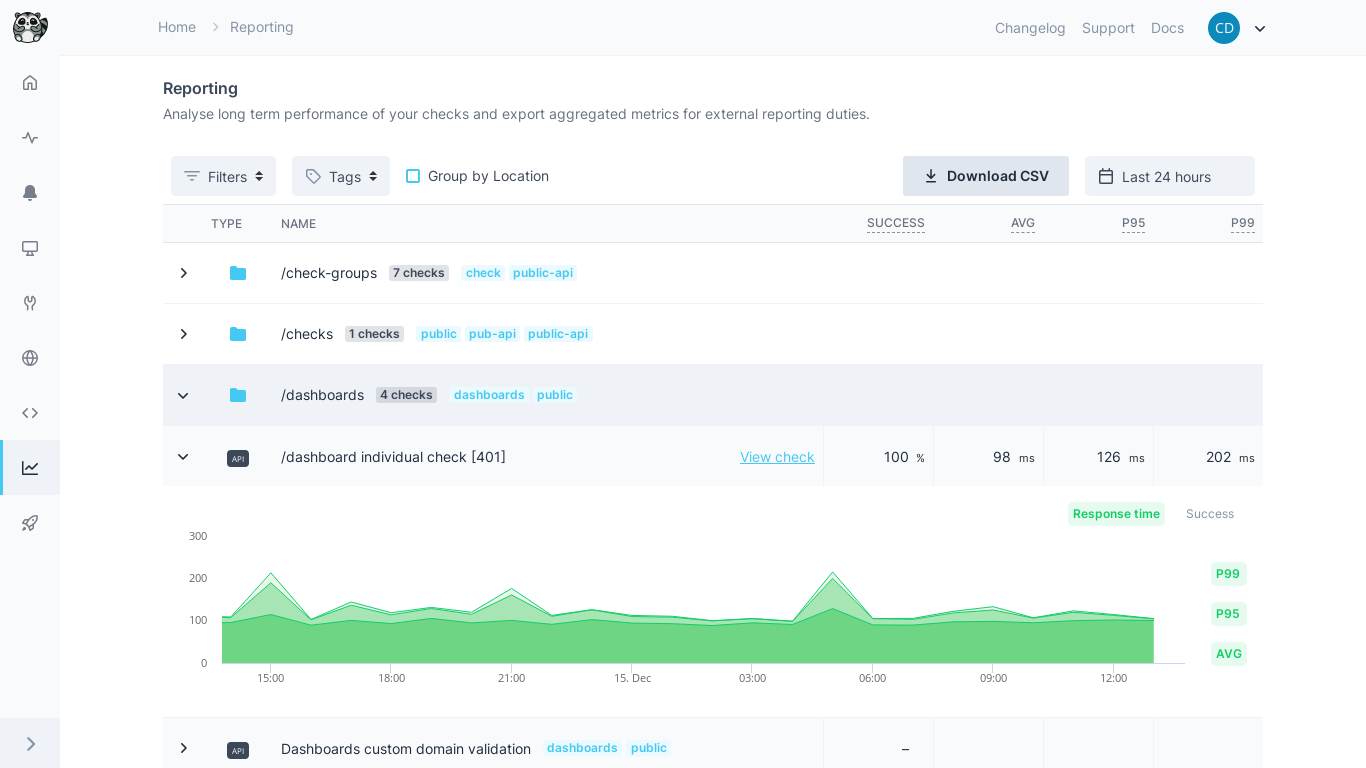
Performance Graphs
Click any check to view detailed performance graphs showing response times and success ratios over your selected time period.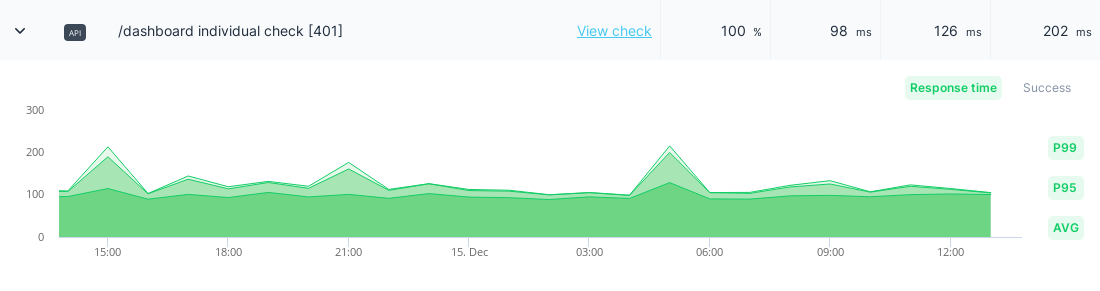
Graph Features
Response Time Metrics: Toggle between average, P95, and P99 response times using the metric pills beside the graph. Success Ratio: Track the percentage of successful check runs over time. Dynamic Granularity: Data grouping adjusts automatically based on your date range:| Date Range | Data Grouping |
|---|---|
| Up to 2 weeks | Hourly |
| Up to 6 months | Daily |
| Up to 24 months | Weekly |
| Up to 48 months | Monthly |
| Beyond 48 months | Yearly |
Data Export
Export your monitoring data for external analysis, reporting, or archival purposes.CSV Export Process
Export Data Fields
The CSV export includes the following columns:| Field | Description |
|---|---|
| Name | Check name for identification |
| Check ID | Unique identifier for the check |
| Check Type | API, Browser, or Multistep |
| Success Ratio | Percentage of successful runs |
| Response Time (Average) | Mean response time |
| Response Time (P95) | 95th percentile response time |
| Response Time (P99) | 99th percentile response time |
| Check Tags | Applied tags for categorization |
All statistics are calculated based on your selected date range. The default range is “Last 24 Hours”.
Best Practices
- Regular exports: Schedule periodic data exports for long-term trend analysis
- Filter strategically: Use tags and groups to create focused reports for different teams
- Monitor P95/P99: Don’t rely only on averages - percentiles reveal user experience reality
- Compare periods: Use date range filtering to compare performance before and after deployments