What is Distributed Tracing?
Distributed tracing tracks requests as they flow through your application’s services and infrastructure. It helps you:- Understand request flow across services
- Identify performance bottlenecks
- Debug failures and errors
- Optimize application performance
- Check results: resolve production outages faster by correlating failing checks with infrastructure traces.
- Test sessions: understand any failures during test session execution.
- Check editors: get a live trace while building, editing and debugging check code.
Getting Started with Checkly Traces
To get started with Checkly Traces using OpenTelemetry, pick the scenario that best fits your needs.I don't have an OpenTelemetry setup
Instrument your app and send traces directly to Checkly. No need for a 3rd party OTel backend.
I already have an OTEL Collector
Send your infrastructure traces to Checkly to get contextualized check failure analysis.
I want to export Check results to my OpenTelemetry setup
Export check results as traces to your 3rd party OTel tooling
Works hand-in-hand with Rocky AI
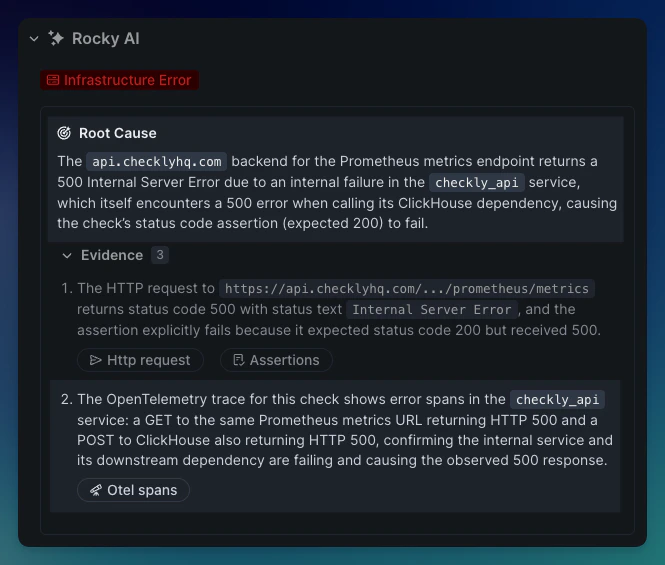
Checkly Traces automatically integrates with Rocky AI, helping you automatically analyze root causes of check failures. Rocky AI Root Cause Analysis can search, fetch and interpret Open Telemetry (OTeL) traces ingested by Checkly Traces and use it as a piece of “evidence” in determining why and where a check failed.A simple example. Your API or Playwright check fails with a 500 error. Luckily your backend is instrumented with Open Telemetry and sends a trace indicating an issue with a downstream database, 3rd party service, proxy etc. Now, Rocky AI automatically pulls these OTeL traces into its context window and correlates it with your failing check.
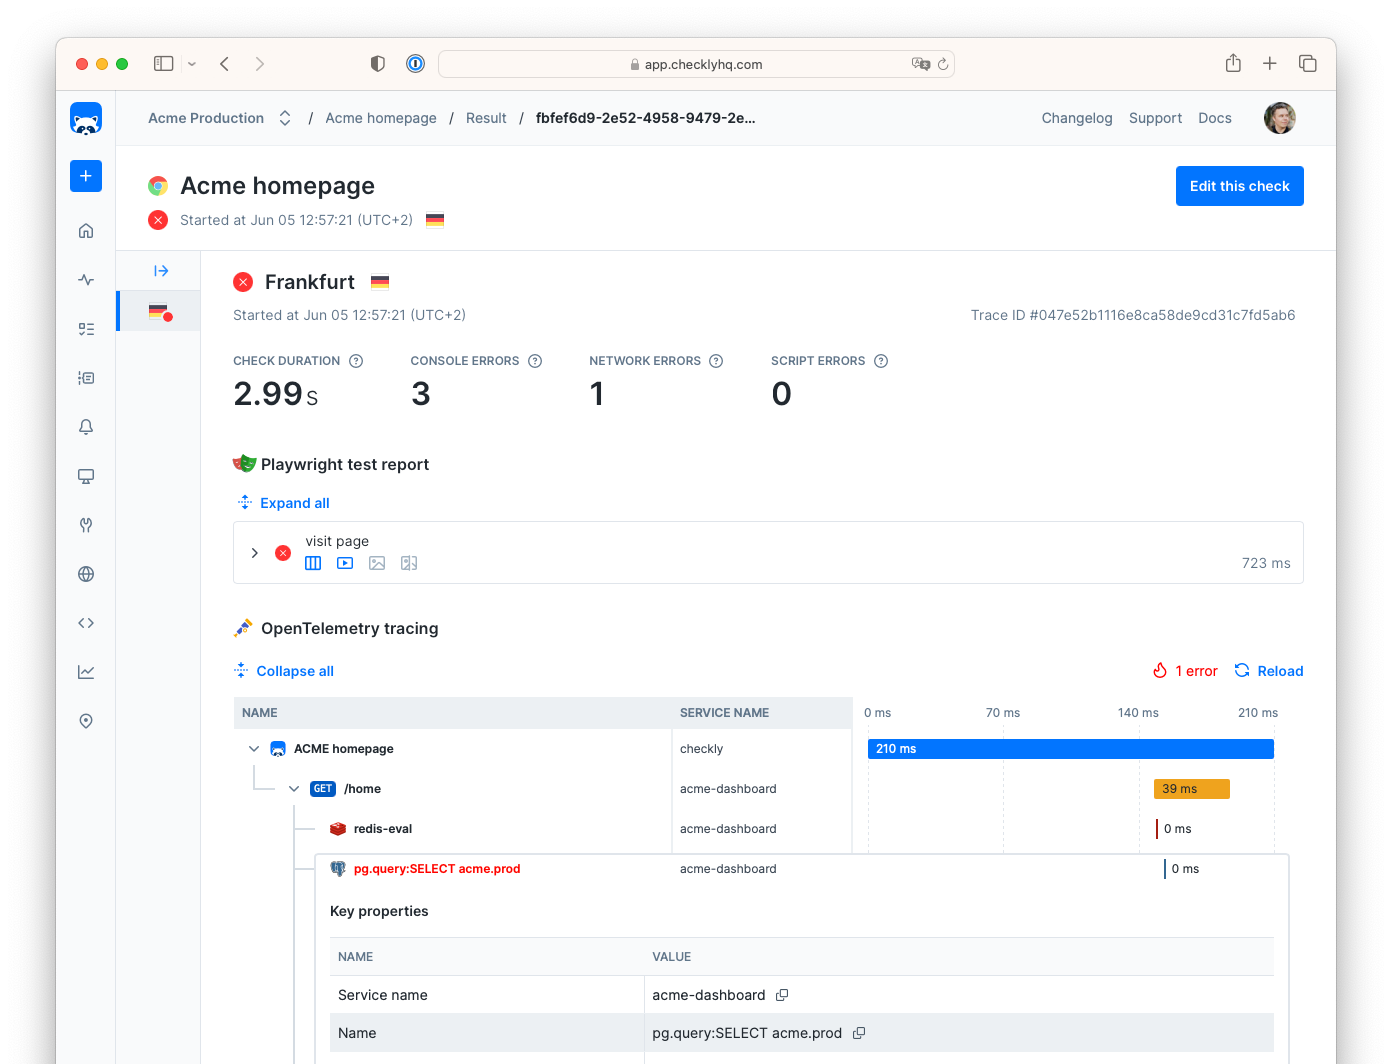
Here’s an actual example from Checkly’s own backend.
- Our API check that checks if our customer facing Prometheus endpoint works, failed with a 500 error.
- The OTeL trace indicates this was actually do to our Clickhouse server returning a 500 errors, immediately telling our on-call team where to start looking.
- Without the trace, we would have to look at all the various logging, error tracking and other tools that are integrated into the various middleware and infrastructure this request passes through (our load balancer, REST API server, Redis datastore etc.
Key Benefits
Cost-Effective Tracing
Cost-Effective Tracing
Only traces generated by Checkly checks are forwarded to third-party tools, significantly reducing data transfer costs while maintaining comprehensive monitoring coverage.
Unified Observability
Unified Observability
Combine synthetic monitoring data with application traces in your existing observability platform for a complete picture of system health.
Faster Debugging
Faster Debugging
When checks fail, trace data provides immediate context about what happened in your application stack, accelerating root cause analysis.
Seamless Integration
Seamless Integration
Works with existing OpenTelemetry instrumentation and popular observability platforms without requiring changes to your application logic.