

Basic Setup
Configure your ICMP monitor by specifying the target host:
- Hostname or IP address: The server you want to monitor (e.g.
db.example.comor203.0.113.1) - IP family: Choose between IPv4 (default) or IPv6
- Pings per run: Number of ICMP Echo Request packets to send per check run (1-50, default: 10)
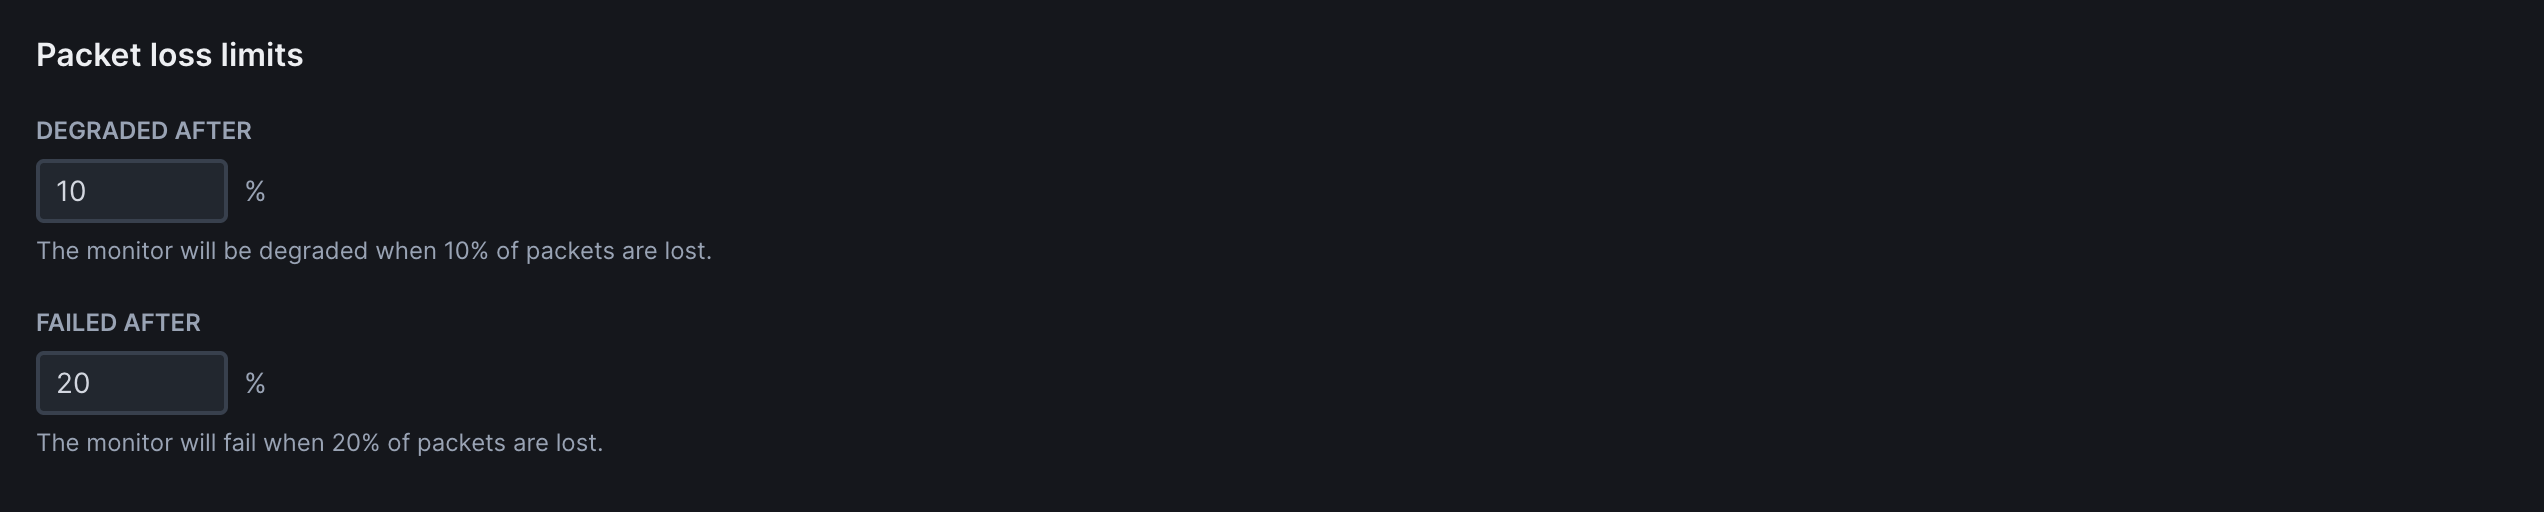
Packet Loss Limits
Define packet loss thresholds to determine when an ICMP monitor should be considered degraded or failed:
Assertions
Use assertions to validate ICMP results and make sure your host meets availability and performance expectations.
-
Latency metrics: ICMP monitors send 10 pings per run by default and measure round-trip time (RTT) for every received packet. You can validate the resulting
min,max,avg, orstddevlatency values. -
JSON response: Assert against the JSON response structure. This allows you to target specific fields using JSON path assertions. For example:
$.latency.max→ catch latency spikes$.packetsReceived→ detect dropped ping responses$.dnsResolutionTime→ separate DNS issues from ICMP latency$.pingResults[*].ttl→ check TTL values
JSON Response Schema
The ICMP response is parsed into a structured JSON format. All responses share a common structure:Frequency
Set how often the monitor runs (every 10 seconds to 24 hours):

Scheduling & Locations
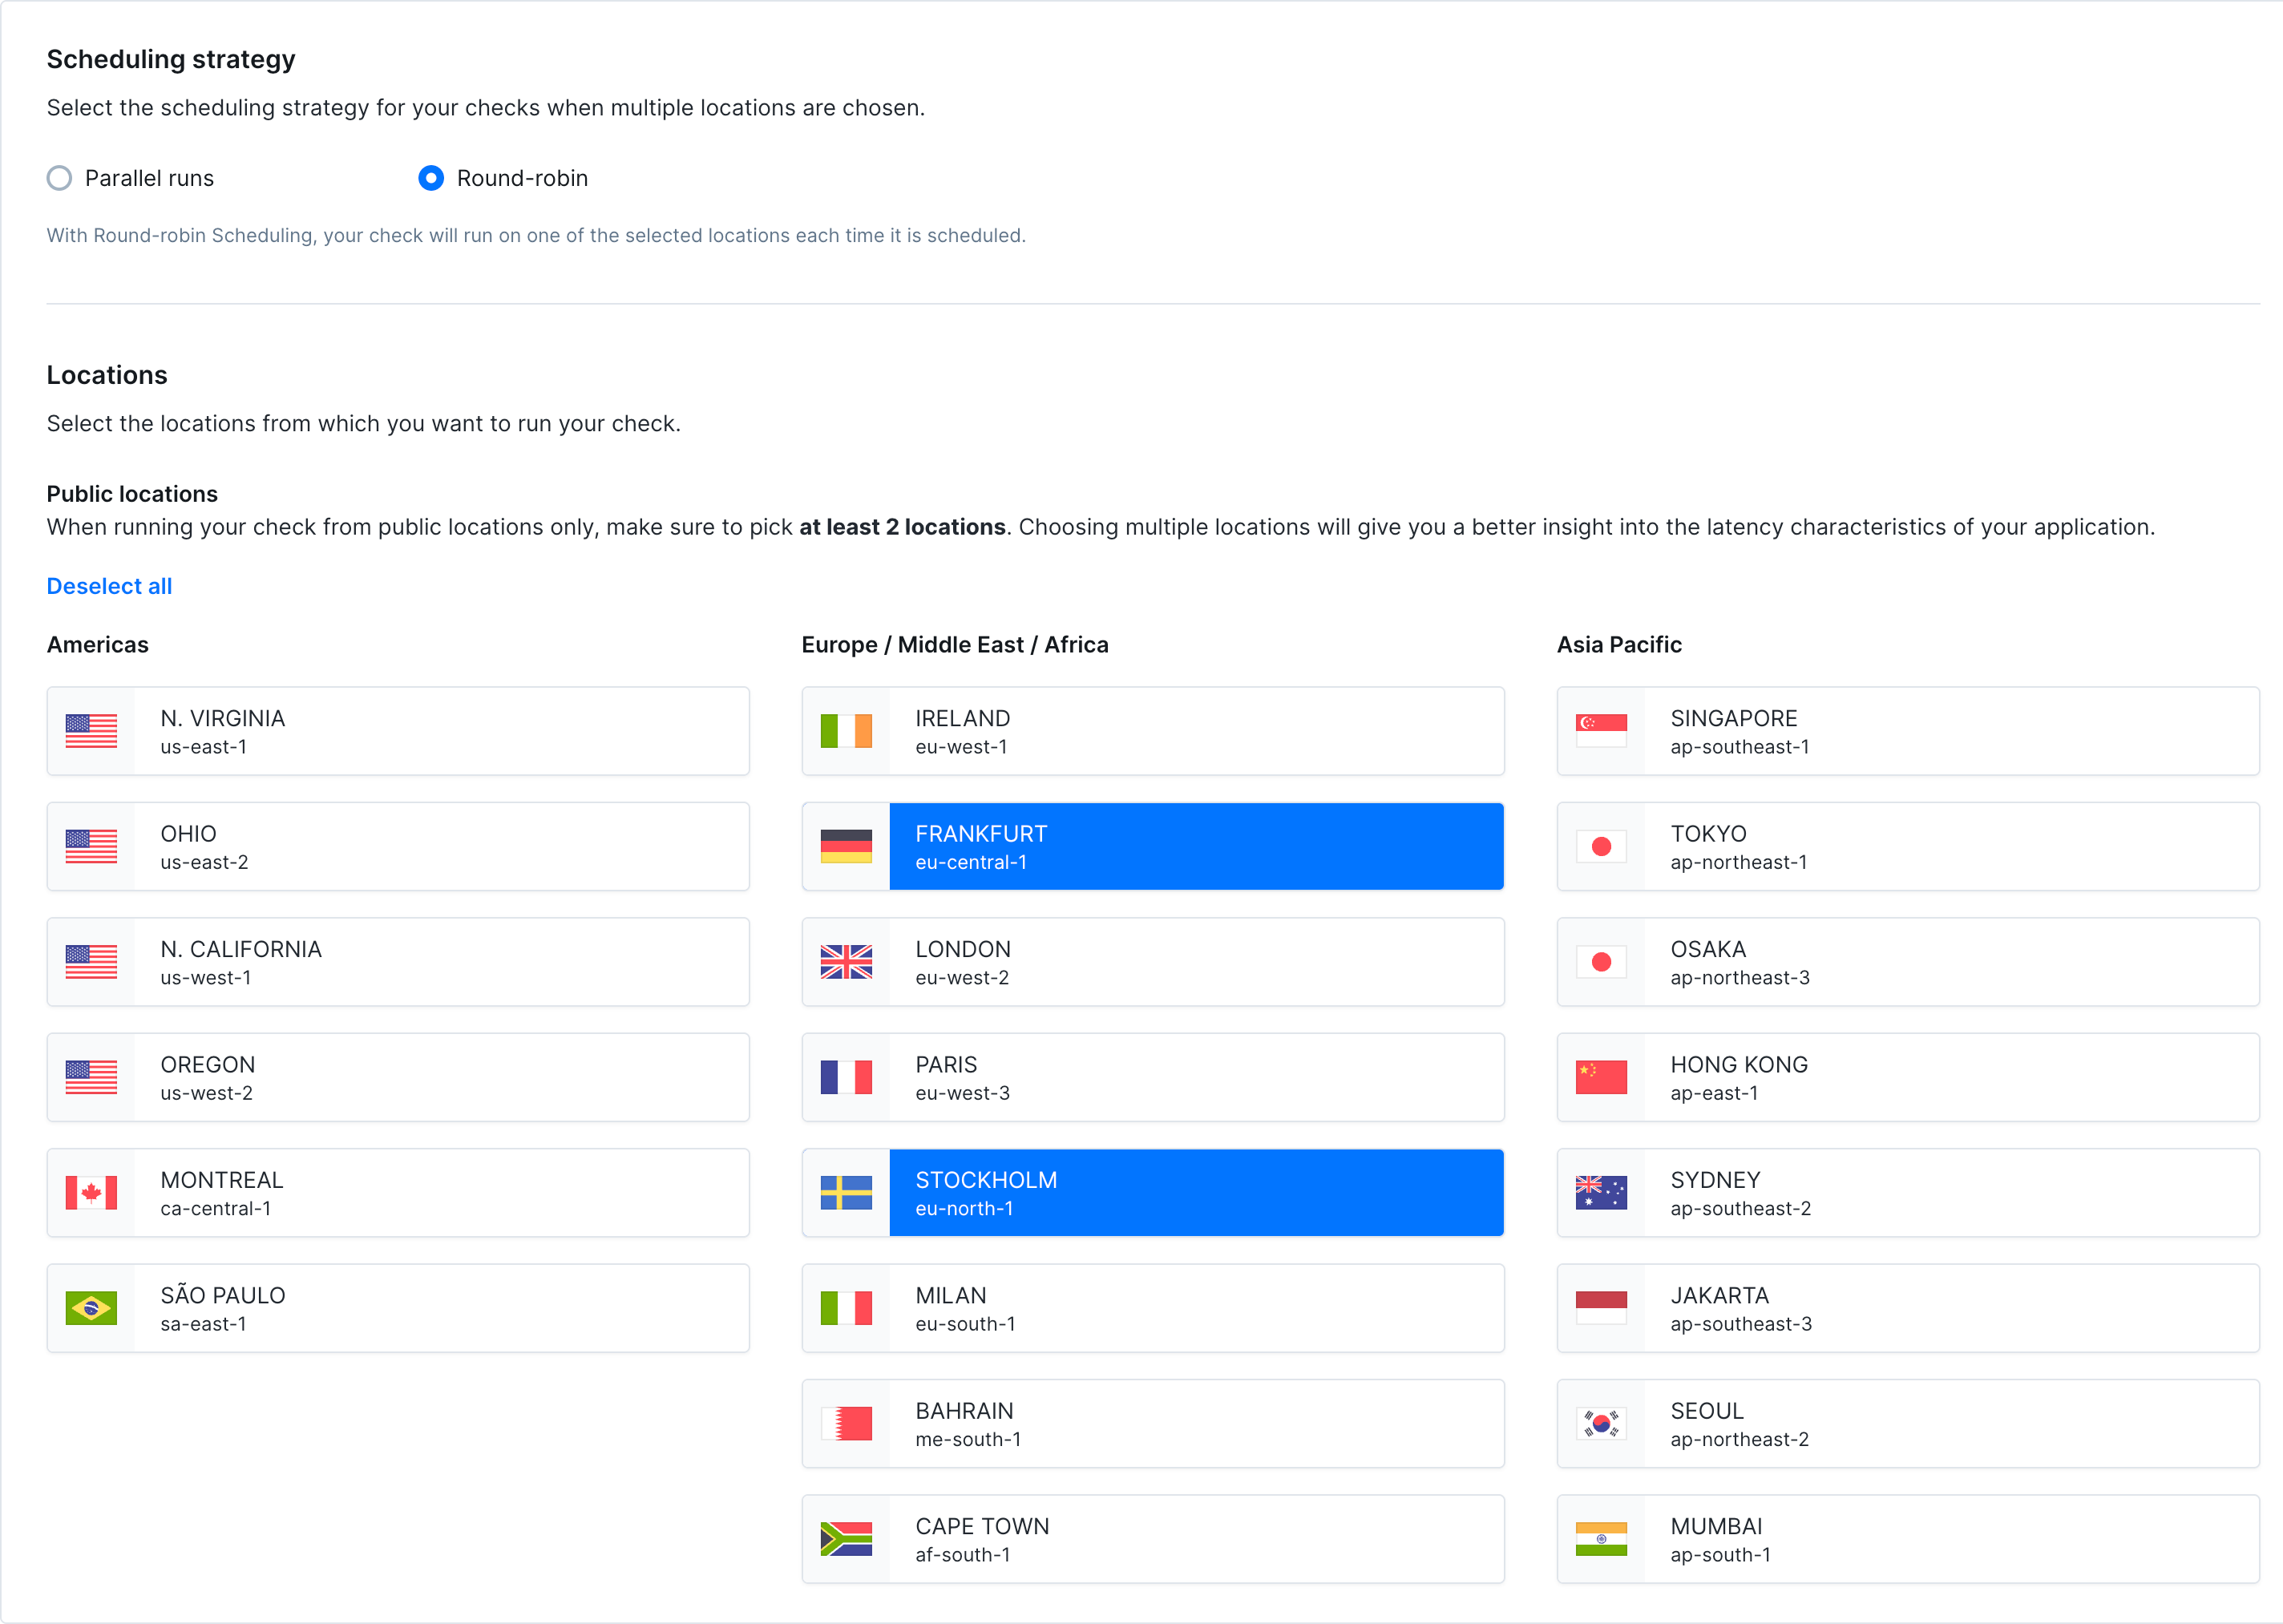
- Strategy: Choose between round-robin or parallel execution. Learn more about scheduling strategies
- Locations: Select public or private locations to run the monitor from
Additional Settings
- Name: Give your monitor a clear name to identify it in dashboards and alerts
- Description: Add context about what this monitor does and why it matters. Supports markdown, max 500 characters. When a failure occurs, Rocky AI uses the description to provide more accurate root cause and user impact analysis
- Tags: Use tags to organize monitors across dashboards and maintenance windows
- Retries: Define how failed runs should be retried. See retry strategies
- Alerting: Configure your alert settings, alert channels, or set up webhooks for custom integrations