Basic Setup
Configure your TCP monitor by specifying the target service: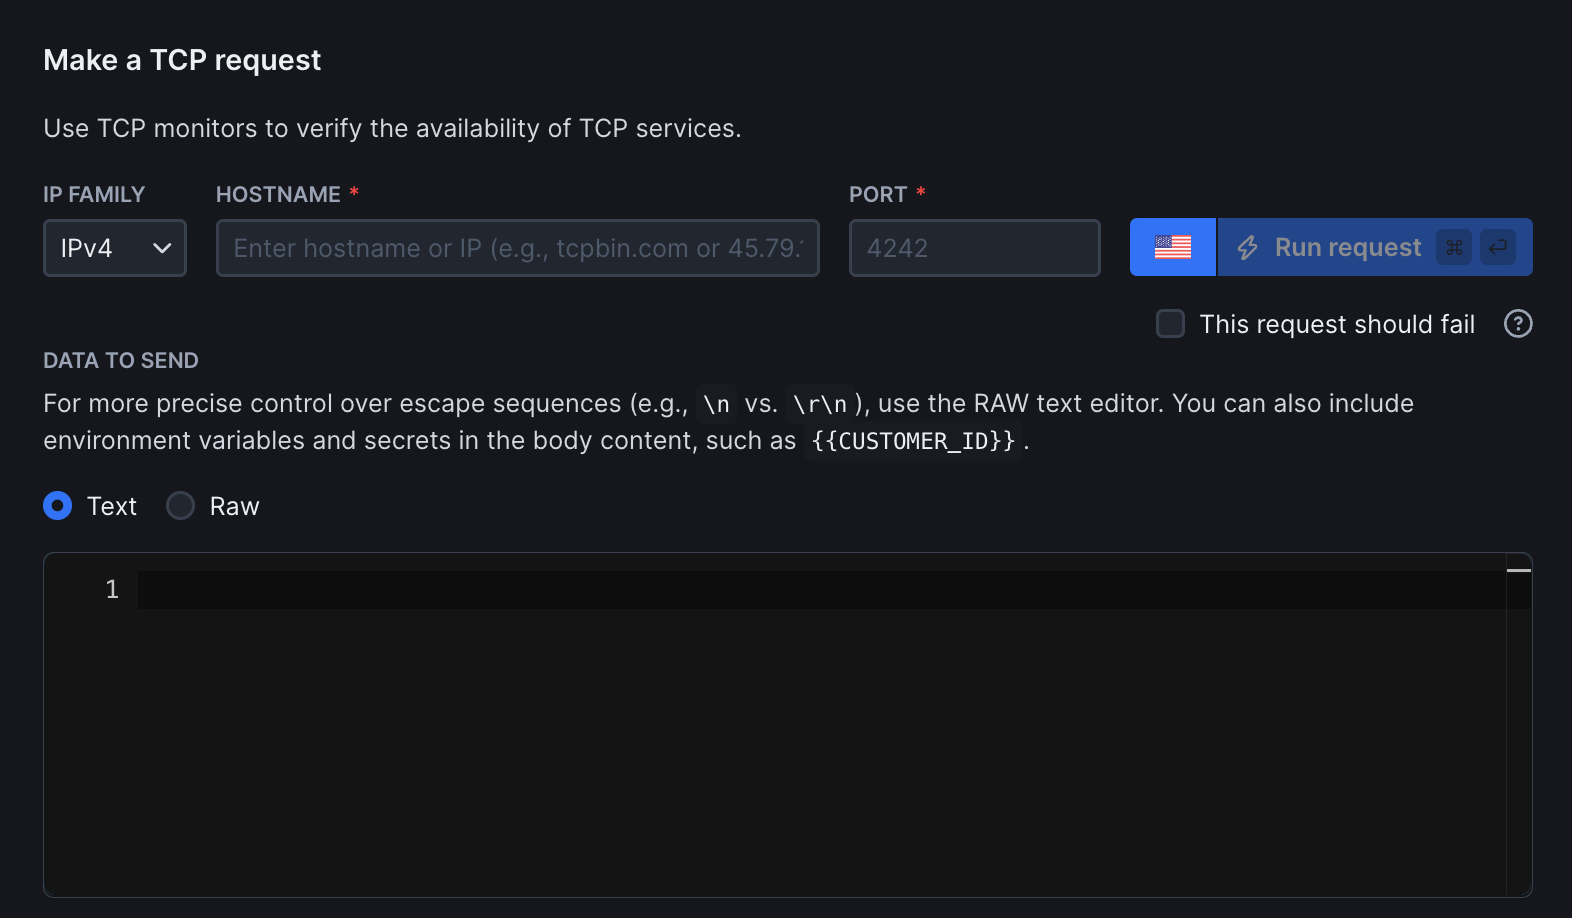
- Hostname and port: The server you want to monitor (e.g.
tcpbin.comor192.168.1.1) and a port (e.g. 4242) - IP family: Choose between IPv4 (default) or IPv6
- This request should fail: Enable this option to treat connection failures (e.g. timeouts or refused ports) as passed. Please note that successful connections will continue to pass. Only failed assertions will cause the check to fail
- Data to send: The content included in the TCP request. For example, this could be text or protocol-specific commands expected by the target service
Assertions
Use assertions to validate TCP connection timing and response data returned by the service.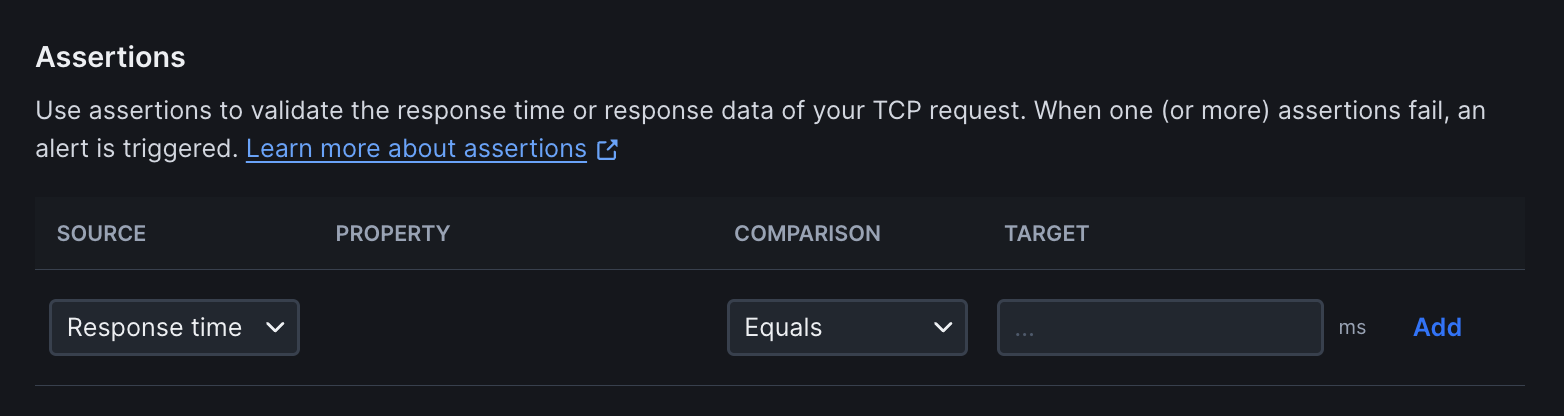
- Response time: Assert that the TCP connection completes within a specified time threshold
- Response data: Validate the data returned by the server after sending a payload. For example, when sending
USER anonymous\r\n, you can assert that the response contains331 Please specify the password
Response Time Limits
Set performance thresholds to ensure your application meets speed requirements: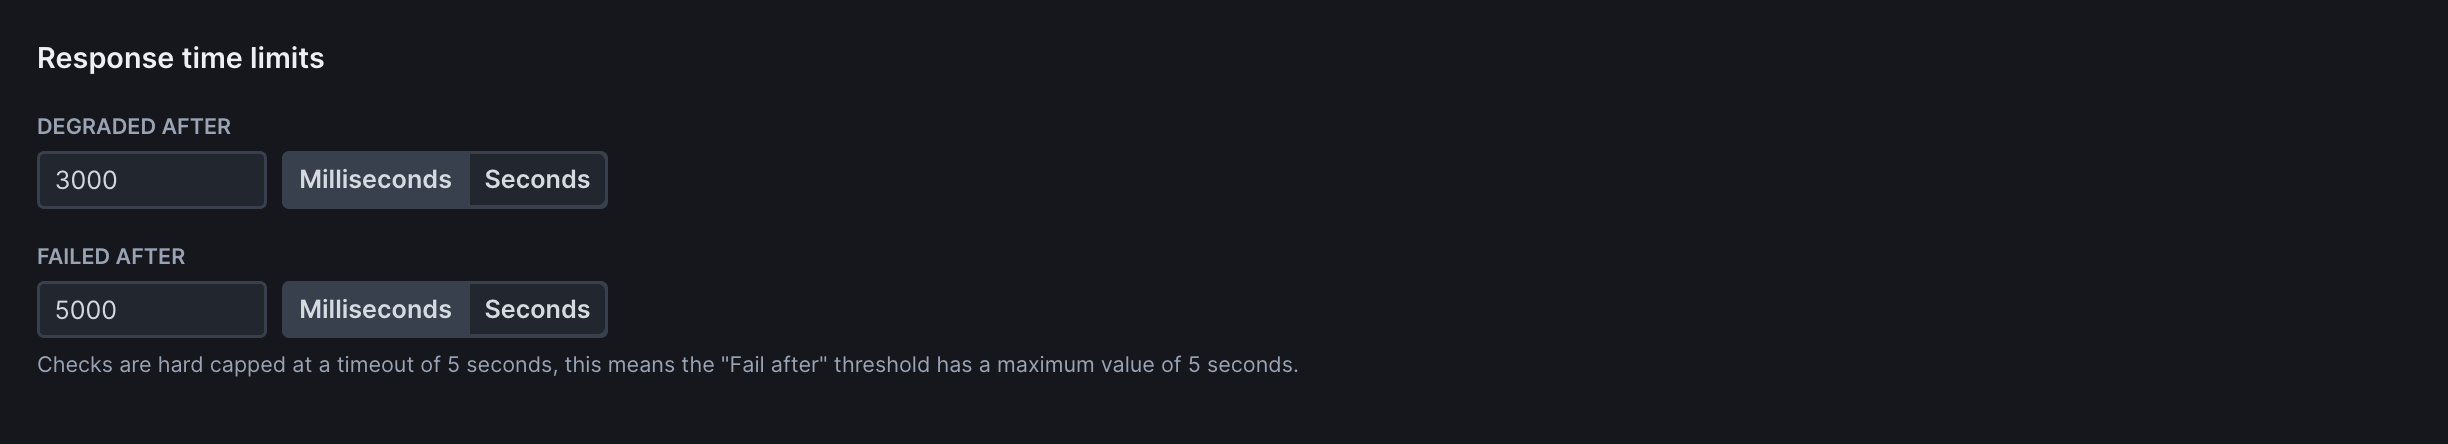
- Degraded After: Time threshold (in milliseconds) after which the check is marked as degraded but not failed. Use for performance warnings without triggering failure alerts
- Failed After: Time threshold after which the check fails completely. Use for hard performance limits where slow responses should trigger alerts
Frequency
Set how often the monitor runs (every 10 seconds to 24 hours):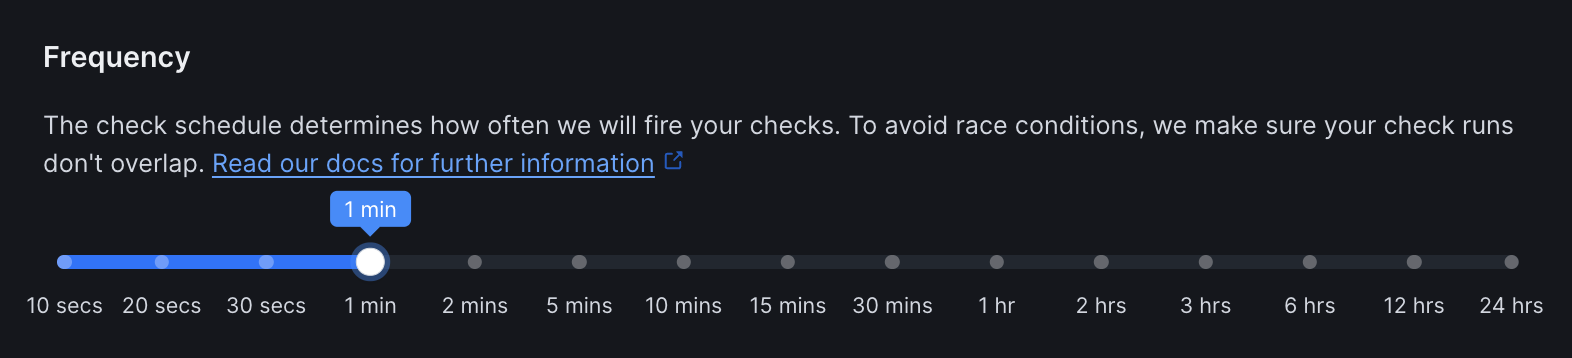
Scheduling & Locations
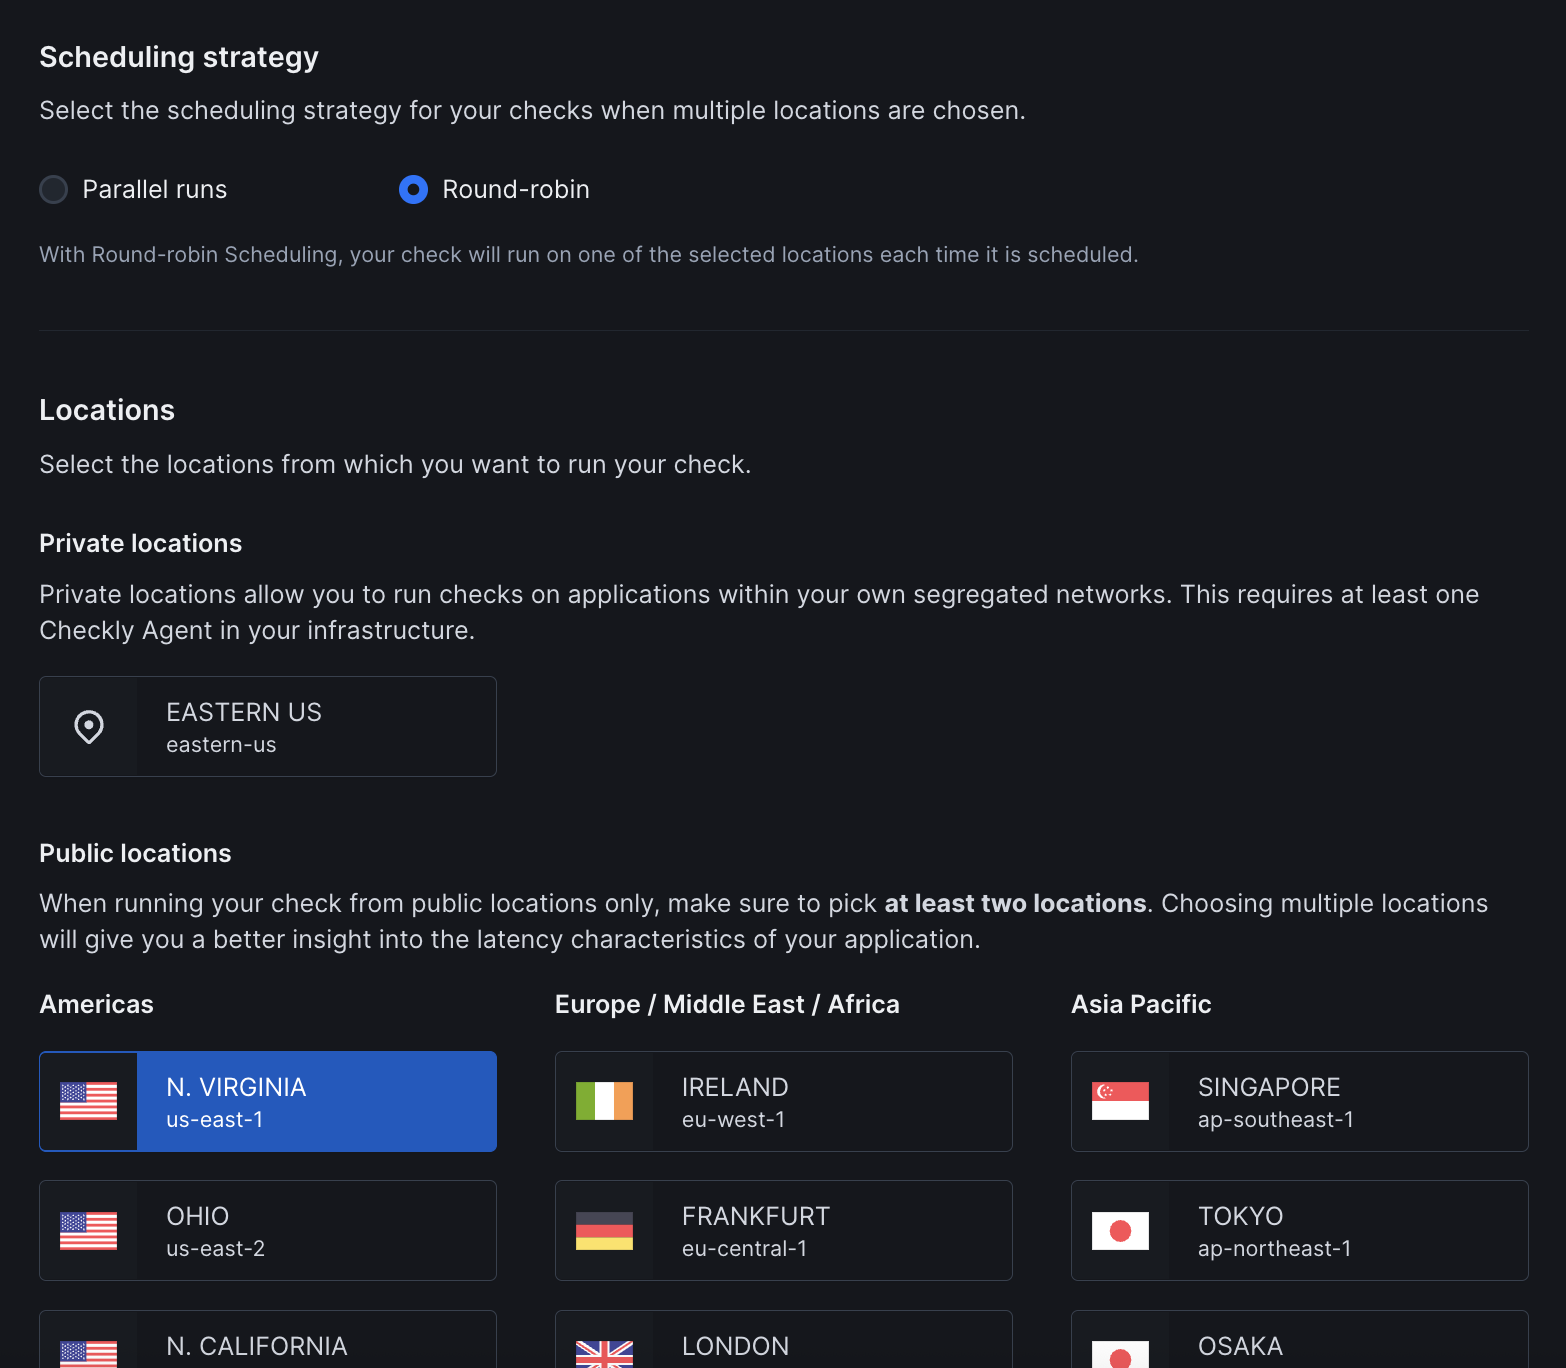
- Strategy: Choose between round-robin or parallel execution. Learn more about scheduling strategies
- Locations: Select public or private locations to run the monitor from
Additional Settings
- Name: Give your monitor a clear name to identify it in dashboards and alerts
- Description: Add context about what this monitor does and why it matters. Supports markdown, max 500 characters. When a failure occurs, Rocky AI uses the description to provide more accurate root cause and user impact analysis
- Tags: Use tags to organize monitors across dashboards and maintenance windows
- Retries: Define how failed runs should be retried. See retry strategies
- Alerting: Configure your alert settings, alert channels, or set up webhooks for custom integrations
TCP monitors provide network-level connectivity verification. For application-level monitoring, consider adding synthetic monitoring to your monitoring strategy.