The rise of APIs
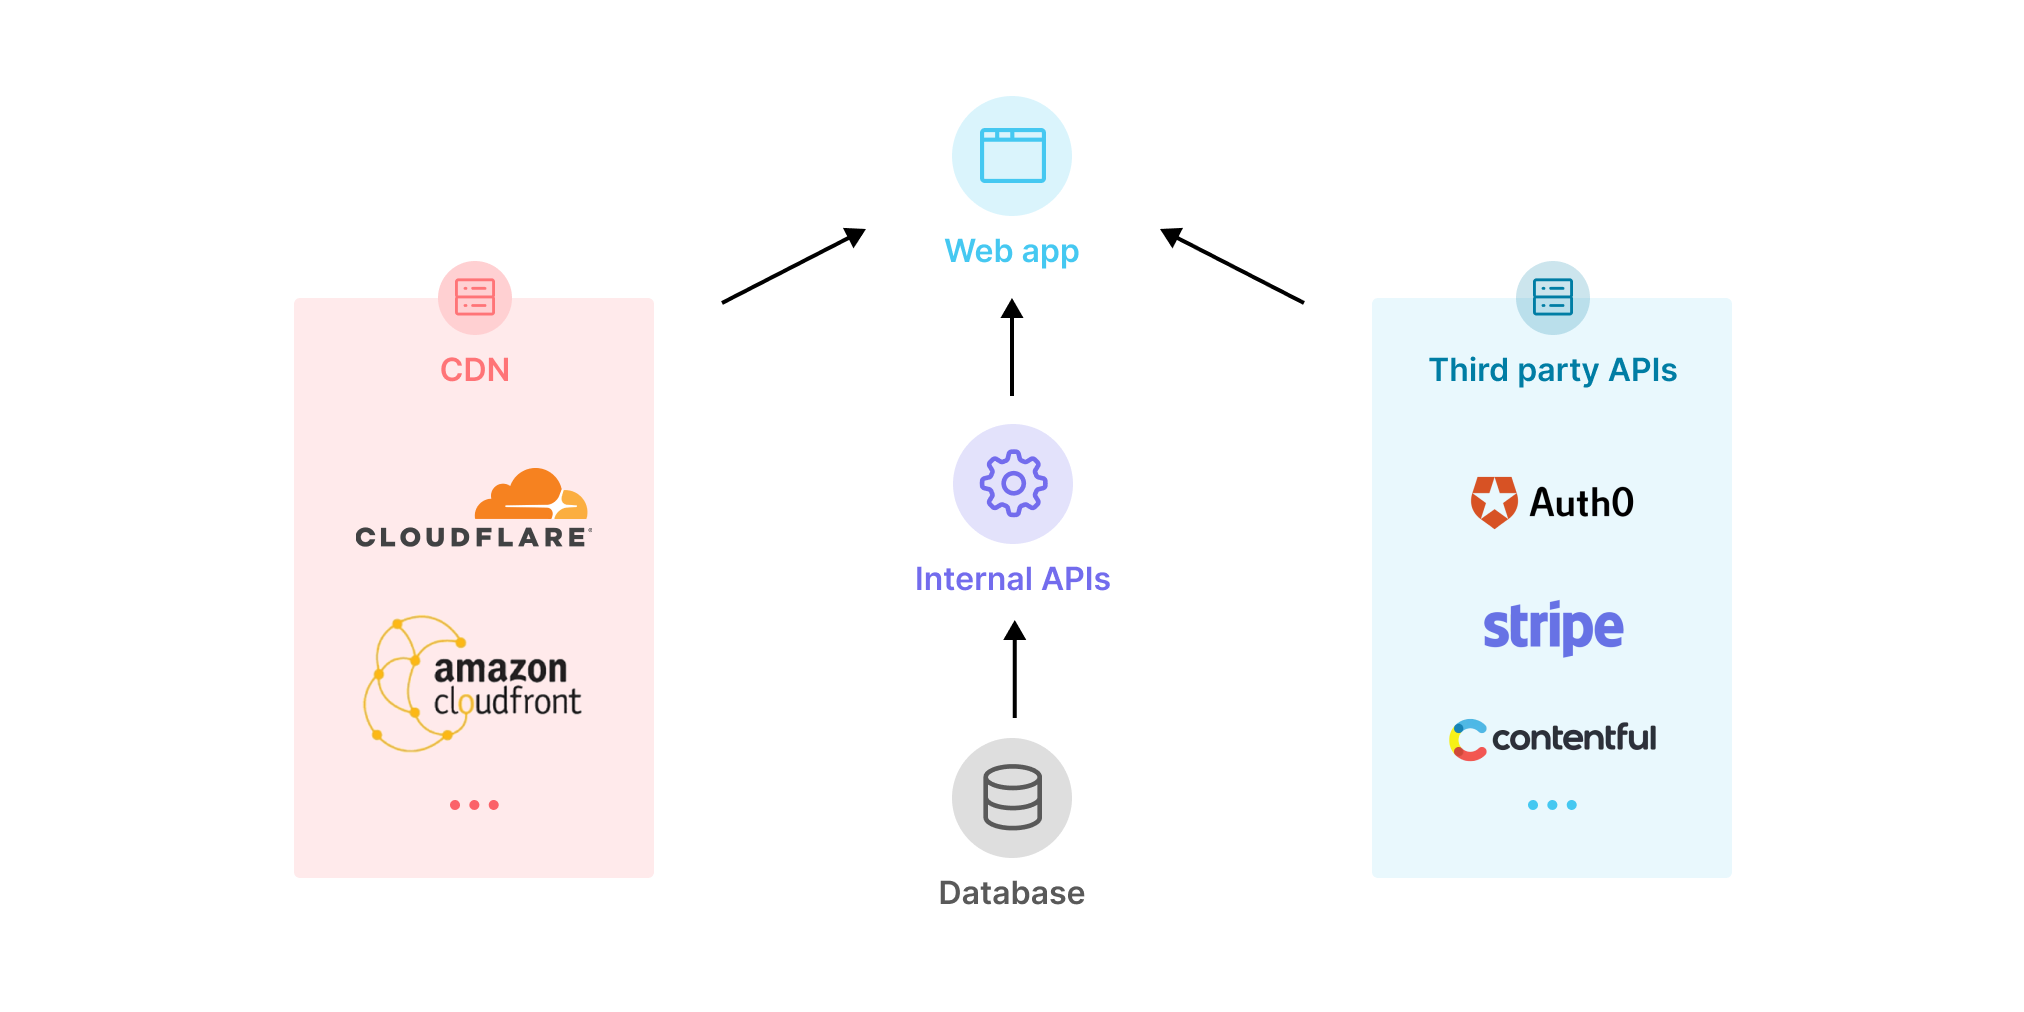
With the rise of the Jamstack, the already broadly used web APIs have been brought further into the spotlight and explicitly named as cornerstone of a new way of building web applications. In the Jamstack paradigm, applications rely on APIs returning structured data (JSON or XML) when queried via a build process or Javascript-based frontend. The API calls might be aimed at internal services or at third-parties handling complex flows such as content management, authentication, merchant services and more. An example of third-party API could be Stripe, which acts as payment infrastructure for a multitude of businesses. Given their importance in this new kind of web application, internal and external APIs need to be tightly monitored, because failures and performance degradations will immediately be felt by the end-user.API failures
API endpoints can break in a variety of ways. The most obvious examples are:- The endpoint is unresponsive/unreachable.
- The response is incorrect.
- The response time is too high.
API checks
If we were interested in just verifying a server or a virtual machine’s availability, we could rely on a simple ping/uptime monitoring solution. API monitoring is more fine-grained than that though, as we need to validate functionality and performance on each API endpoint. API checks do exactly that, and they are composed of the following:- An HTTP request.
- One or more assertions, used to specify exactly what the response should look like, and fail the check if the criteria are not met.
- A threshold indicating the maximum acceptable response time.
It is worth noting that in real-world scenarios, requests do not happen in a vacuum: they are often handling data retrieved previously, possibly by earlier API calls. Therefore, some mechanism to gather this data and inject it into the request is often needed.
HTTP request for REST APIs
There is a large variety of valid requests that a user might make to a given endpoint. Being able to customise all aspects of our test request is therefore fundamental. Key aspects are:- Methods, like
GET,PUT,POST,DELETE, etc - Headers, like
Accept,Authorization,Content-Type,Cookie,User-Agent, etc - Query parameters
List Customers method in Stripe’s Customer API, which we can use to query elements in very different ways, such as by just specifying a limit of results or asking for all results linked to a specific creation date. In this case, both of the following cases are worth monitoring:
Terminal
Terminal
Stripe.js
HTTP request for GraphQL APIs
So far we have looked at a REST API. Let’s now take a look at an example of how to build a request for a GraphQL endpoint. We will use GitHub’s GraphQL API to retrieve information about the latest open issues on Headless Recorder’s repository. To achieve that, we make aPOST request to the API’s GraphQL endpoint: https://api.github.com/graphql.
We also need to authenticate to GitHub, by sending over our personal access token via the Authorization header.
The request body will contain our GraphQL query:
GraphQL.gql
Terminal
Assertions
To validate the API response, we should be able to check against- Status code
- Headers
- Body
Terminal
Stripe.js
Response time thresholds
Having an endpoint return the correct result is only half the battle. It is imperative that the response reaches the user quickly enough not to disrupt any dependent workflow. In the worst case, where the response time exceeds what the end user is prepared to wait, a performance failure is undistinguishable from a functional one. The easiest way to handle this requirement would be to assert that the specific response time be lower than a certain value, or even just set a timeout for our axios request by adding thetimeout: 7500 property in the previously shown request config.
Instead of simply asserting against a specific response, we might want to set different thresholds: based on the nature of our service, a 2x slowdown might still leave it in what we define as an operational state, while a 10x one might not.
API monitoring best practices
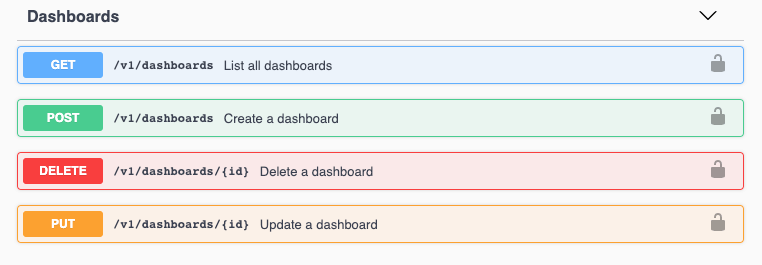
Now that we are clear on the key requirements for setting up API checks, let’s think about what and how we should monitor.Monitor every endpoint
We want to monitor every API endpoint our application exposes. Remember that different HTTP methods define different API endpoints. For example:GET /user/:idPUT /user/:id
Cover key API parameters
Some parameters can change the endpoint’s response significantly. We should strive to have separate checks verifying that the endpoint is behaving correctly across different configurations.Keep checks focused & independent
API monitoring checks must be organised as to minimise the time needed to identify resolve the underlying issue. This means we need to keep our checks focused on a specific case (vs trying to have a single check do many things) and independent from each other (vs building chains of checks that build on top of one another).Scheduled global API checks
Checkly specialises in API monitoring and allows users to run API checks on a schedule from global locations. We can combine these checks with custom alerting to be able to quickly respond and remediate potential API issues.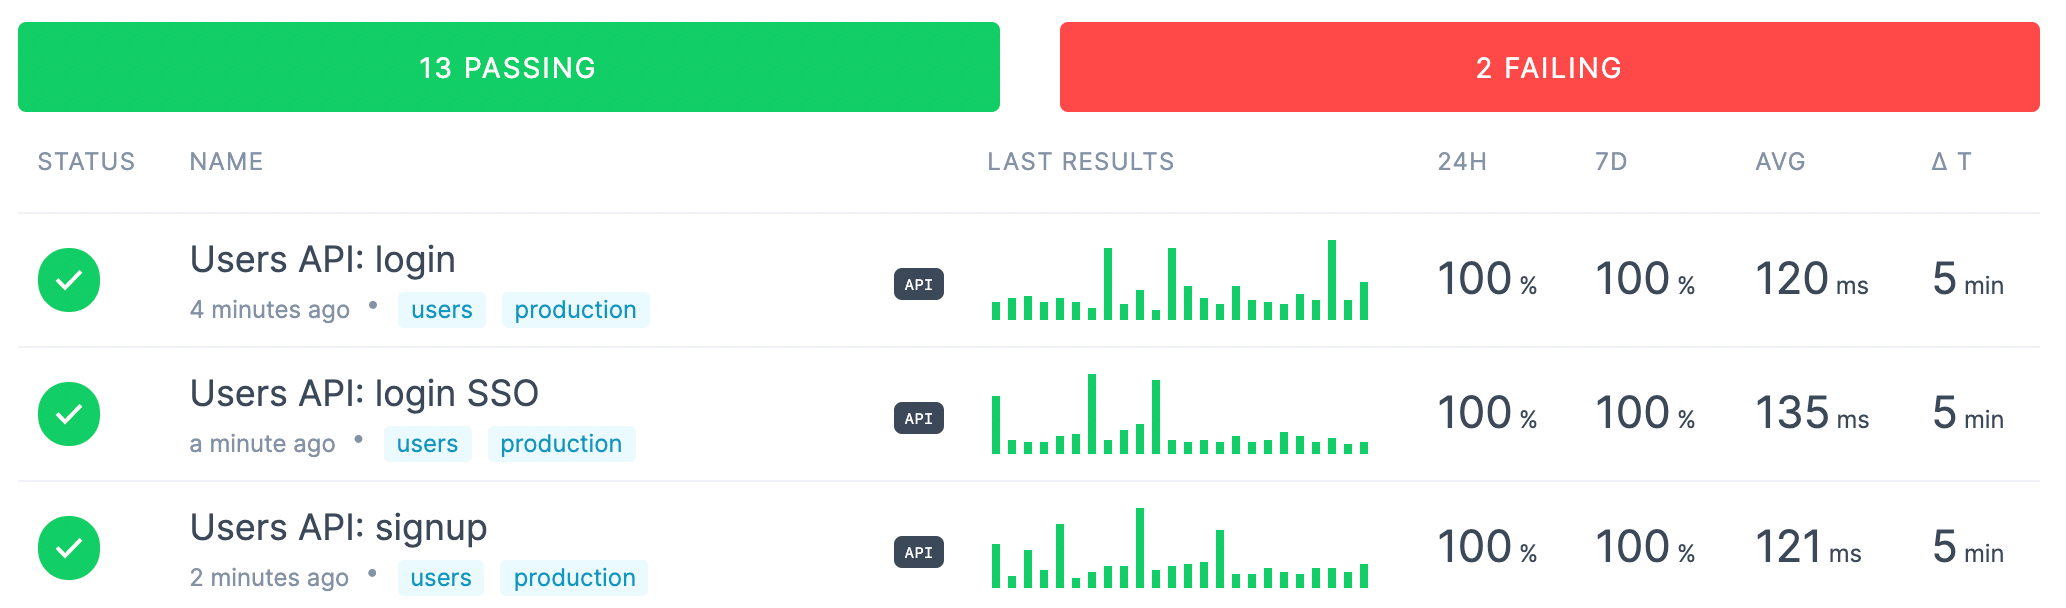
Main HTTP request
The most basic building block of Checkly’s API check is the main HTTP request. This can be fully configured in its method, URL, parameters and body to fully reproduce a real-world web API call.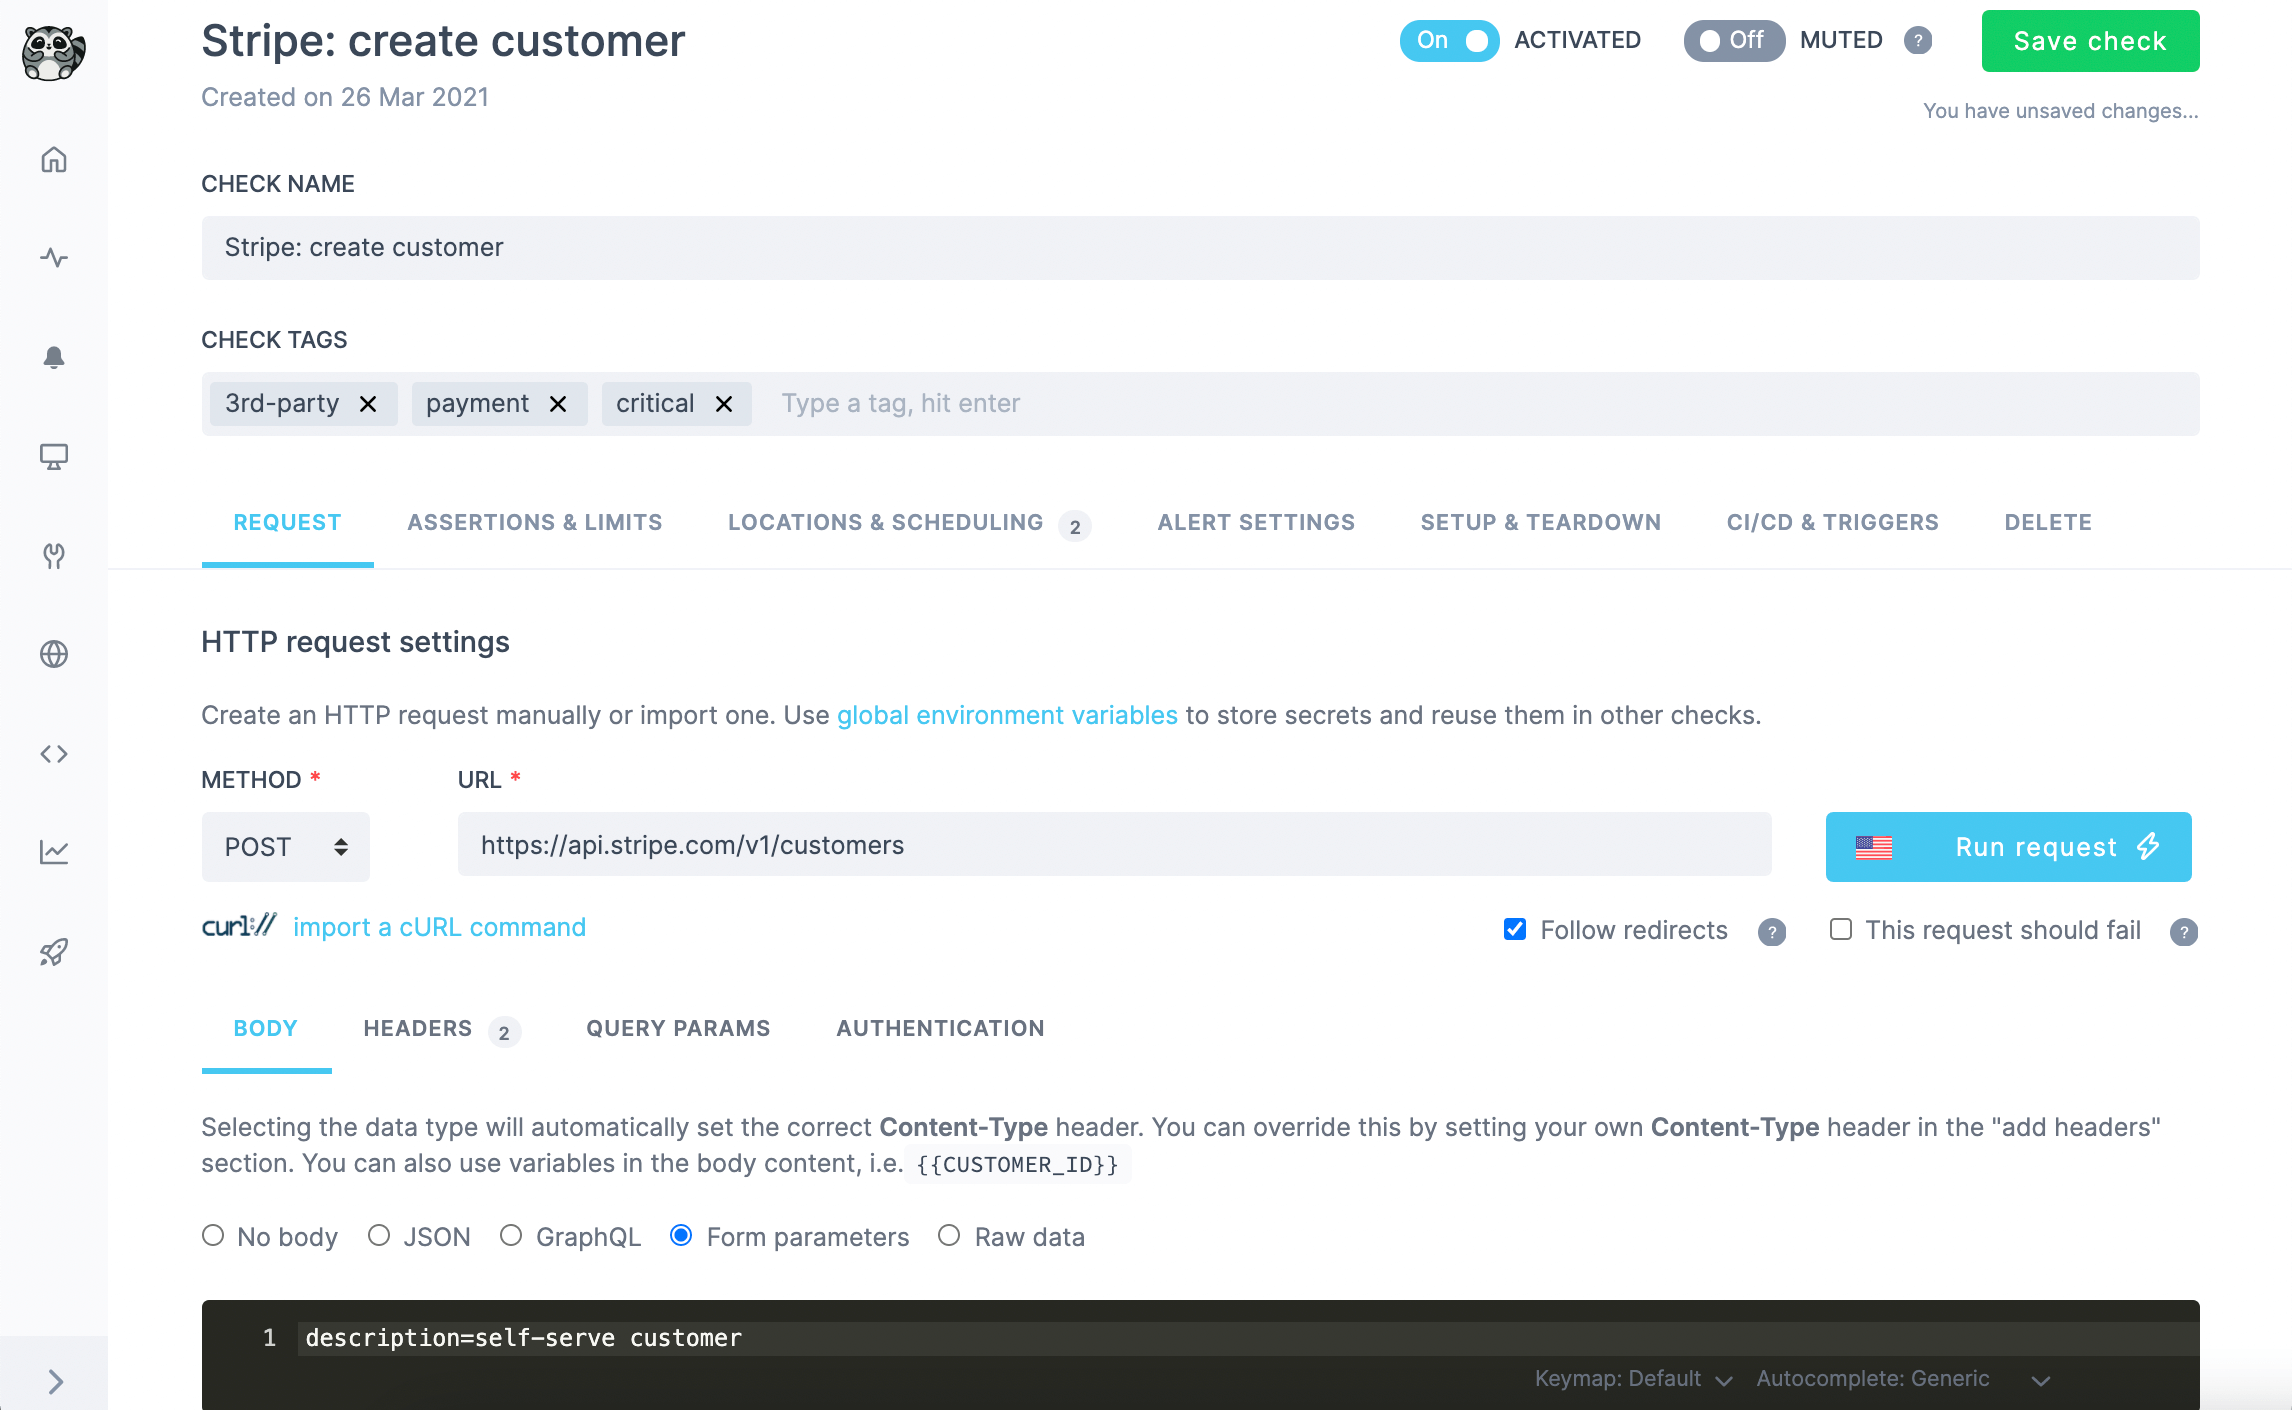
Our previous GraphQL-based example is also supported, see theGraphQLoption under theBodytab.
Assertions
Assertions allow us to check for every key aspect of the response. A check with one or more failing assertions will enter failing state and trigger any connected alert channel.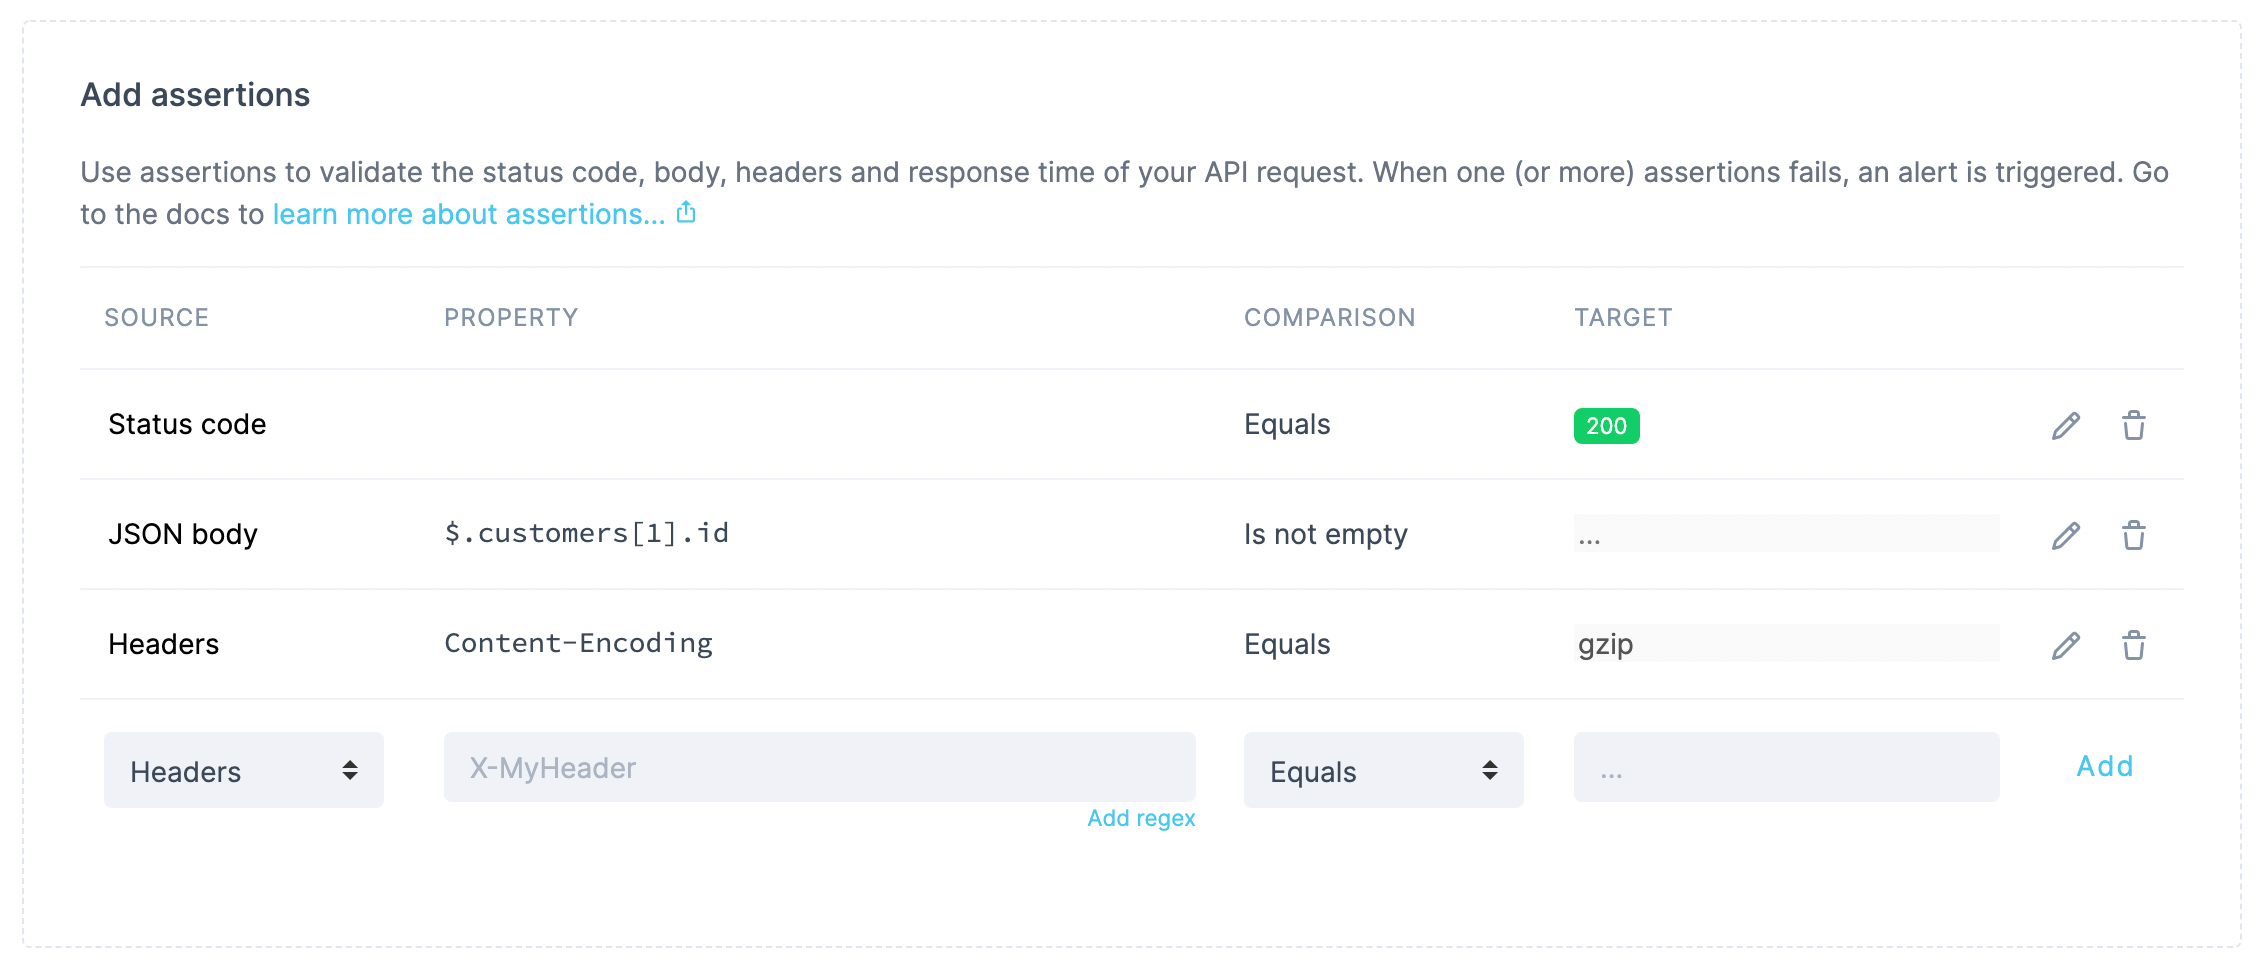
- The status code, expected to be
200. - The id of one of the customers returned as part of the response’s JSON body. Here we could assert a specific value, but in this case we are happy with just verifying that the field is not empty.
- The value of the
Content-Encodingheader, expected to equalgzip.
Response time limits
Response time limits enable us to set different thresholds to decide exactly which response time maps to a hard failure, a pass or a degradation. We can use transitions between these states to trigger different kinds of alerts using our preferred channels.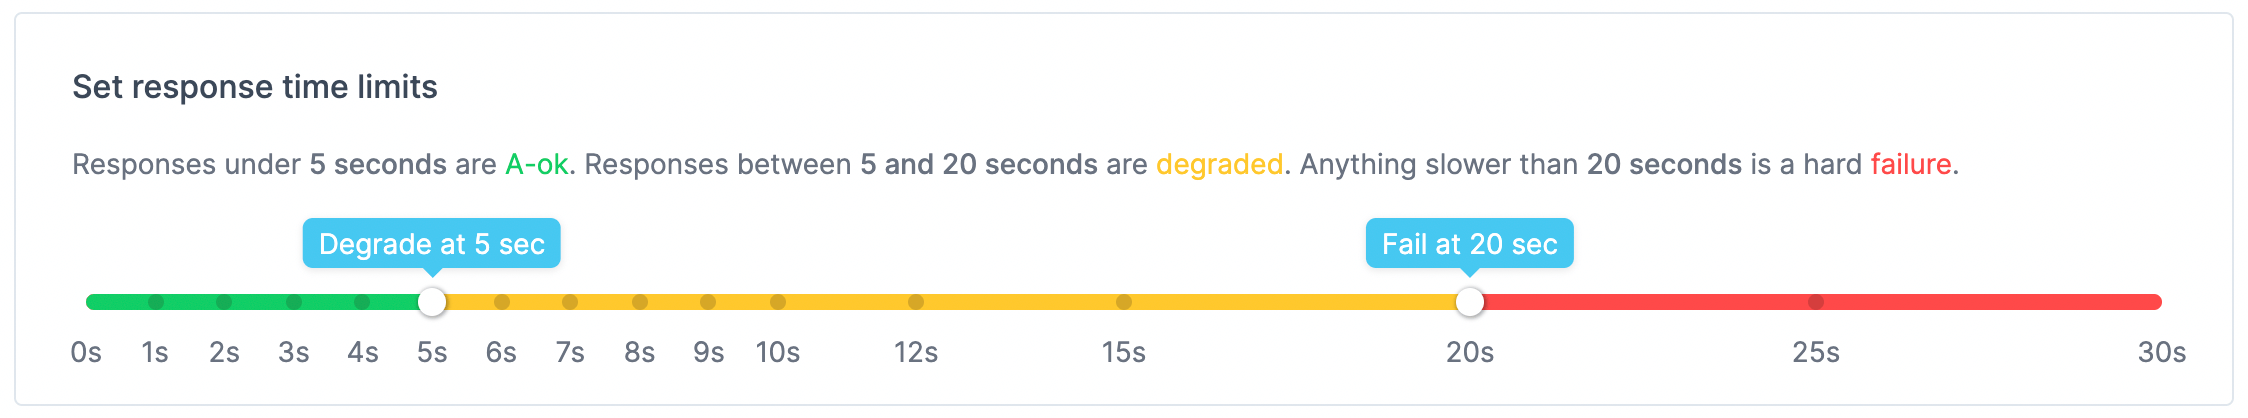
Setup and teardown scripts
Checkly is highly programmable and allows users to run scripts before and after the main HTTP request of an API check.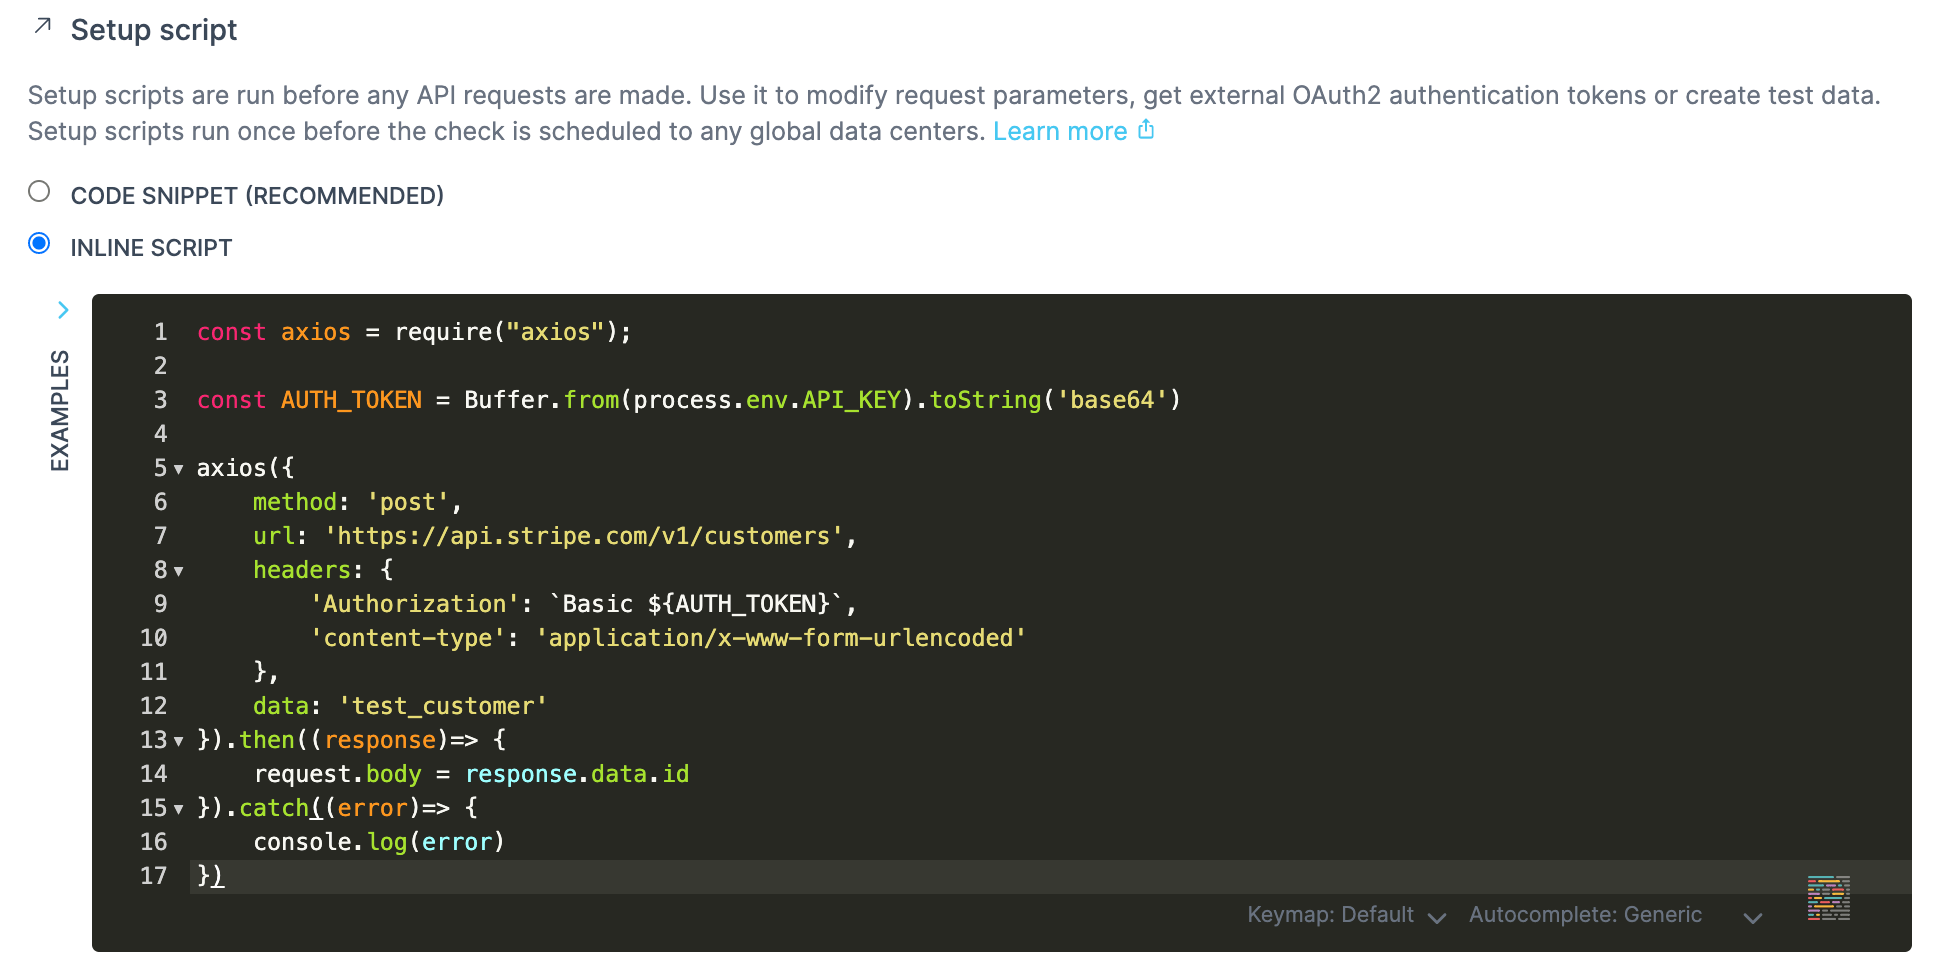
- Fetching a token from a different API endpoint.
- Setting up test data on the target system.
- Formatting data to be sent as part of the request.
Improving our monitoring
As we increase our monitoring coverage across our APIs, we can also increase the efficacy of our setup by:- Importing existing Swagger/OpenAPI specs or even cURL commands using built-in functionality.
- Defining our API checks as code to scale our setup while lowering maintenance needs.
- Combining our API checks with E2E monitoring for any website or web app service whose API we might be monitoring.
Read More
Monitoring as Code
Understand monitoring as code (MaC) via our Checkly CLI.
End to end monitoring
Learn end-to-end monitoring with playwright to test key website flows.
OpenAPI/Swagger Monitoring
OpenAPI and Swagger help users design and document APIs in a way that is readable from both humans and machines.