An overview of end-to-end monitoring
End-to-end monitoring is a comprehensive strategy designed to assess the overall health and performance of a service by examining the entire lifecycle of requests to an application. By simulating a user request, including the browser rendering and user experience, an operations or development professional tests all parts of an application at once; hence the name ‘end-to-end.’ End-to-end monitoring is an outgrowth of end-to-end testing, where rather than sending test request once, with monitoring tests are run on a cadence, and the results automatically compiled. By aligning monitoring insights with the user experience, end-to-end monitoring ensures that any anomalies, edge cases, or potential failures impacting users are quickly identified and addressed. This inclusive monitoring strategy often involves multiple teams, including developers, network engineers, and non-technical stakeholders, fostering a collaborative effort to maintain optimal system performance and enhance the digital experience for users.End-to-end monitoring vs traditional monitoring approaches
Unlike traditional testing, which focuses on isolated components and only tests occasionally, end-to-end monitoring provides a holistic view of a product or service. Methods like unit testing look at individual aspects like servers or databases, sending specific requests to the services and verifying the response. This kind of testing doesn’t allow for edge cases like display issues, unusual accounts with different settings, or other problems that real users experience after unit testing. Running tests only occasional, the traditional approach of end-to-end testing only reveals predictable failures, e.g. when major code changes break the service. By running tests on a cadence, more unexpected failures are revealed by end-to-end monitoring.Headless browser testing
Over the course of the last decade, especially thanks to tools such as Selenium and (more recently) Cypress, automated End-to-End testing (E2E testing) has become widespread across industries. Broadly speaking, E2E testing entails running fully automated test suites with the goal of catching bugs before they hit production and, therefore, negatively affect the user experience. These test suites need to be carefully scripted using dedicated tools, as well as to be made stable and fast enough to test the most important end-user flows on every build, PR or commit, depending on the application under test and the organisation’s automation maturity. The industry has learned to struggle with the challenges this approach presents:- Long-running suites.
- Test flakiness.
- Expensive test infrastructure.
E2E monitoring examples
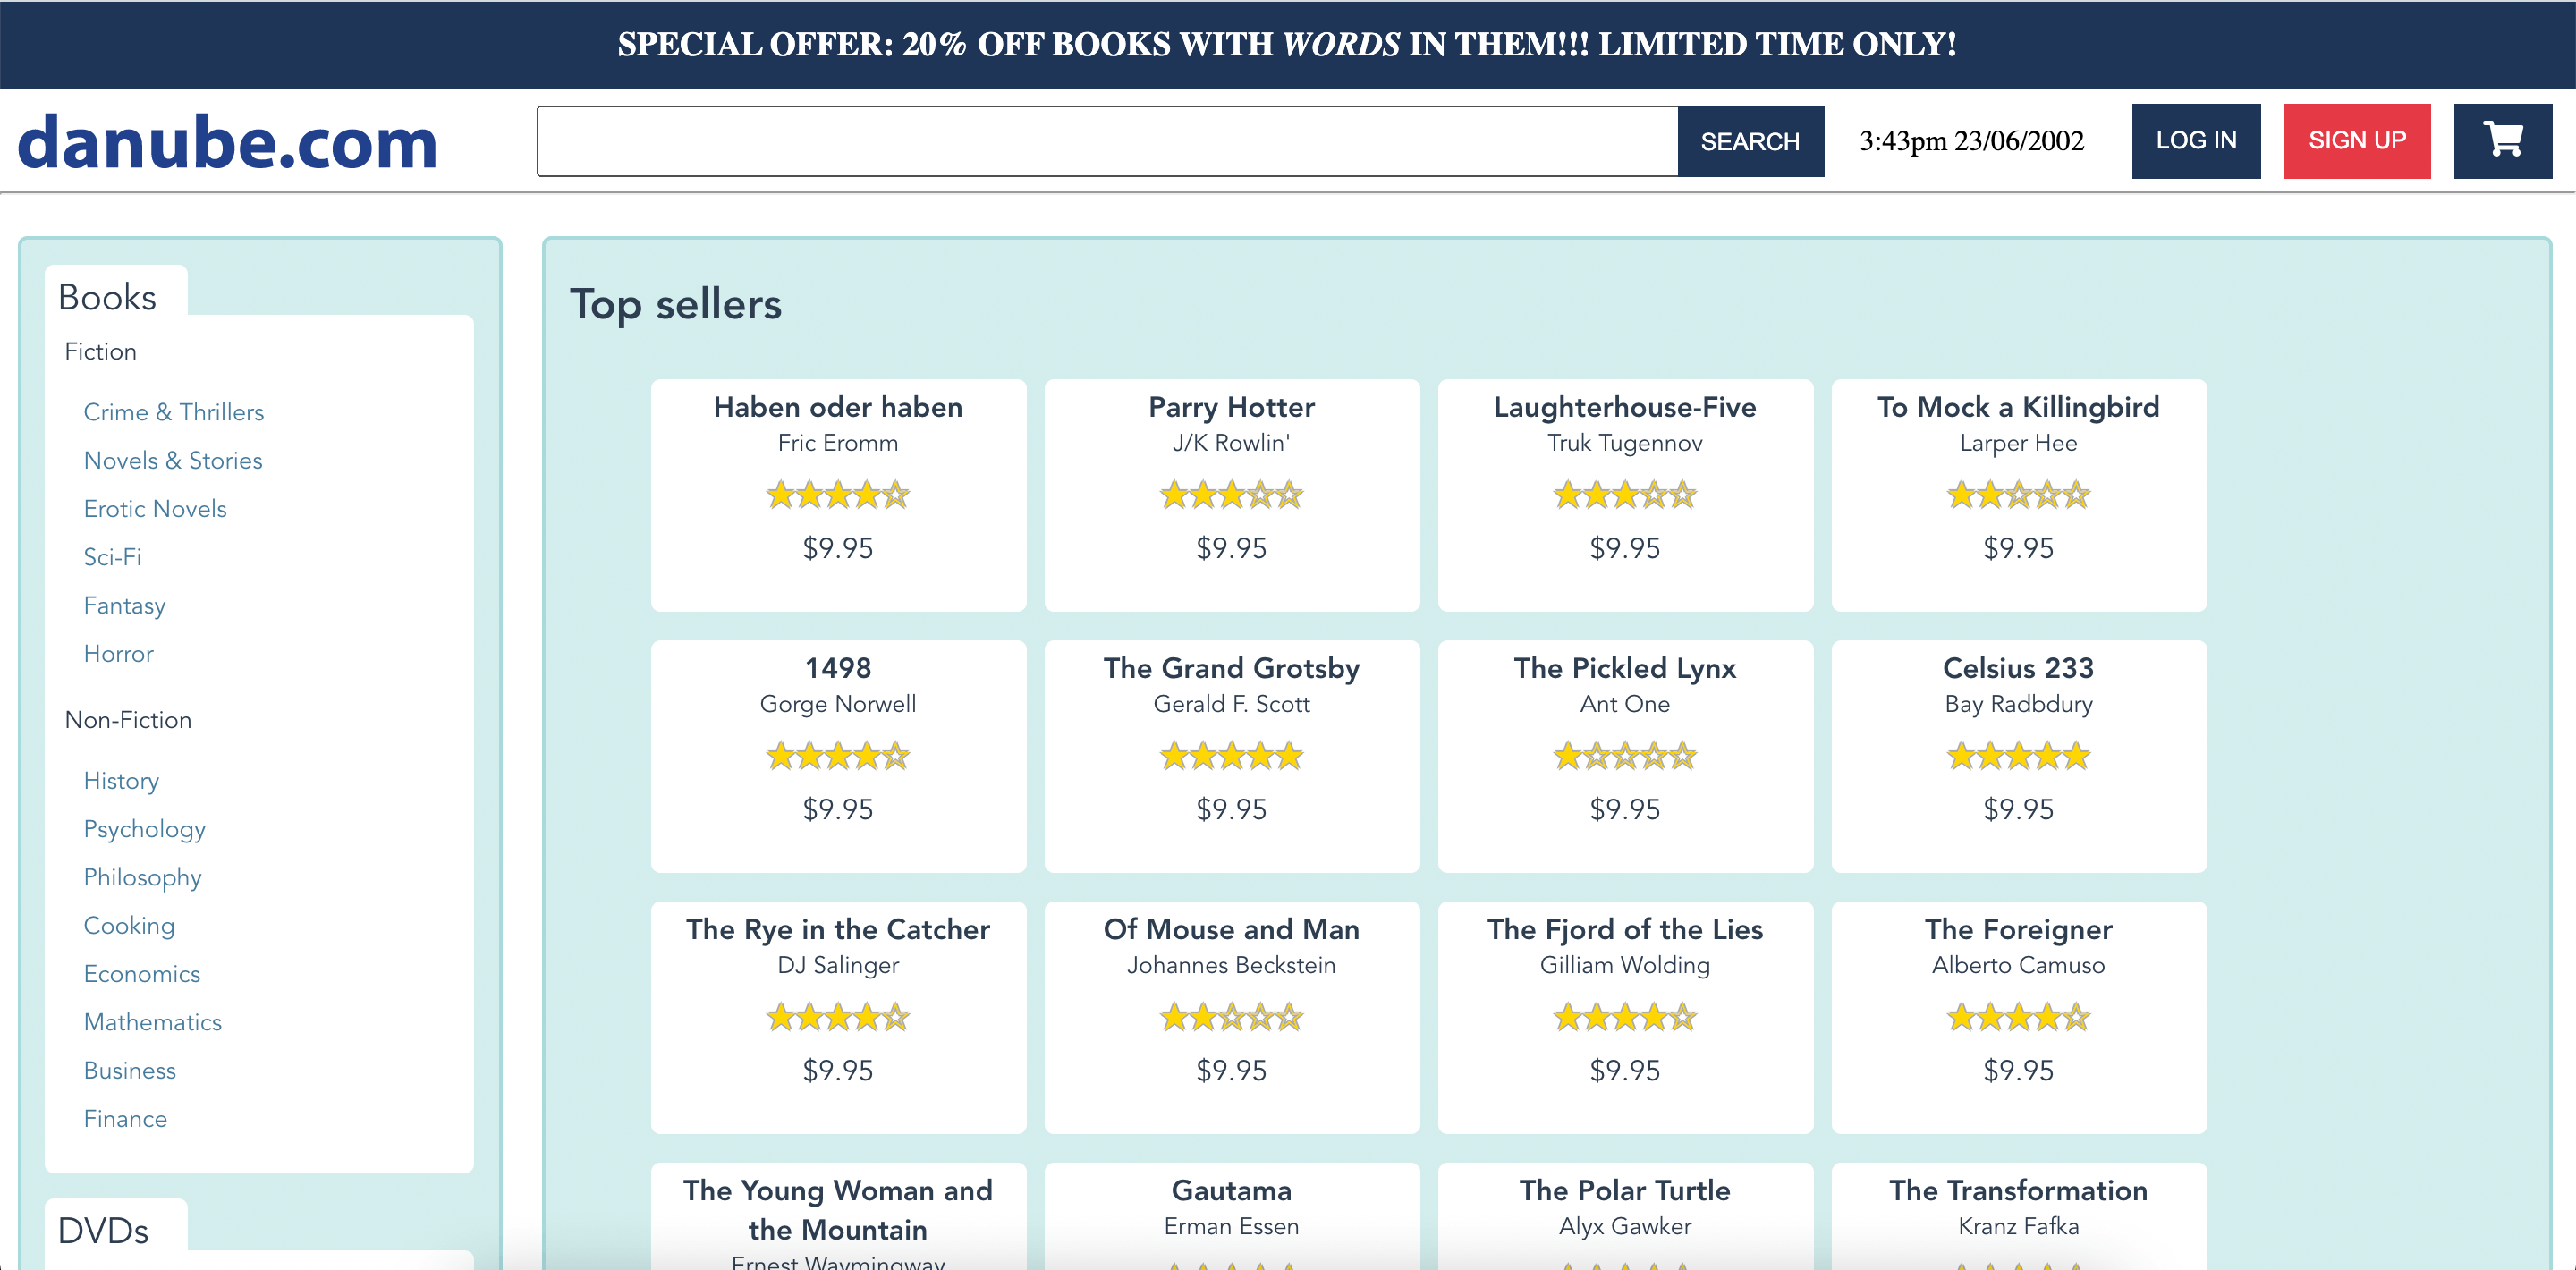
While this nimbler, more reliable kind of test is already a big improvement for pre-production testing, it enables a completely new approach in production monitoring: we can now continuously run E2E tests against our production systems. This enables us to have real-time feedback on the status of our website’s key user flows from a user’s perspective. This is E2E monitoring, also known as synthetic monitoring or active monitoring. This comes with a significant, often underestimated advantage: it allows us to catch all those things that might break in production that can’t be caught during pre-production testing. We are now running directly against the system that the end-user is actually interacting with, and will be able to monitor its behaviour in real time. What could this look like in practice? Let’s look at an e-commerce example.Monitoring a web shop
A few key flows for an e-commerce websites could be:- Logging in
- Finding a product through search
- Adding products to the basket and checking out
Playwright E2E tests
Using Playwright, we can script our three E2E scenarios as follows:- Login
- Search
- Checkout
login.spec.js
node script.js.
Monitoring application performance
A web application’s performance plays a primary role in the user experience it delivers. From the user’s perspective, a fully functional application that is not performant quickly becomes indistinguishable from a broken one. Using Playwright together with browser APIs or additional performance libraries, our end-to-end monitoring setup can be easily extended to include application performance.End to end application monitoring
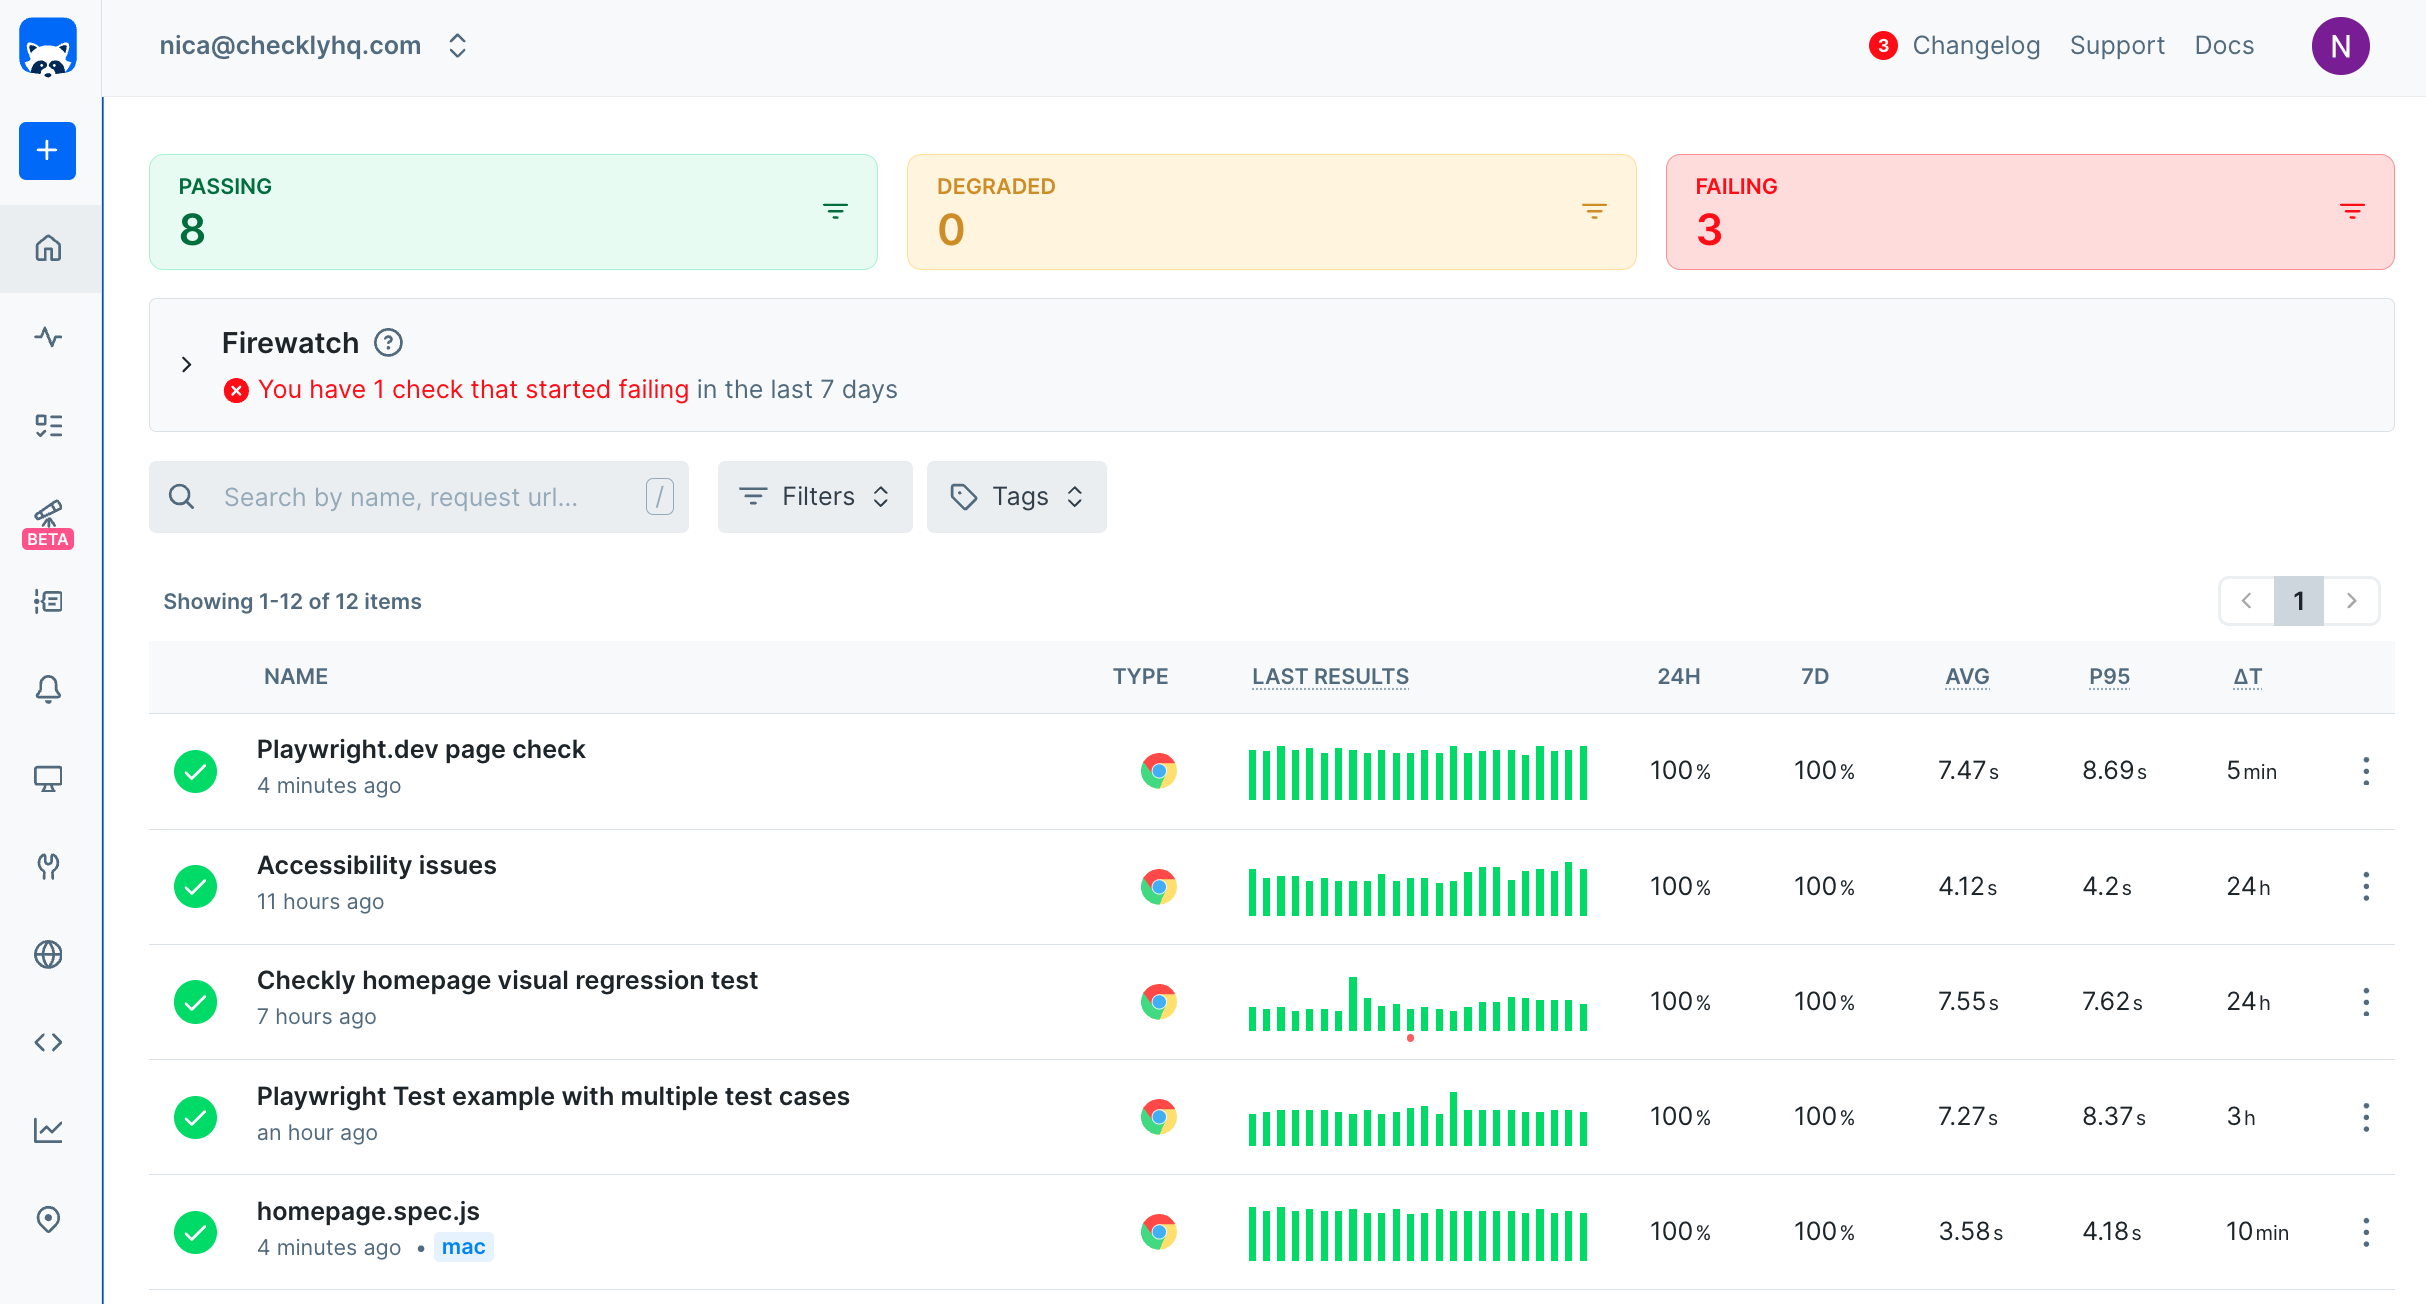
Unlike headful tools, headless ones tend to not be very resource-hungry, which makes it easier to move our scripts to the cloud. Checkly runs on top of AWS Lambda, and enables us to quickly copy-paste our script and set it up to run on a schedule from locations around the world.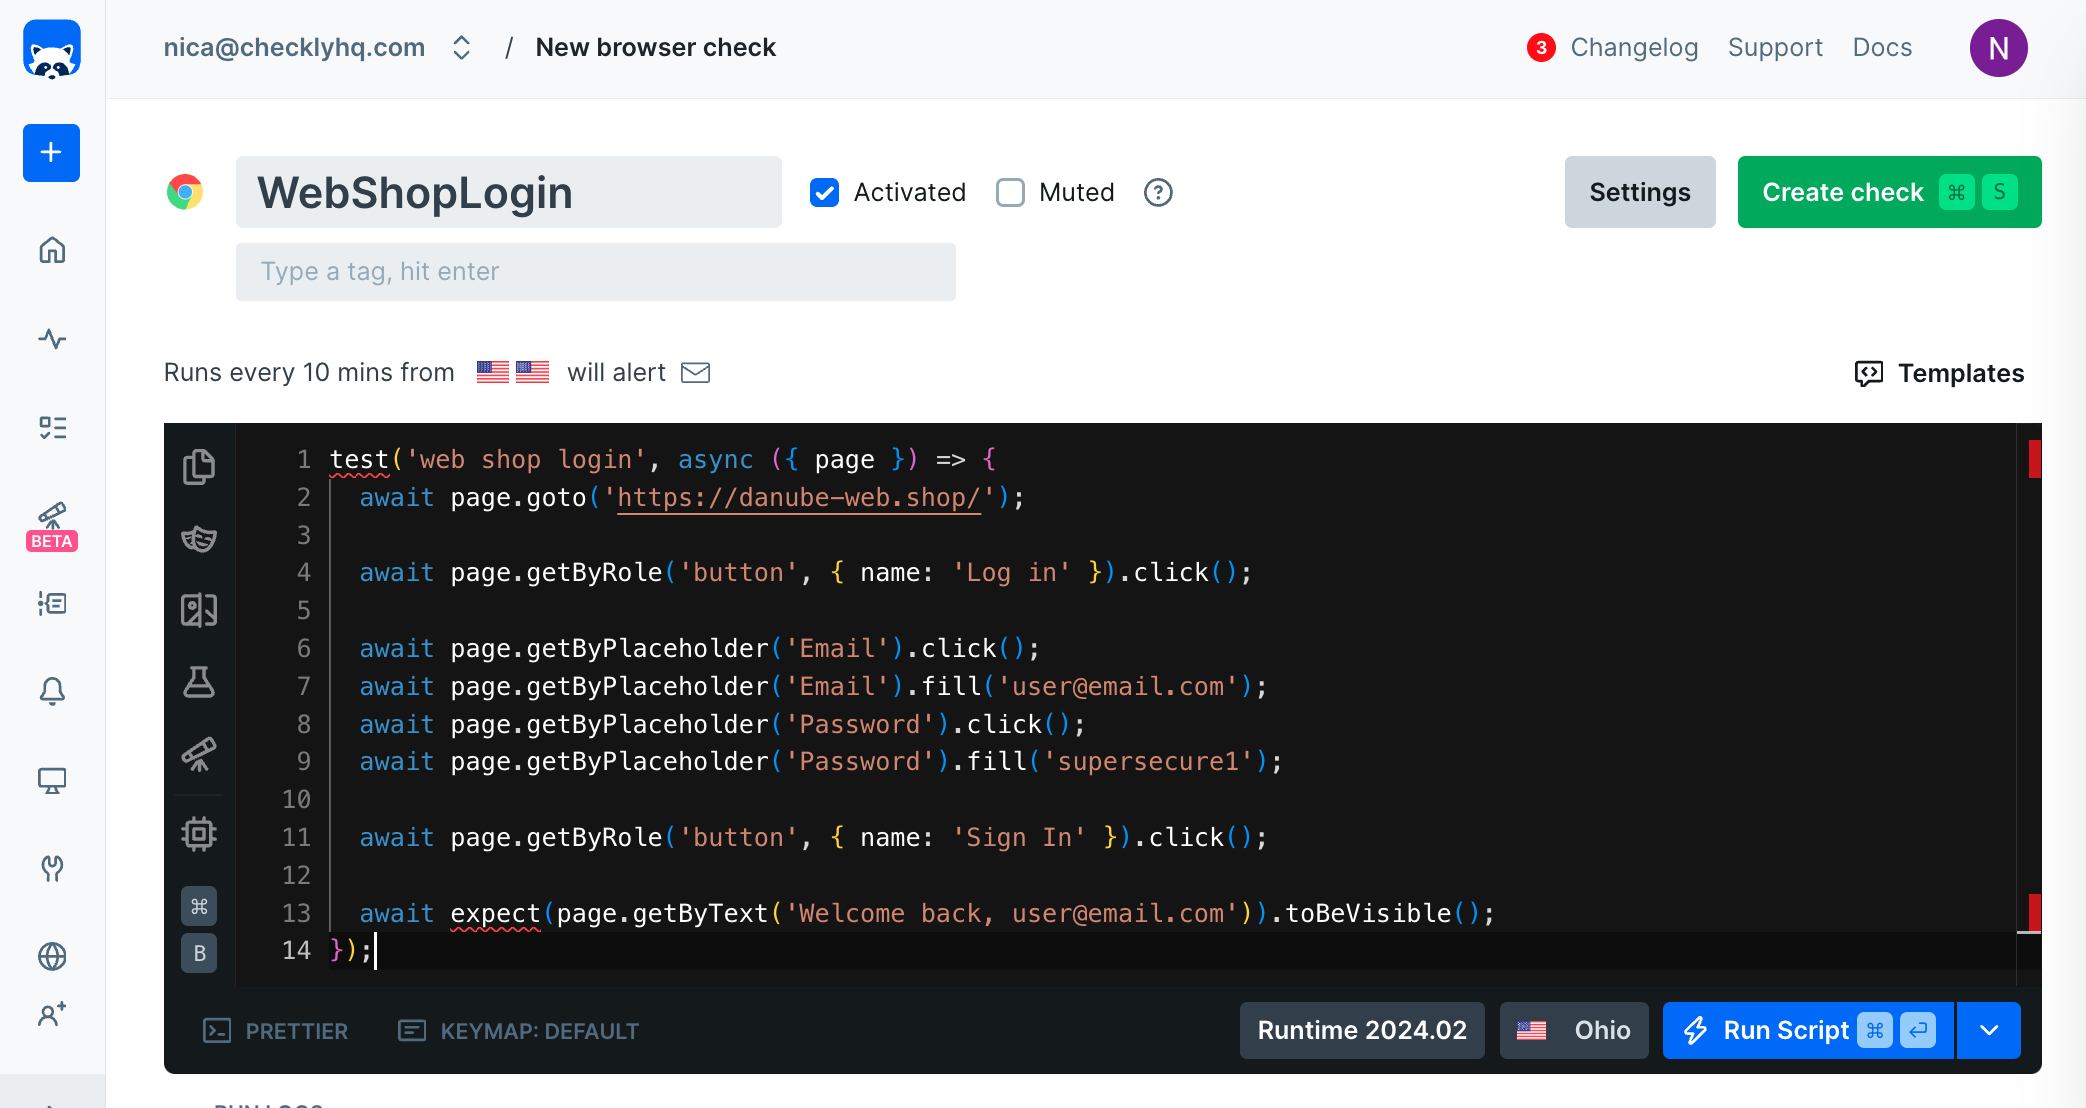
On-demand checking
Active monitoring and event-triggered testing do not exclude one another. You might want to have checks kicked off every time you deploy to production, or on every merge, PR or commit, or you might also want to run against your staging or development server. The choice has to be made based on your workflow and on your automation strategy.CI/CD
Tests can be kicked off of CI pipelines. You might want to use different hooks (for e.g. smoke vs regression testing) in different stages and against different targets. Checkly supports all major CI servers.Develop-preview-test
If you are using provider like Vercel, you can automatically trigger your checks to run on deployed PRs, too, to reap the benefits of the develop-preview-test approach.Benefits of implementing end-to-end monitoring
Now, let’s see what benefits you will experience if you decide to implement end-to-end monitoring.Improved user experience
End-to-end monitoring identifies issues before they impact users, ensuring smooth and reliable interactions. This proactive detection boosts customer satisfaction and loyalty. Enhanced user experience directly translates to increased engagement and retention rates.Better operational efficiency
By offering a complete system view, end-to-end monitoring quickly pinpoints and resolves bottlenecks. This reduces downtime and enhances productivity. Operational efficiency improvements lead to cost savings and better resource allocation.Faster issue resolution
End-to-end monitoring means continuous monitoring, which enables rapid identification of root causes, reducing the time needed to address problems. This leads to quicker resolutions and minimizes disruptions. Faster issue resolution ensures continuous service availability and reliability.Actionable data
With data from various sources, end-to-end monitoring provides a holistic understanding of system performance. This broad perspective helps in making informed decisions and optimizing resources. Comprehensive insight allows for better planning and strategic improvements.Collaboration across teams
End-to-end monitoring fosters collaboration among developers, network engineers, and non-technical staff. This unified approach ensures all stakeholders work together to maintain system health and improve performance. Collaborative efforts lead to more innovative solutions and streamlined processes.Tools for end-to-end monitoring
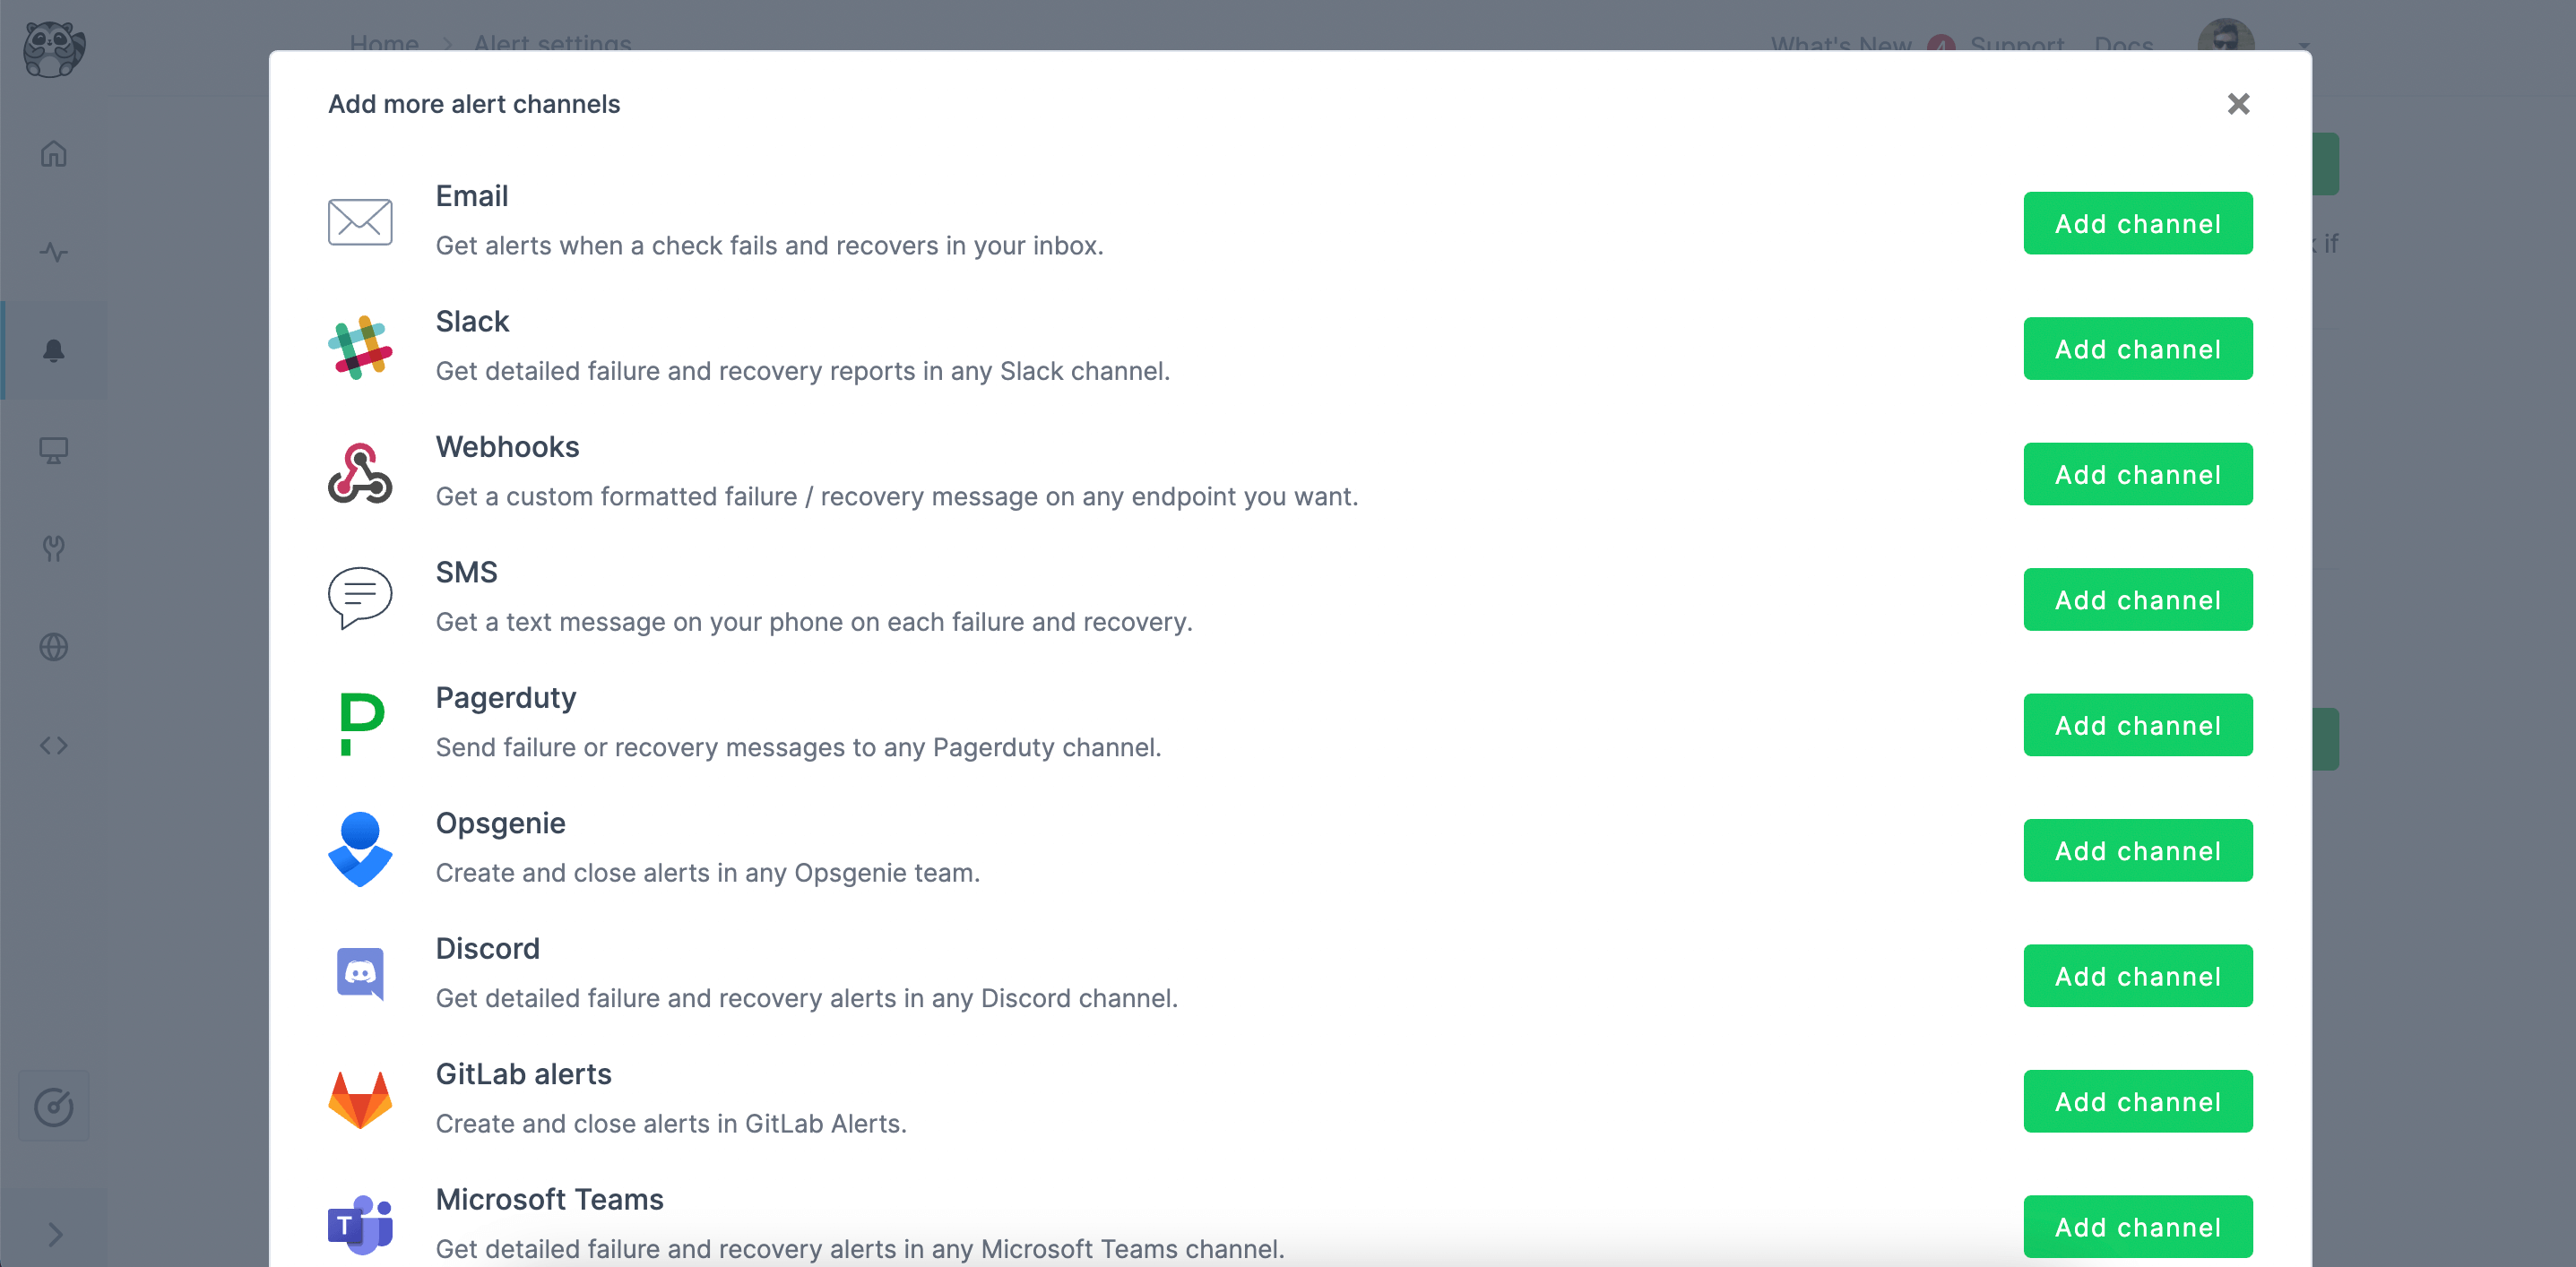
There are countless tools out there that perform some type of end-to-end monitoring. Here, we’re covering some of them:Application Performance Monitoring (APM) Tools
Tools: New Relic, Dynatrace, AppDynamics APM focuses on tracking the performance and availability of software applications. It monitors key metrics such as response times, transaction throughput, error rates, and user satisfaction. APM helps identify performance bottlenecks and ensures applications run smoothly, providing a better user experience.Infrastructure Monitoring Tools
Tools: Zabbix, Datadog, Prometheus Infrastructure monitoring involves overseeing the physical and virtual components of an IT environment, such as servers, storage systems, and virtualization platforms. It checks the status, performance, and resource utilization of these components to ensure optimal operation and prevent downtime.Real User Monitoring (RUM)
Tools: New Relic Browser, Dynatrace RUM RUM tracks the actual interactions of users with a website or application in real-time. It captures data on load times, errors, and user behavior to provide insights into the real-world performance of digital assets. RUM helps identify areas for improvement based on actual user experiences. Since RUM is capturing data on every user every time, the infrastructure cost is nontrivial and there’s always the risk of impacting performance for usersSynthetic Monitoring Tools
Tools: Checkly, Pingdom, Datadog Synthetic monitoring uses scripted tests to simulate user interactions with applications and services. It helps identify performance issues and availability problems before they impact real users. This proactive approach ensures continuous service reliability and performance.4 Best practices for effective end-to-end monitoring
Establishing clear objectives and KPIs
Define specific goals and key performance indicators (KPIs) to measure the success of your monitoring strategy. This ensures that monitoring efforts are aligned with business objectives and provides a clear framework for evaluating performance.Collaborative approach: developers, security, operations, and business teams
Foster collaboration among developers, security, operations, and business teams to ensure comprehensive monitoring coverage. This multidisciplinary approach helps identify and address issues from multiple perspectives, improving overall system health.Continuous monitoring and regular performance reviews
Implement continuous monitoring to detect and address issues in real time. Regularly review performance data to identify trends, optimize resources, and make informed decisions for future improvements.Integrating end-to-end monitoring into DevOps and agile workflows
Embed end-to-end monitoring into DevOps and agile workflows to ensure seamless integration and real-time feedback. This approach promotes a proactive monitoring culture and accelerates the identification and resolution of issues. The best way to do this is to adopt Monitoring as Code (MaC), and implement your monitors directly in your CI/CD, from pre-prod to prod. Checkly’s CLI enables you to build and maintain your monitors from your existing code base, integrating with cutting-edge testing and monitoring tools like Playwright, Grafana, Prometheus, Coralogix, and others.End-to-end Monitoring Pitfalls
We learned things the hard way so you do not have to. When starting out, keep an eye out for the following pitfalls:- Non-independent tests: tests that rely on one another in any way (e.g. order of execution, test data) are hard to parallelise, resulting in longer execution times and potentially higher flakiness. Keep your tests independent.
- Long, unfocused tests: checking too much in a single test will make failures harder to debug. Break it up instead, and enjoy the added parallelisation.
- Messing up your own metrics, KPIs: remember, if you are not running against production, you want to make sure your E2E monitoring checks or tests are filtered out of your analytics. This is rather easy to do, with most headless browser tools normally identifying themselves as such from the start.
How to deploy end-to-end monitoring with Checkly
Now, let’s put the stuff we talked about in action. Deploying end-to-end monitoring with Checkly is super simple: Step 1: Setting Up a Checkly Account Ensure you have an active Checkly account. If not, sign up. The default free Team trial lasts for 14 days. To access advanced features beyond the trial, subscribe to a pricing plan based on your needs. Step 2: Setting Up Checkly in Repository After completing the installation steps, open a terminal in the directory of your project and run the following command:npx checkly init
This command will bootstrap your repository with the basics needed to start using Checkly MaC in your project.
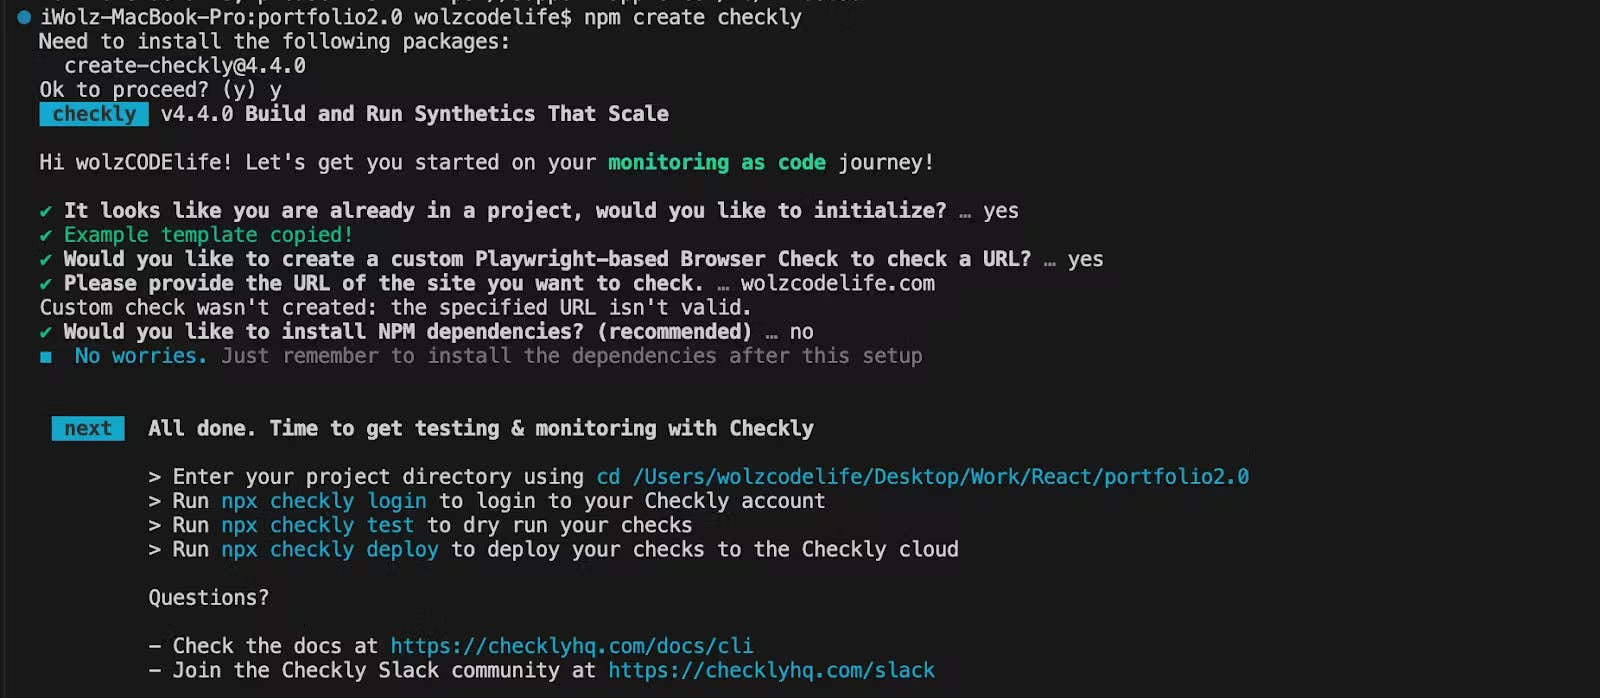
npx checkly login
You can choose to log in from the browser or in your terminal. After logging in, you’ll be able to update Checkly Checks from your local machine as long as you’re connected to the internet.
Step 3: Writing Your Monitoring Scripts
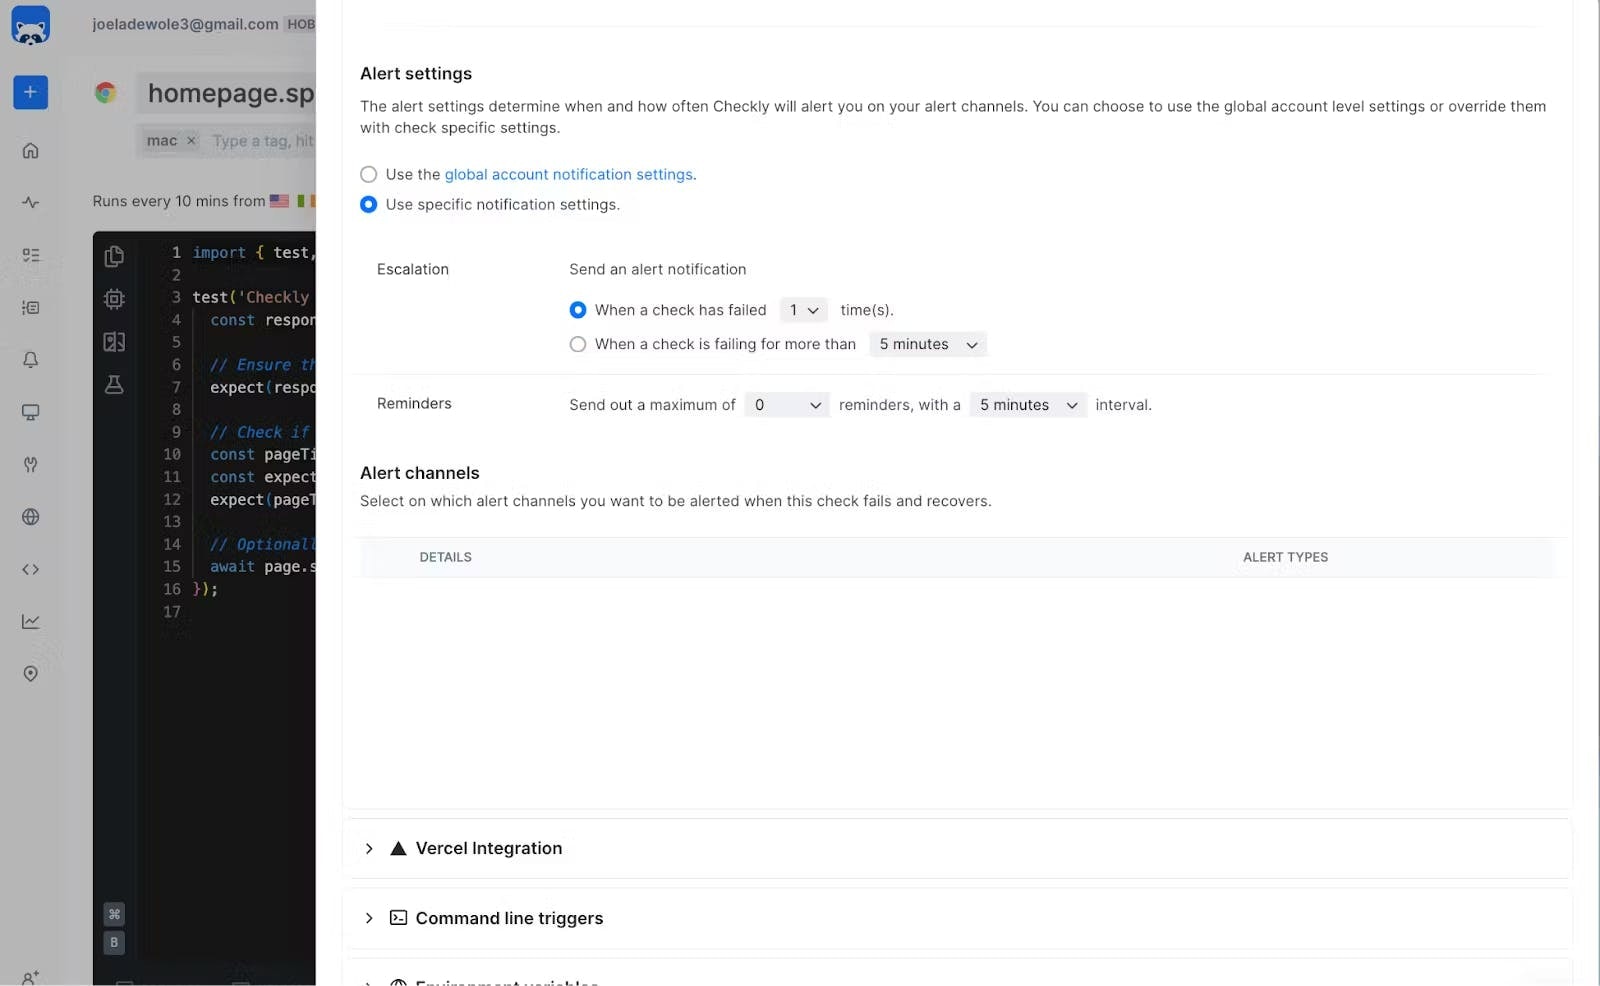
In your development environment, write JavaScript/TypeScript tests for your code updates, similar to unit tests. We typically use the Playwright testing framework in the .spec.ts or .check.ts file.
Consider a scenario where you want to monitor the title of the Checkly documentation and take a screenshot of the page. To do this, replace the code in the homepage.spec.ts with the following:
homepage.spec.ts
page.goto method to navigate to the specified URL (‘https://www.checklyhq.com/docs/browser-checks/’). The method returns a response object, which is stored in the response variable.
Then we use the expect function to assert that the HTTP status code of the response is less than 400. This is a way to ensure that the page is loaded successfully without any HTTP errors.
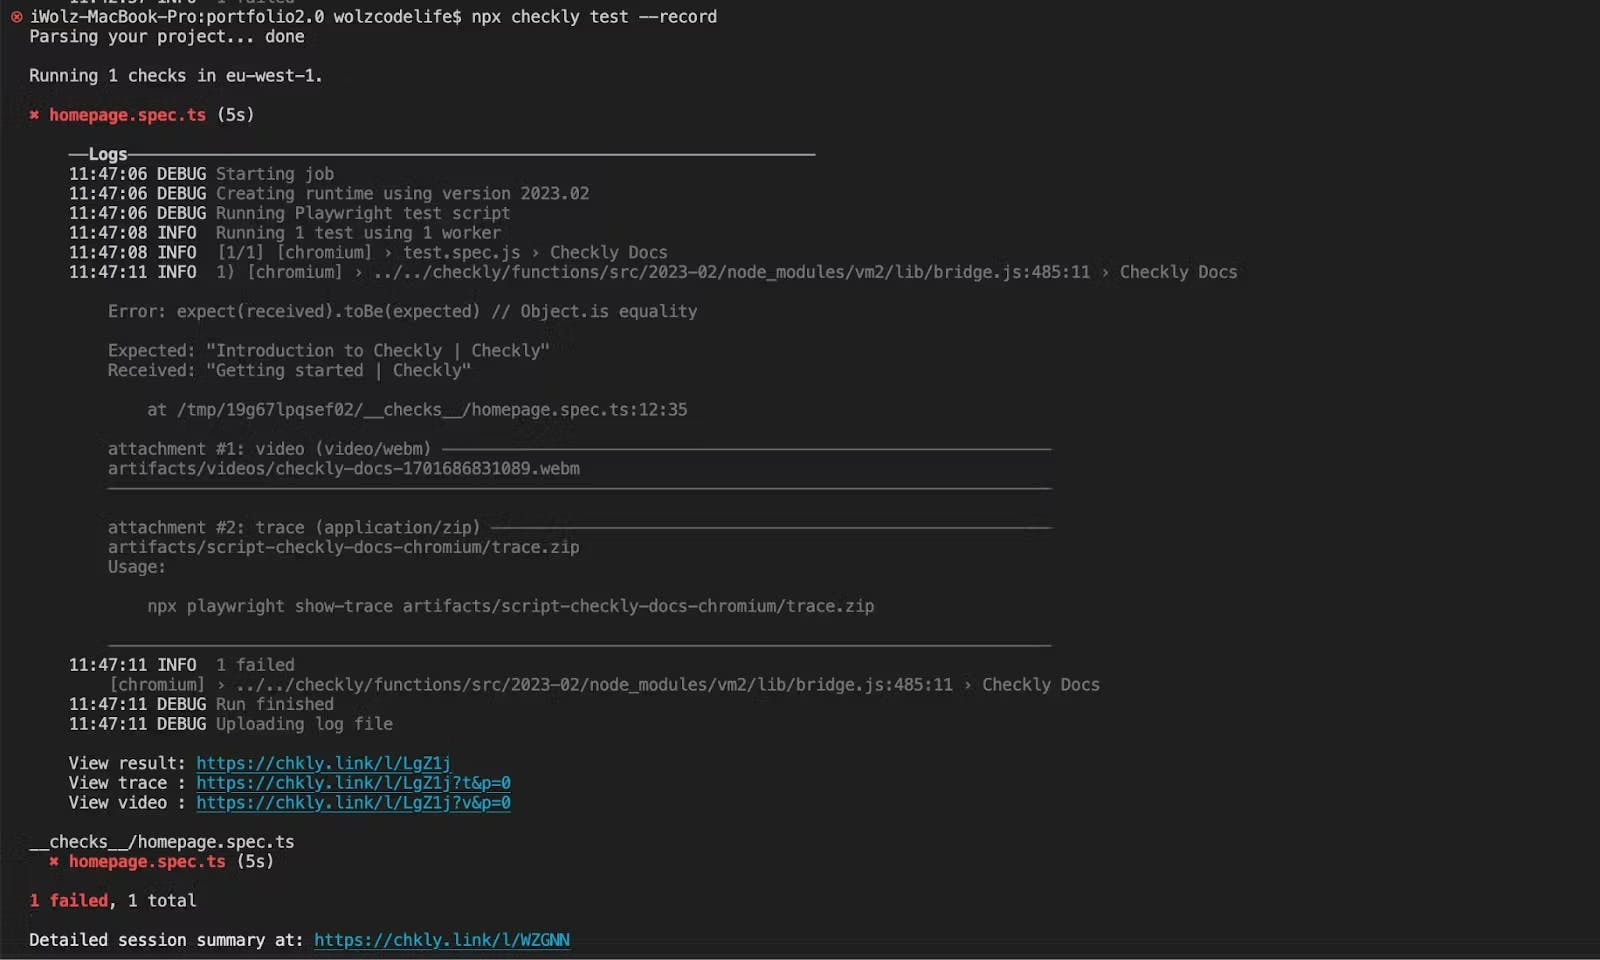
page.title() retrieves the title of the page and compares it with the expected title (‘Introduction to Checkly | Checkly’) using the expect function. This ensures that the page title matches the expected value.
Finally, we take a screenshot of the page and save it as ‘homepage.jpg’.
Step 4: Running Test Sessions
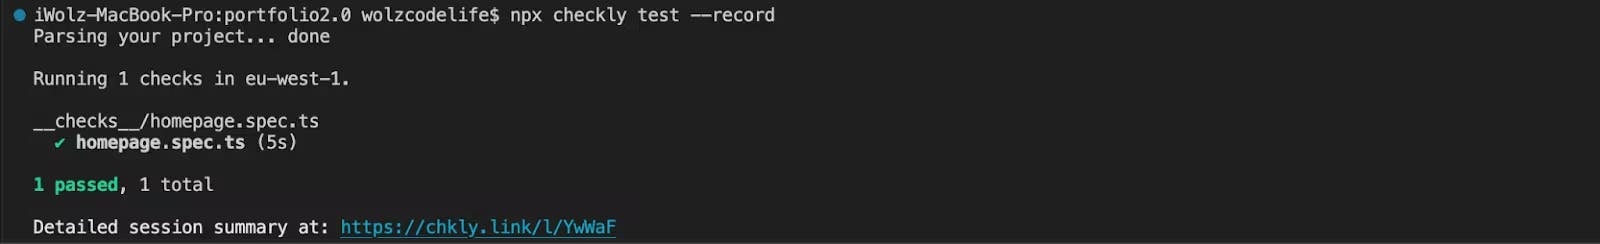
Now that we have our test scripts ready, let’s execute them. Run the following command in the terminal of your project repository to test your checks against Checkly’s infrastructure:
npx checkly test
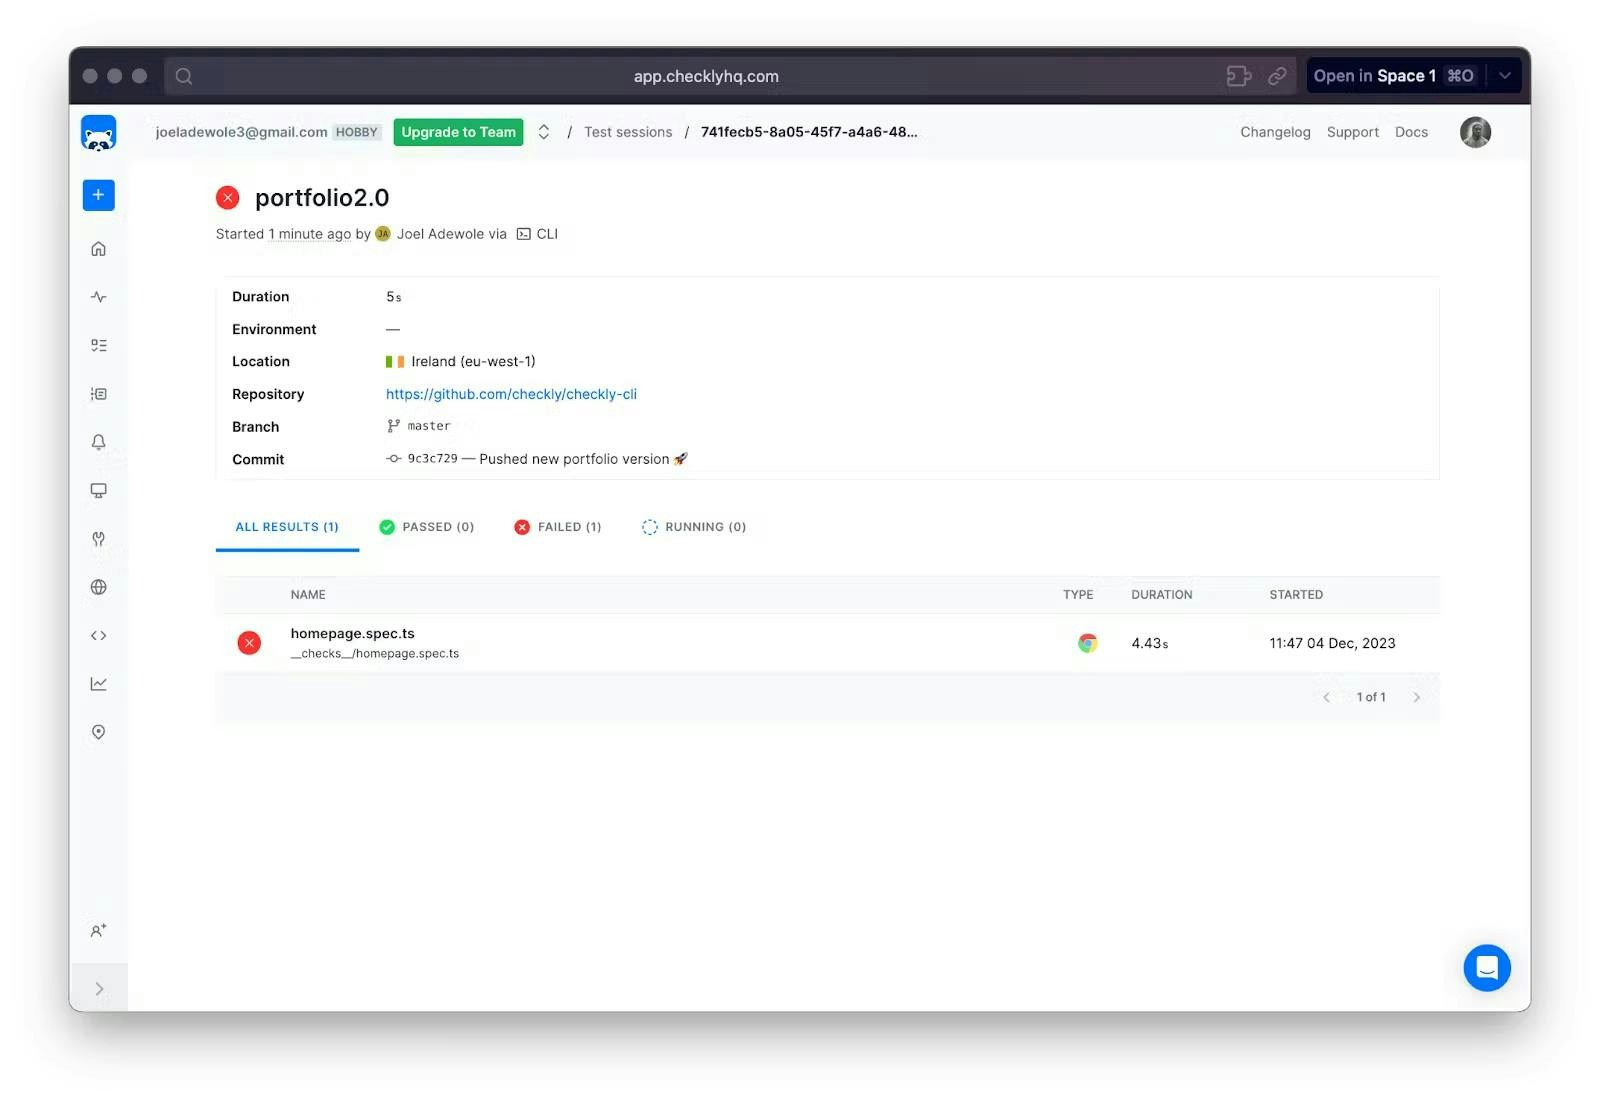
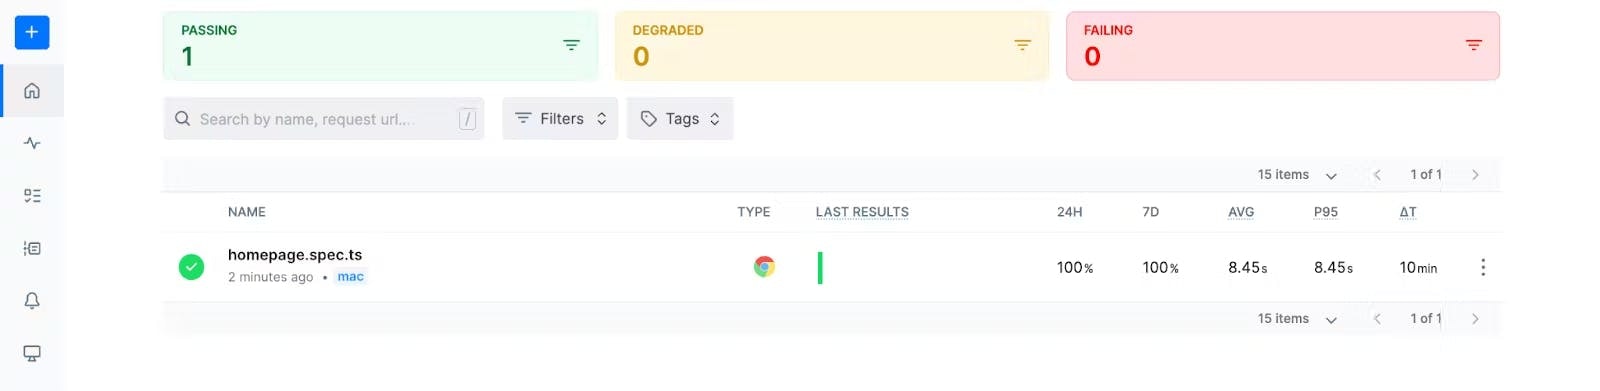
You can review the test session with full logging, videos and traces in the Checkly web interface.
Here is the result of the test we just executed:

npx checkly deploy
Once the deployment is complete, you’ll see a success message in your terminal, indicating that the project has been deployed to your Checkly account.
To verify this, navigate to the home section on the left side of the Checkly UI, and you’ll find the project with the name of the test script from your local repository.
Conclusion
Implementing end-to-end monitoring is crucial for maintaining system health, enhancing user experience, and improving operational efficiency. By establishing clear objectives, fostering collaboration across teams, continuously monitoring performance, and integrating monitoring into DevOps workflows, businesses can proactively identify and resolve issues, ensuring optimal performance and customer satisfaction.Read More
Monitoring as code
Why should the way we manage monitoring be any different?
Checkly CLI
Understand monitoring as code (MaC) via our Checkly CLI.
Setup scripts for API monitoring
Setup scripts are a fundamental tool to tailor API checks to your own target endpoints.