Diagnosing a problem based on the pattern: interpreting a check dashboard
Whenever you’re working a technical incident, it’s tempting to go to the most detailed information first: checking traces from individual checks is a bit like starting incident investigation in application logs: the answer is in there, but there’s a lot of information to sift through. How can we look at high-level dashboards showing multiple check runs, and start to diagnose possible causes? To emphasize: none of the patterns mentioned here are proof positive, and you should always take the second step of looking into the check’s traces. That detailed analysis is covered in the second half of this guide.Identifying a growing problem
When you’re looking at the pattern of failures, one question you’d like to answer is: ‘did [x] code release cause this failure?’ To answer this quickly, look for a pattern like the one below, where a small problem grows with time: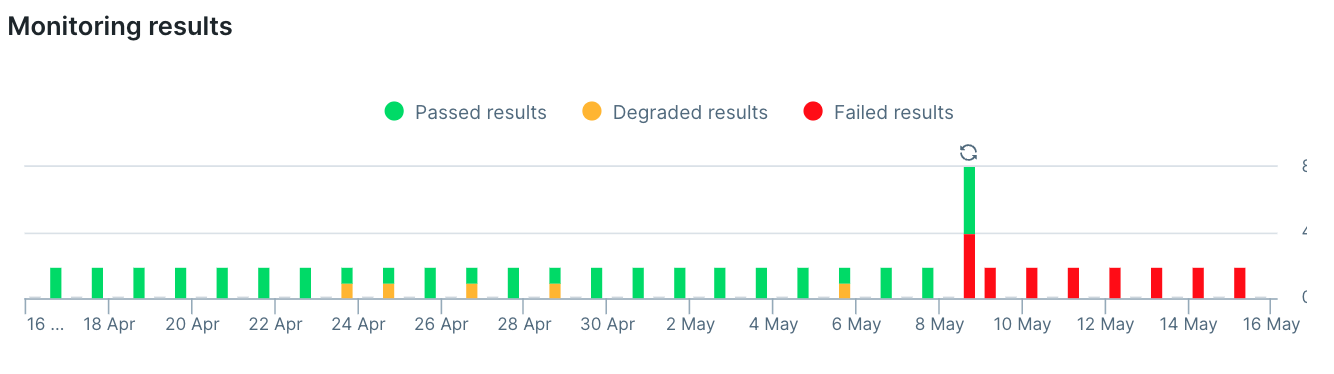
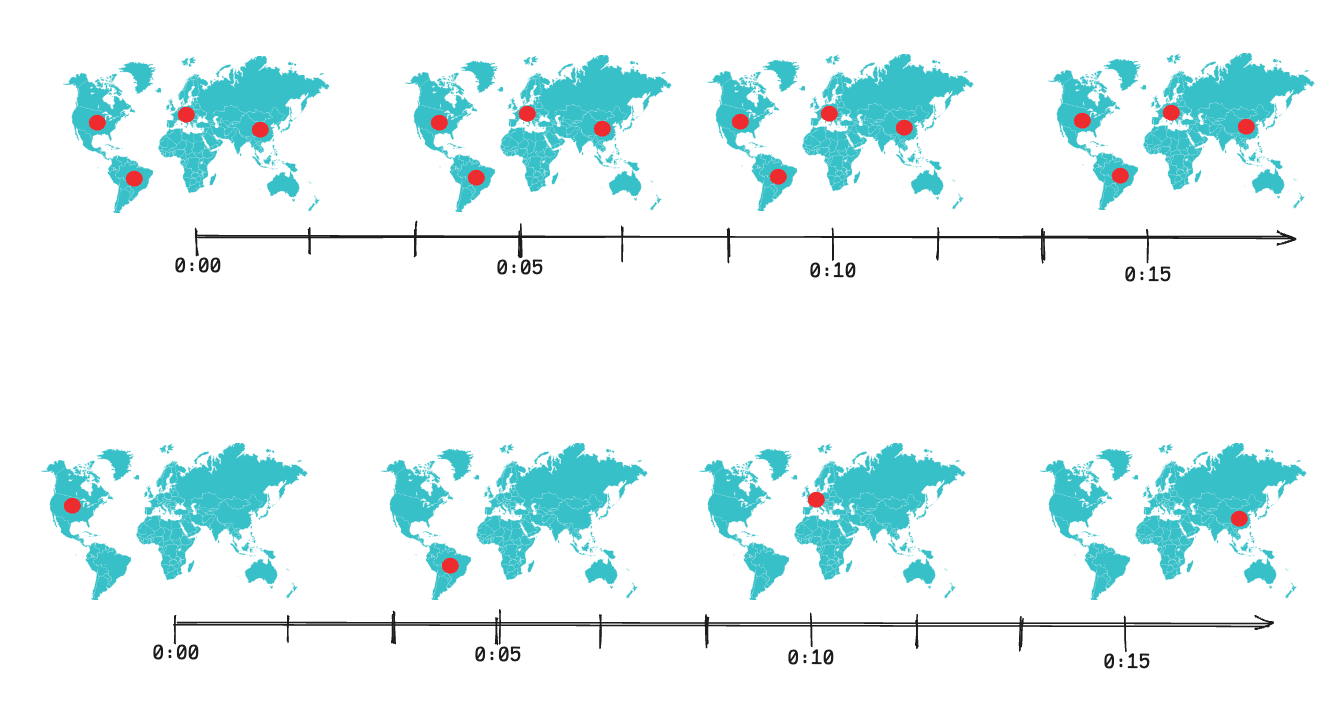
The comb: failures with set intervals
In the chart below, this check is currently passing, but an oddly regular pattern of failures has been happening for some time. This indicates a common failure mode: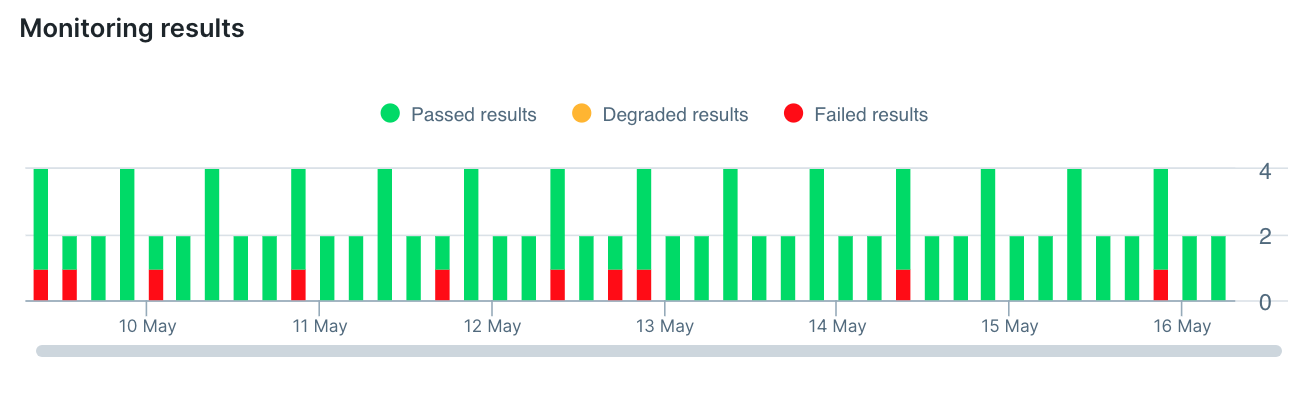
Diving in and finding the problem: beyond the video
Let’s start with a simple example of a failing test. In this case my web shop’s category view is supposed to look like this:
We all start by checking the video
Reader, I’ll level with you: the purpose of this article is to get you to do more than checking the video on a failed check. But before I offer more routes to check I wish to acknowledge we all start by checking the video. A video has the great benefit of showing both the failure and the ‘normal’ behavior of the check up until that point, it reminds us what page we were loading and there’s a good chance that the failure is visual enough to show up right away.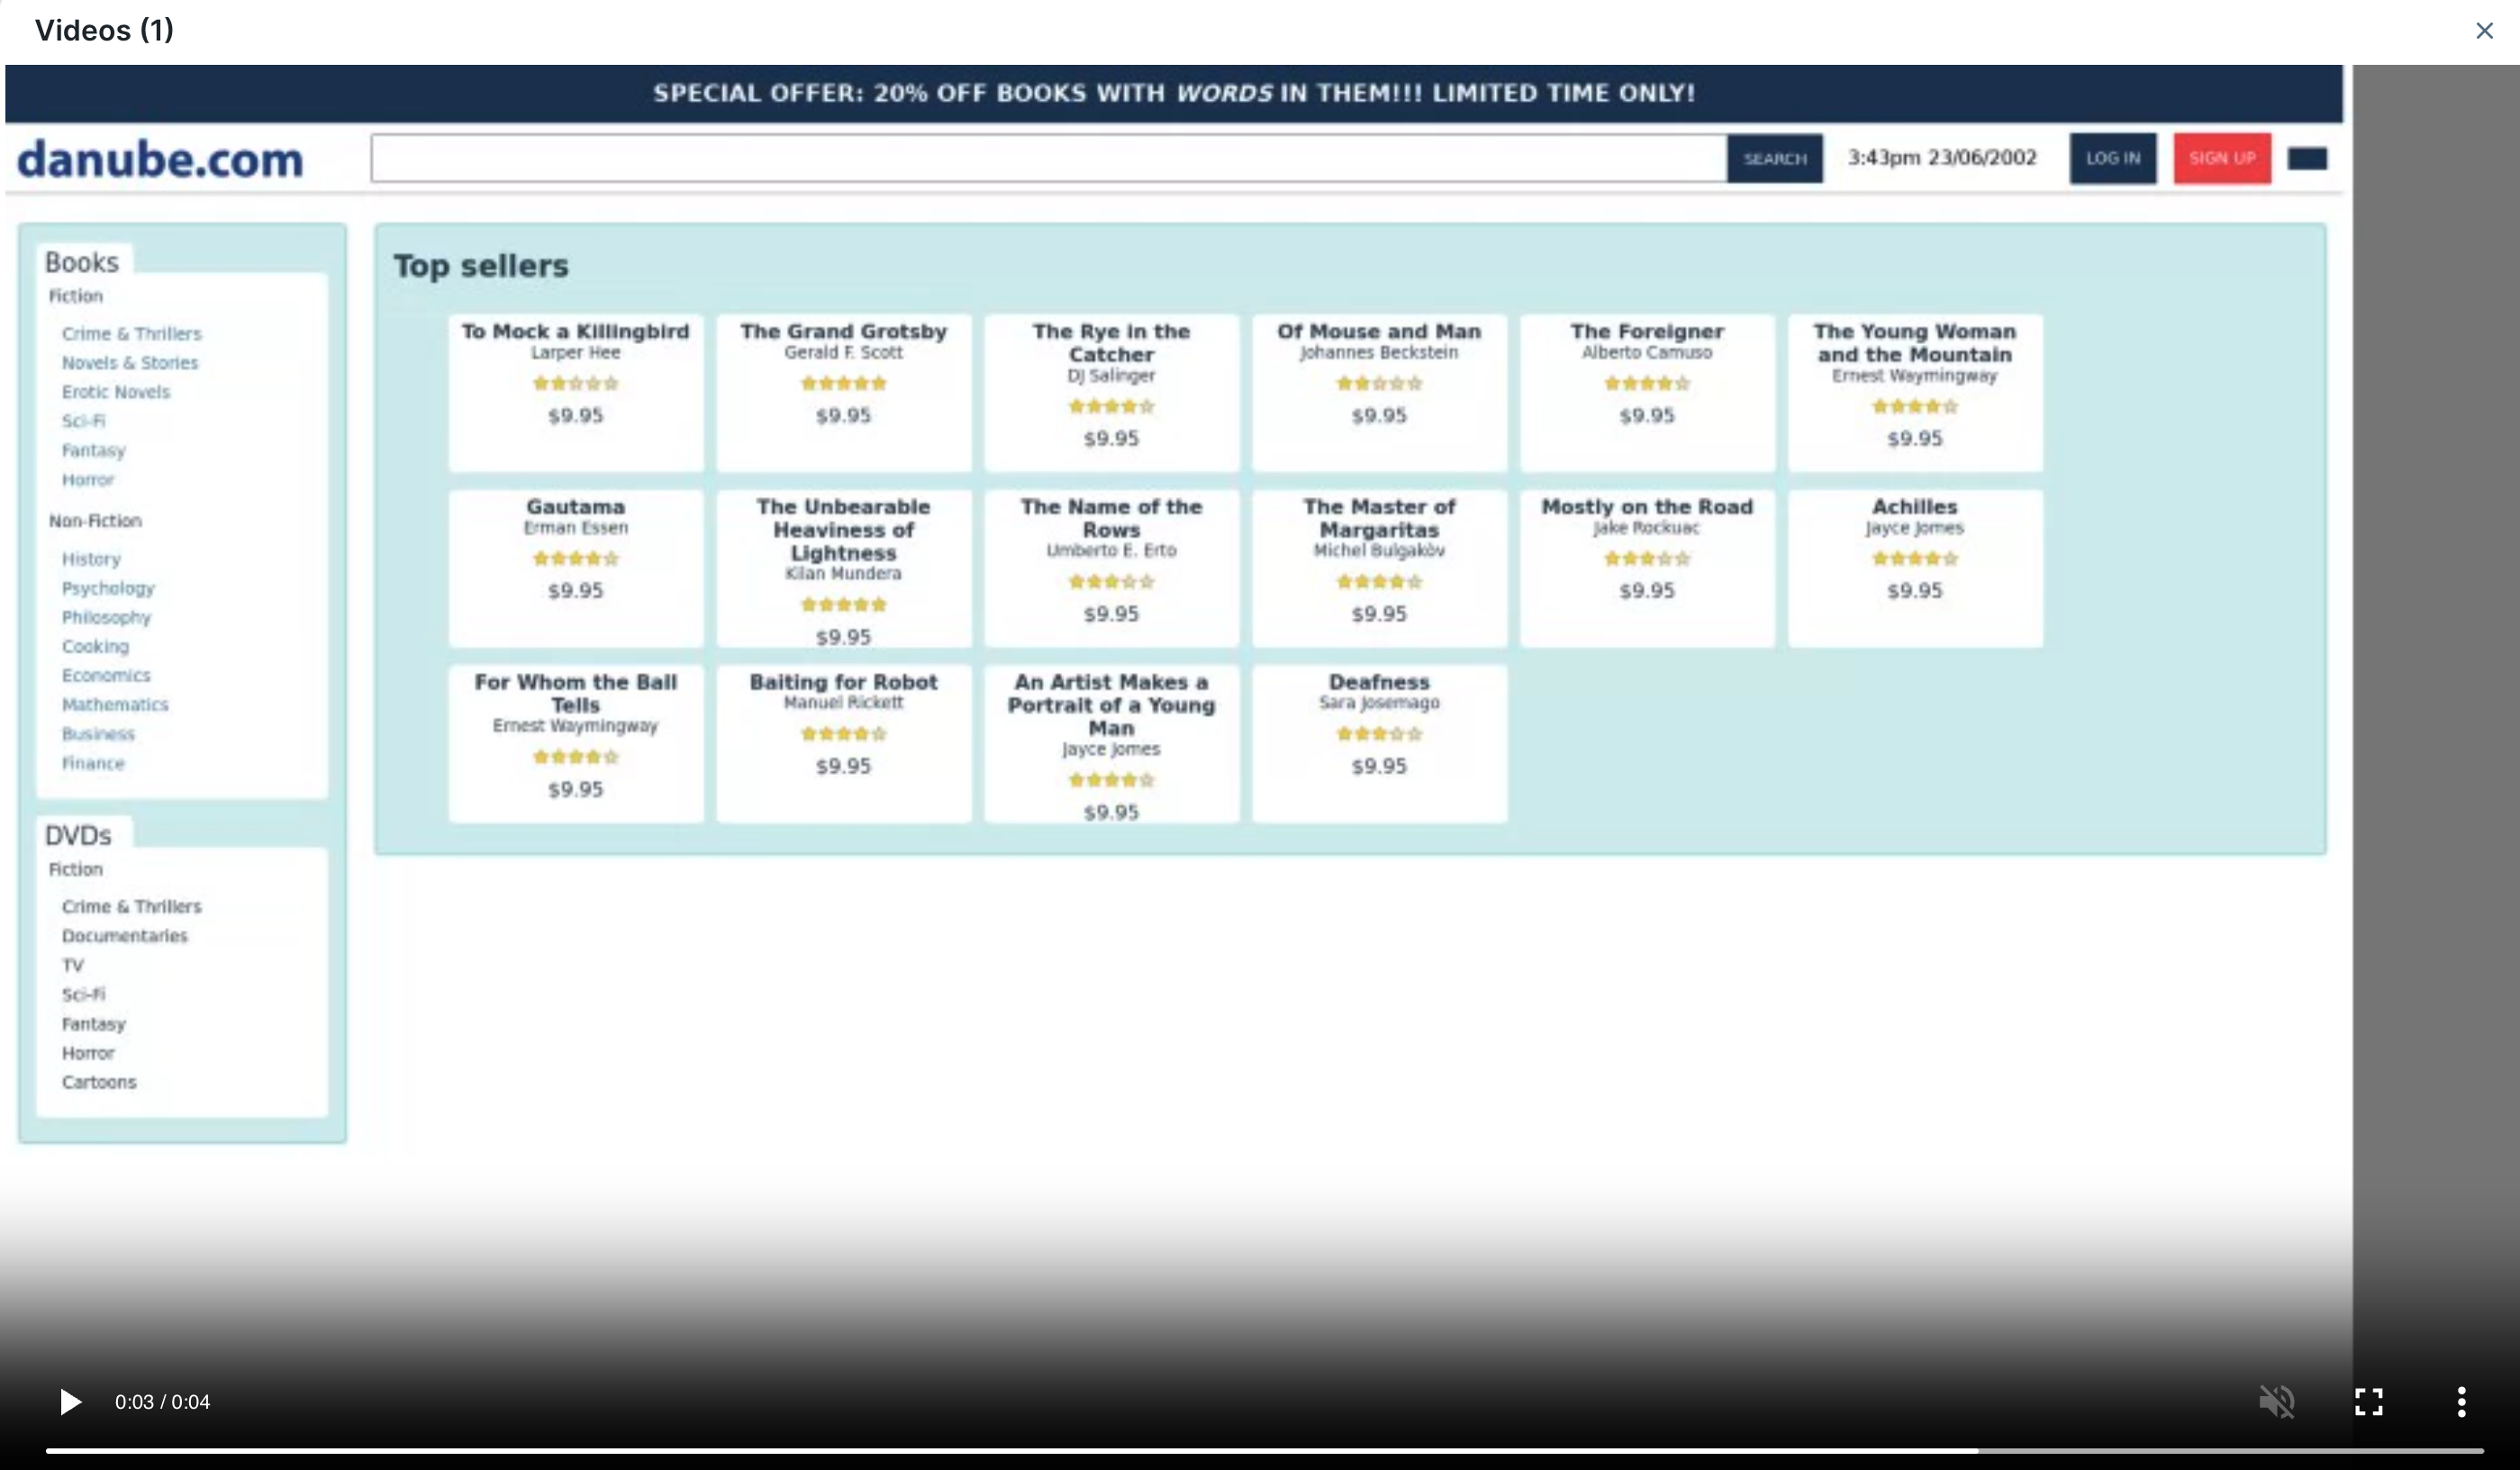
What loaded and what didn’t: the network tab
The network tab is often a good next step when the video didn’t have our answer: without loading the full trace it’s a quick way to see if anything failed to load or loaded very slowly.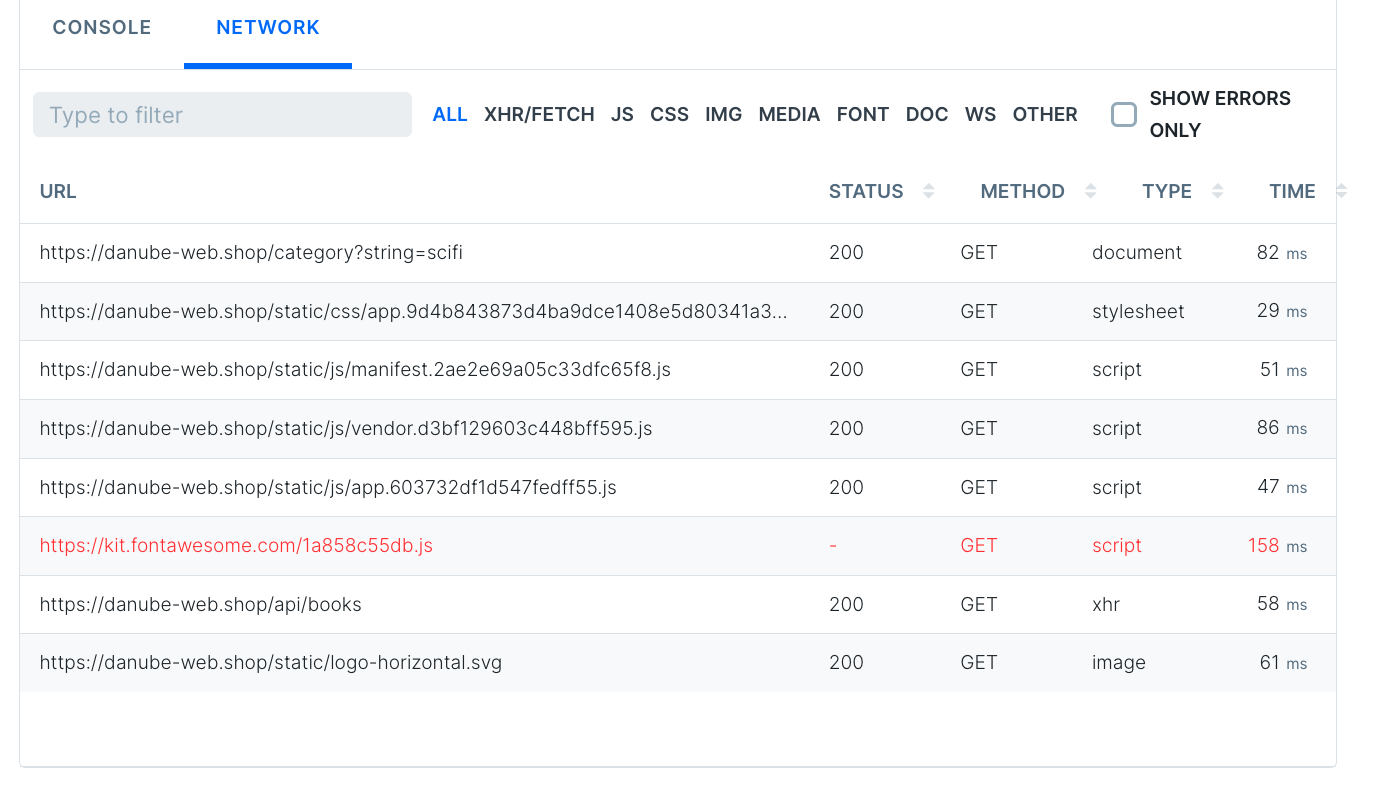
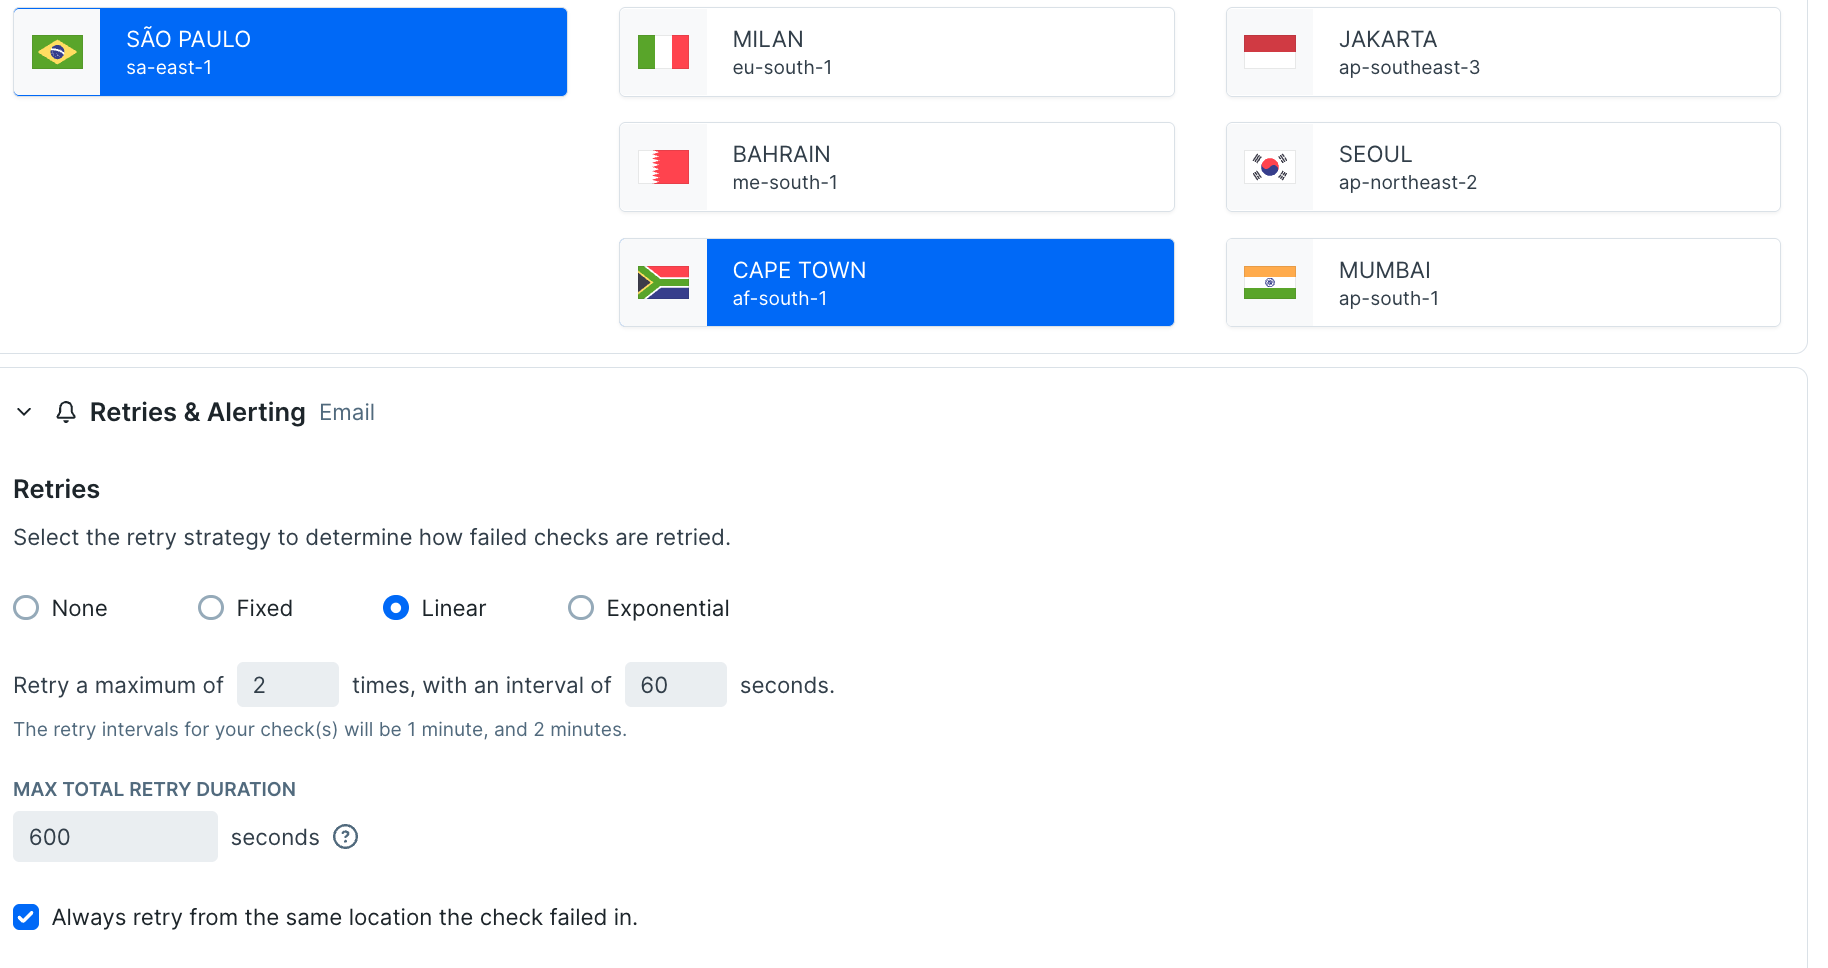
Check each retry - viewing past attempts
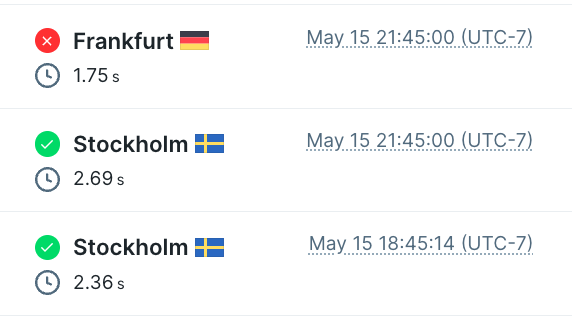
If you’re investigating a check with extremely strange or stochastic results, you might wonder ‘this check retried twice before it reported failure, how did those other check runs go?’ We know since we got an alert the other check runs also failed, but to go deeper just use the drop-down on the top left of the check run viewer.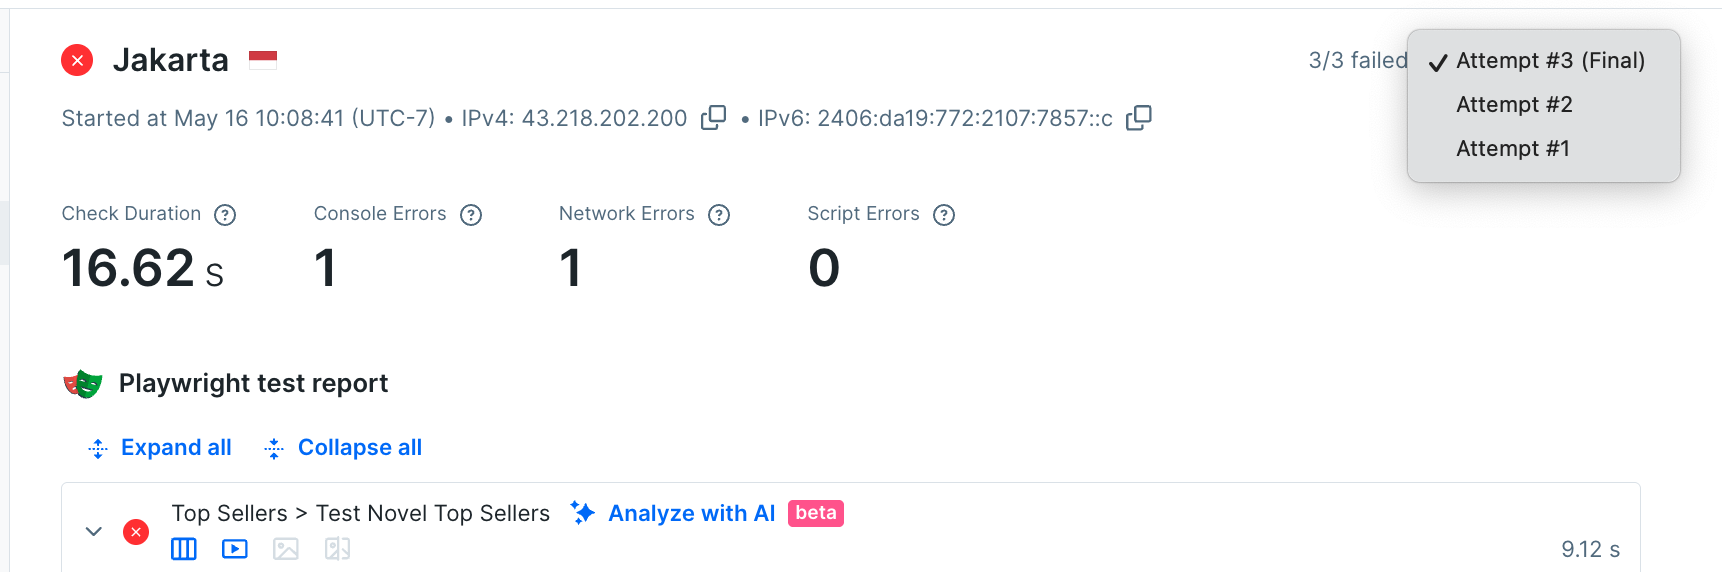
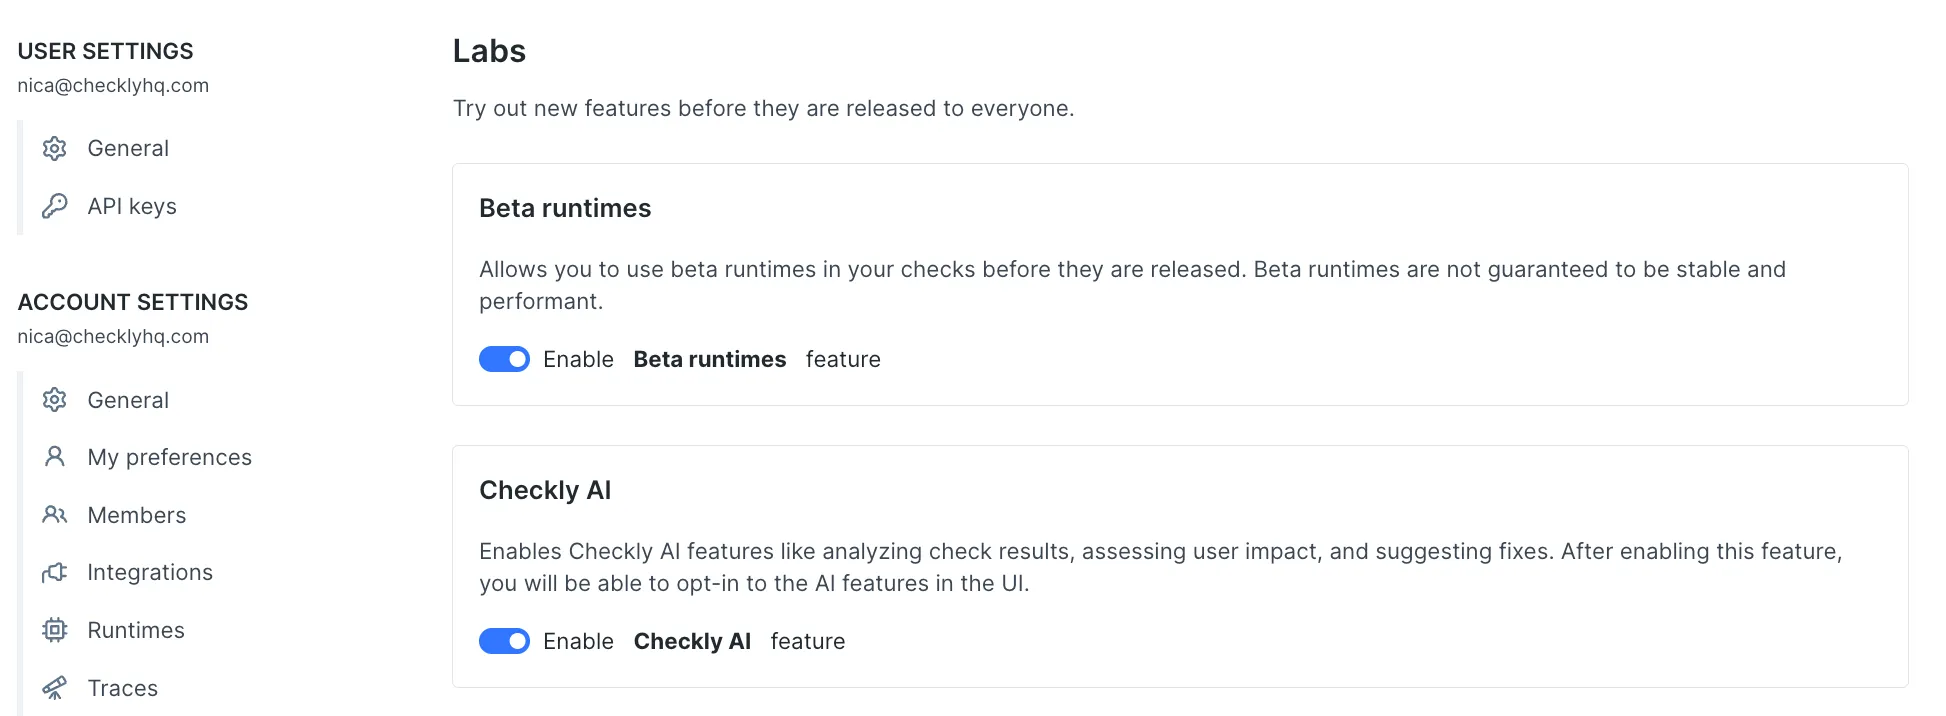
Try the new AI explainer
When trying to interpret a failure, especially during a late night incident response process, it’s helpful to get a summary of how this failure affects users, written in plain English. Translating technical error messages into a more readable format is something that language models excel at, so you may want to try out our AI Impact Analysis tool. For this failure, the analysis looks pretty spot on: users can’t see a section labelled ‘bottom sellers’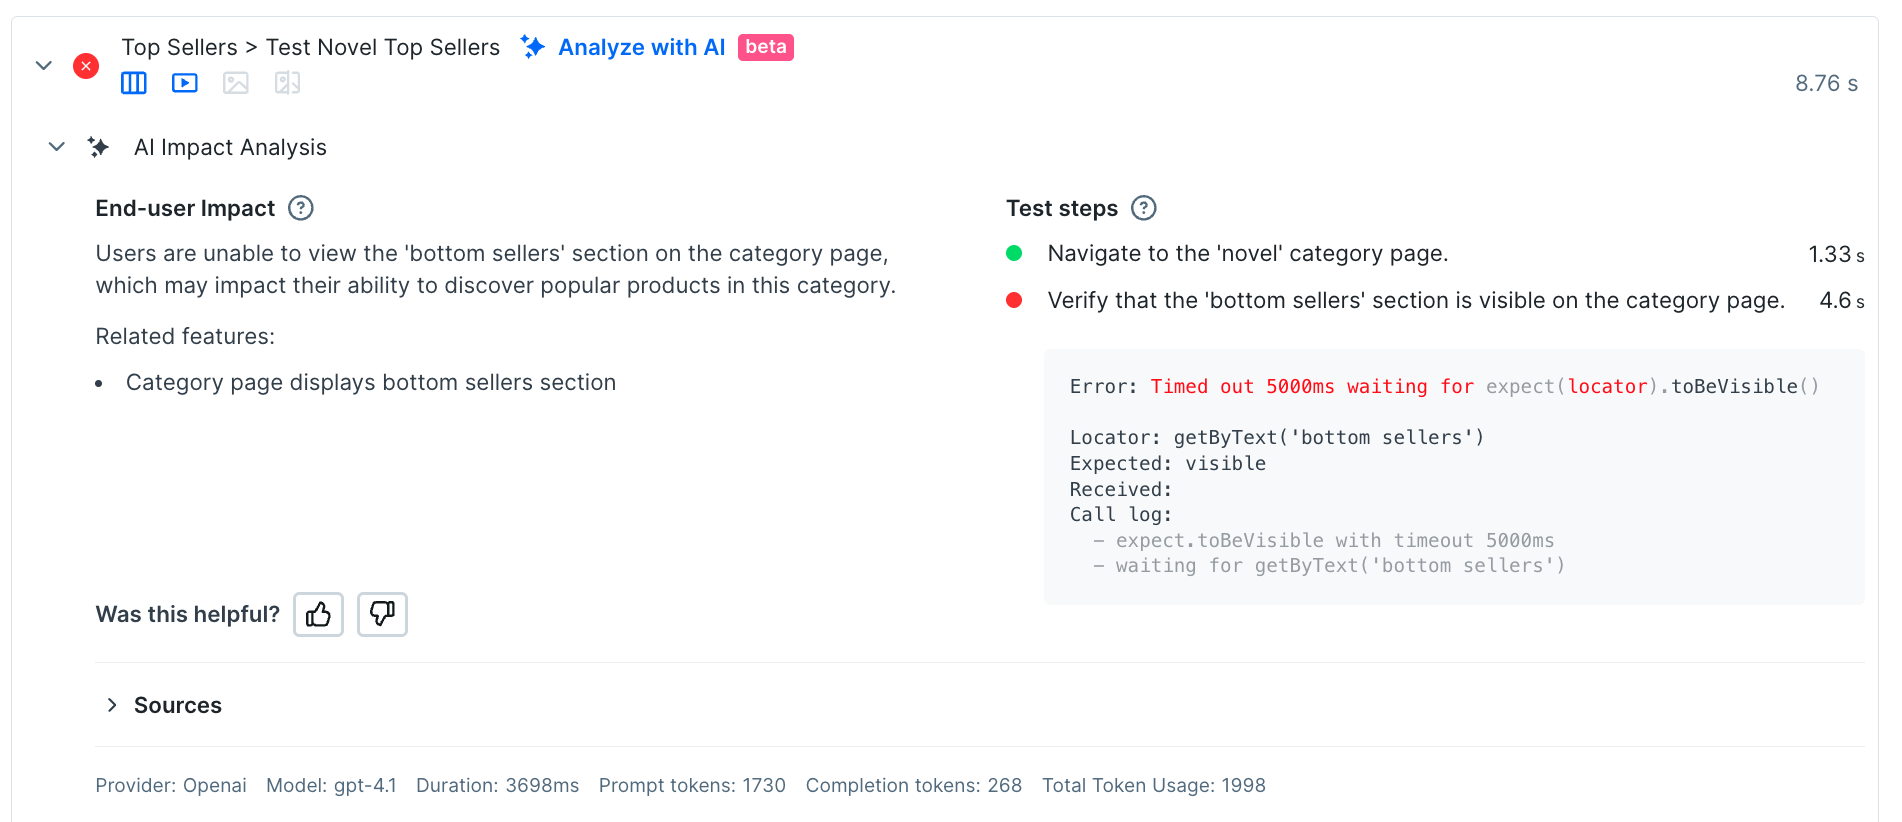
Pro tools: the full trace
How many times has a user reported a failure somewhere on your site, and you’ve wished they could send a full trace from their dev tools? In some support teams, asking for this browser trace is a common first step in the diagnosis process. For problems detected early with Checkly, the same detailed information is available as soon as you get an alert. Click the trace button to get the whole story.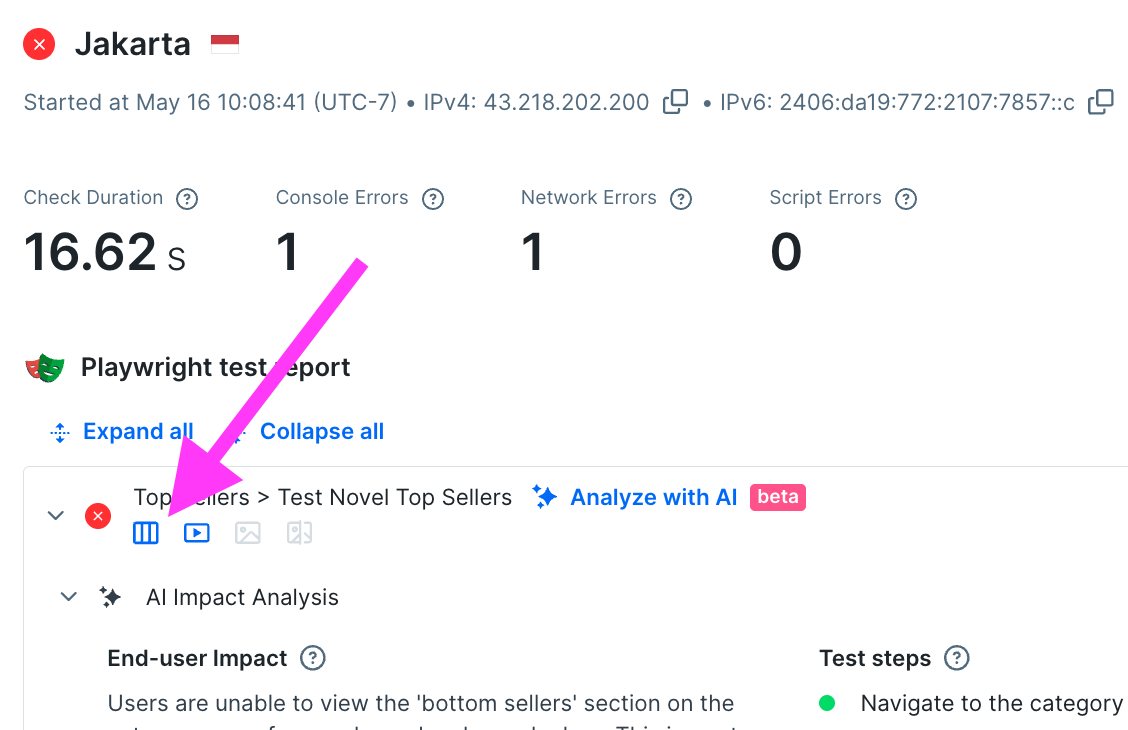
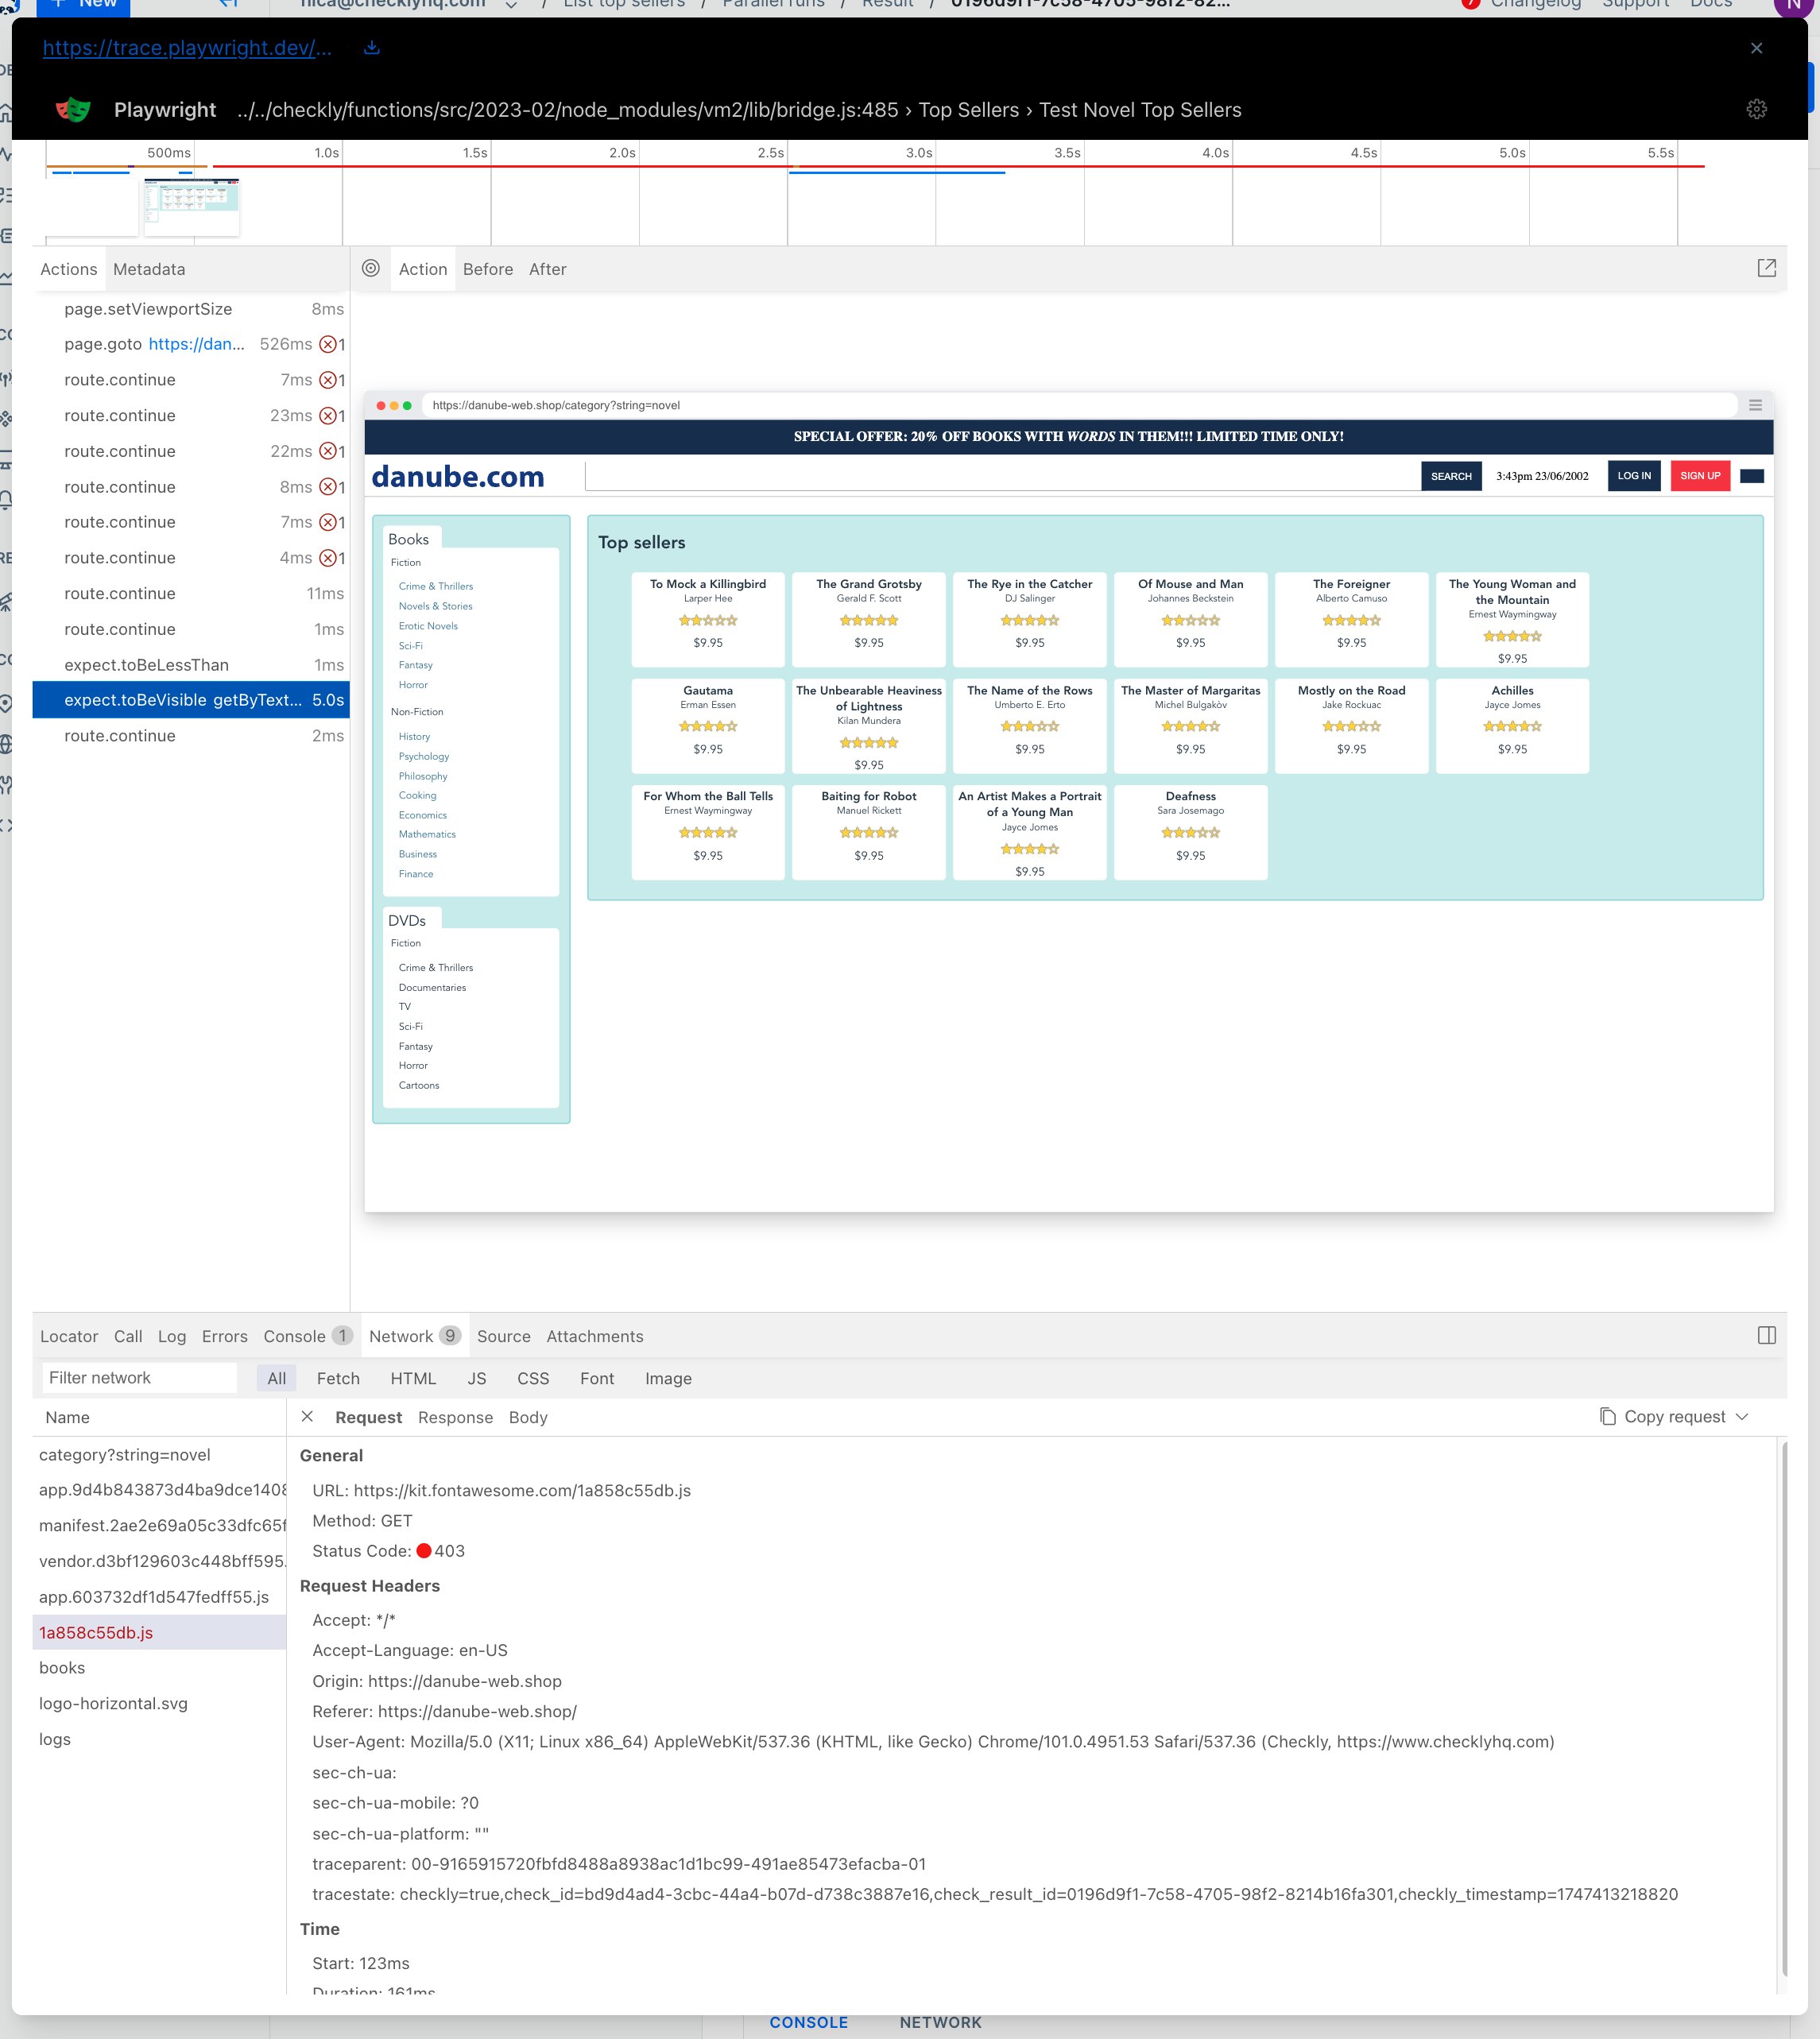
- The test is broken down into components, and you can scroll through and see what had loaded as each test was happening.
- Screenshots of the page as loads and formats. You can check a screenshot for each assertion.
- The network tab that was so useful previously is available here.
- The console, errors, and log messages from the browser
- The Call tab which shows exactly how the current playwright call was interpreted. This is so interesting it deserves its own screenshot:
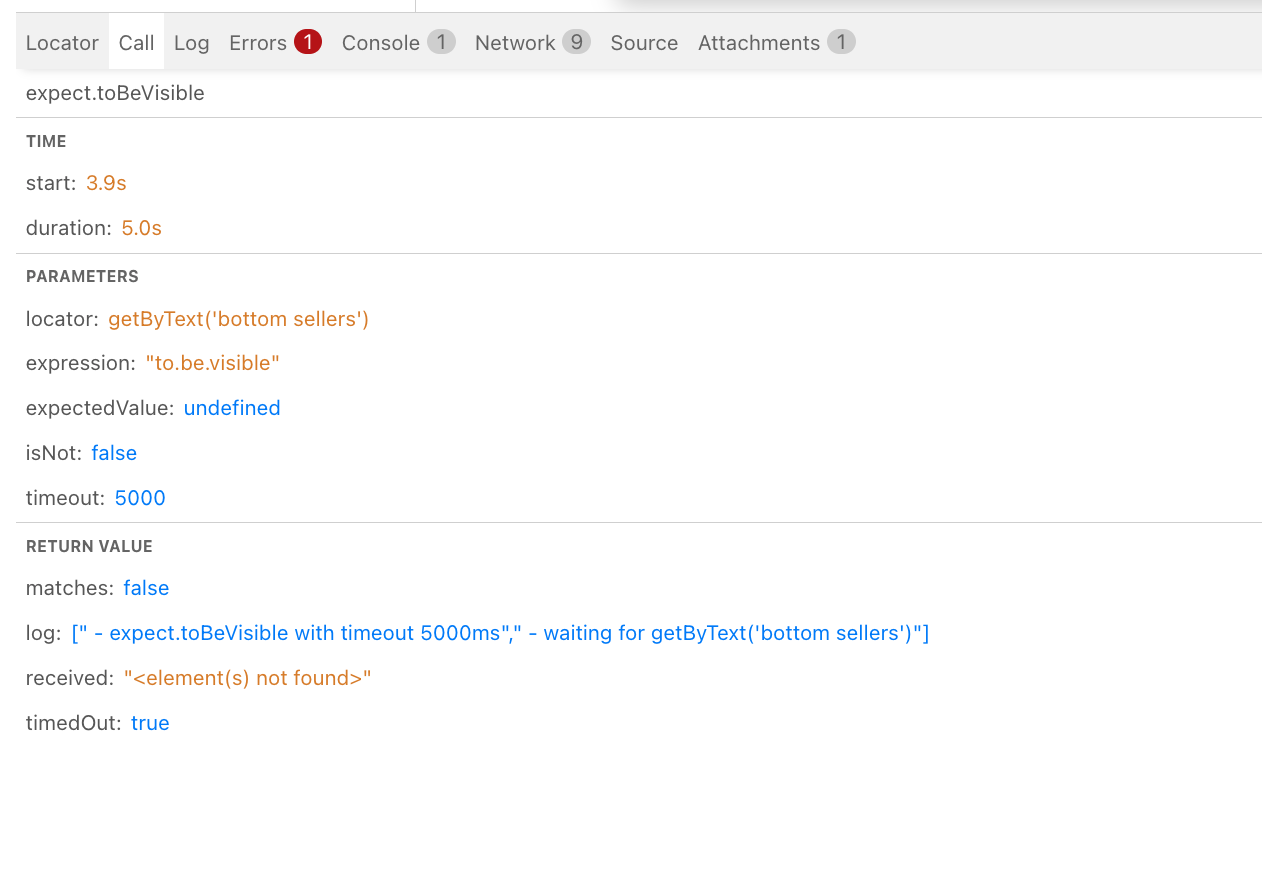
expect.toBeVisible call to fail: probably not! Remember that Playwright’s auto-waiting ensures that the element will be found as soon as it loads, and your test won’t fail just because of a flash of unformatted content.