-
Make sure that you have Tempo running on your Grafana Cloud Instance at
yourOrganization.grafana.net. Find it at Connections > Search for Tempo > Check if Tempo Data source is marked as installed. -
In Grafana Cloud (
grafana.com/orgs/yourOrganization), head over to Connections > Add new connection > OpenTelemetry (OTLP).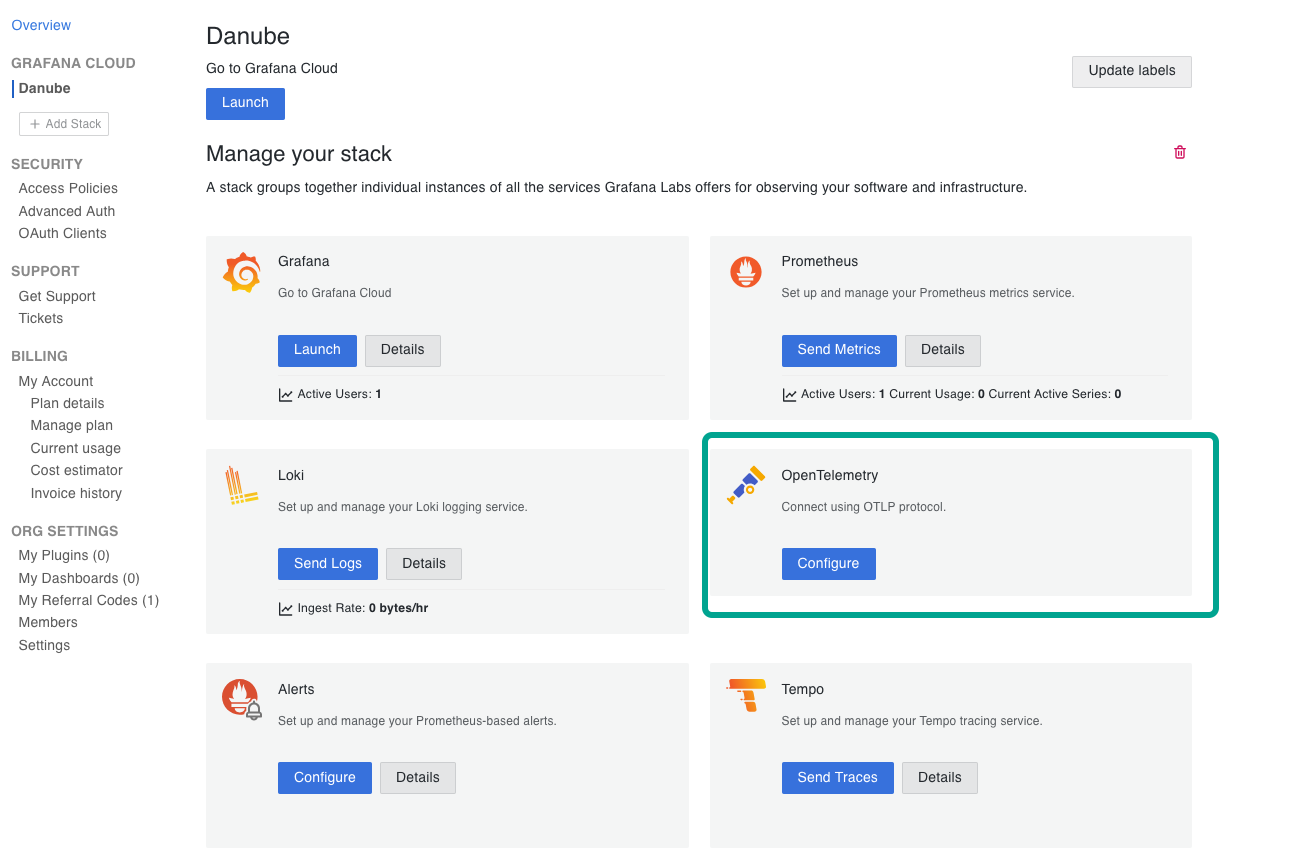
-
Copy the endpoint URL and append
v1/tracesto it.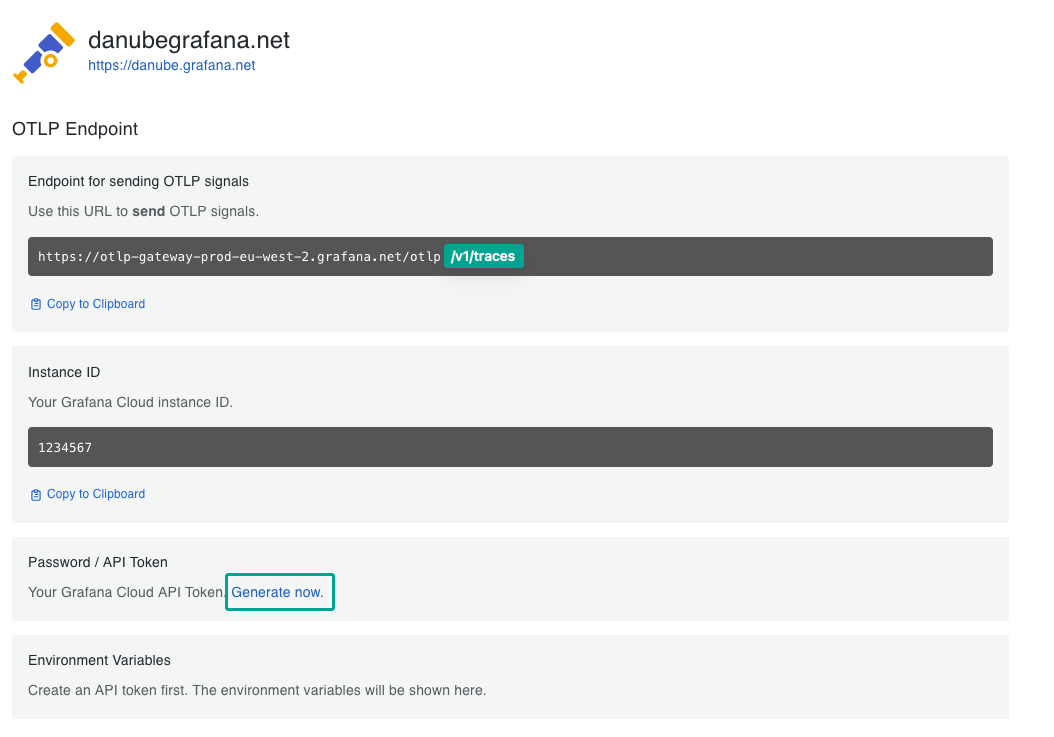
https://otlp-gateway-prod-eu-west-2.grafana.net/otlp/v1/traces. -
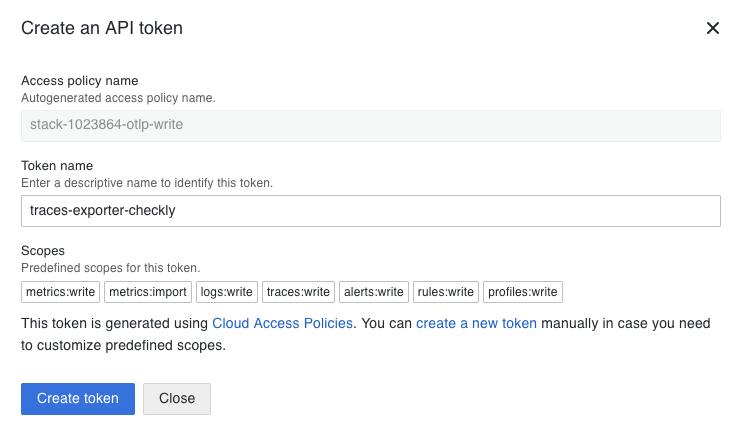
Generate an OTLP Token, and copy both the Instance ID and the OTLP Token as well.
- Head back to the Traces Settings page on Checkly.
- Enable exporting traces and add the endpoint URL from step 3.
- and in the Headers section, specify the HTTP Header:
AuthorizationandBasic instance:token, whereinstance:tokenis base64 encoded. You can use an online tool like base64encode.net to encode your instance and token.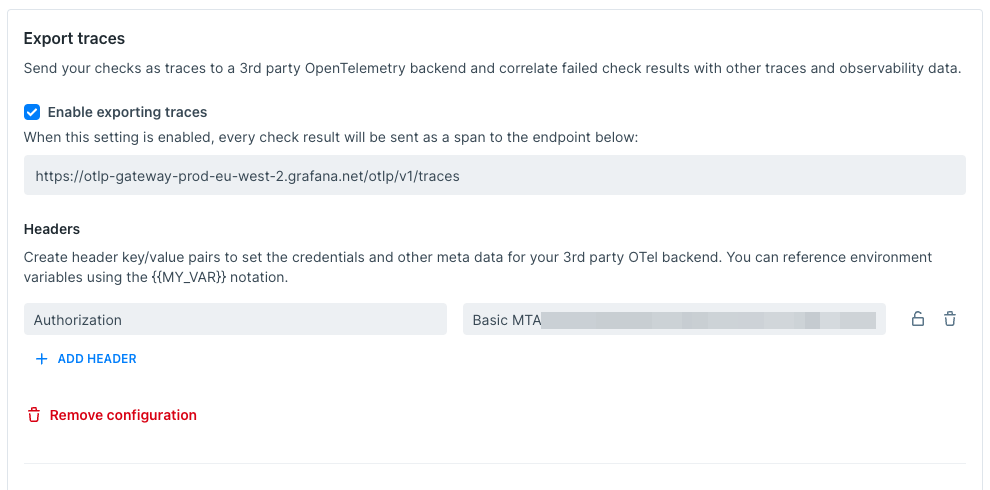
-
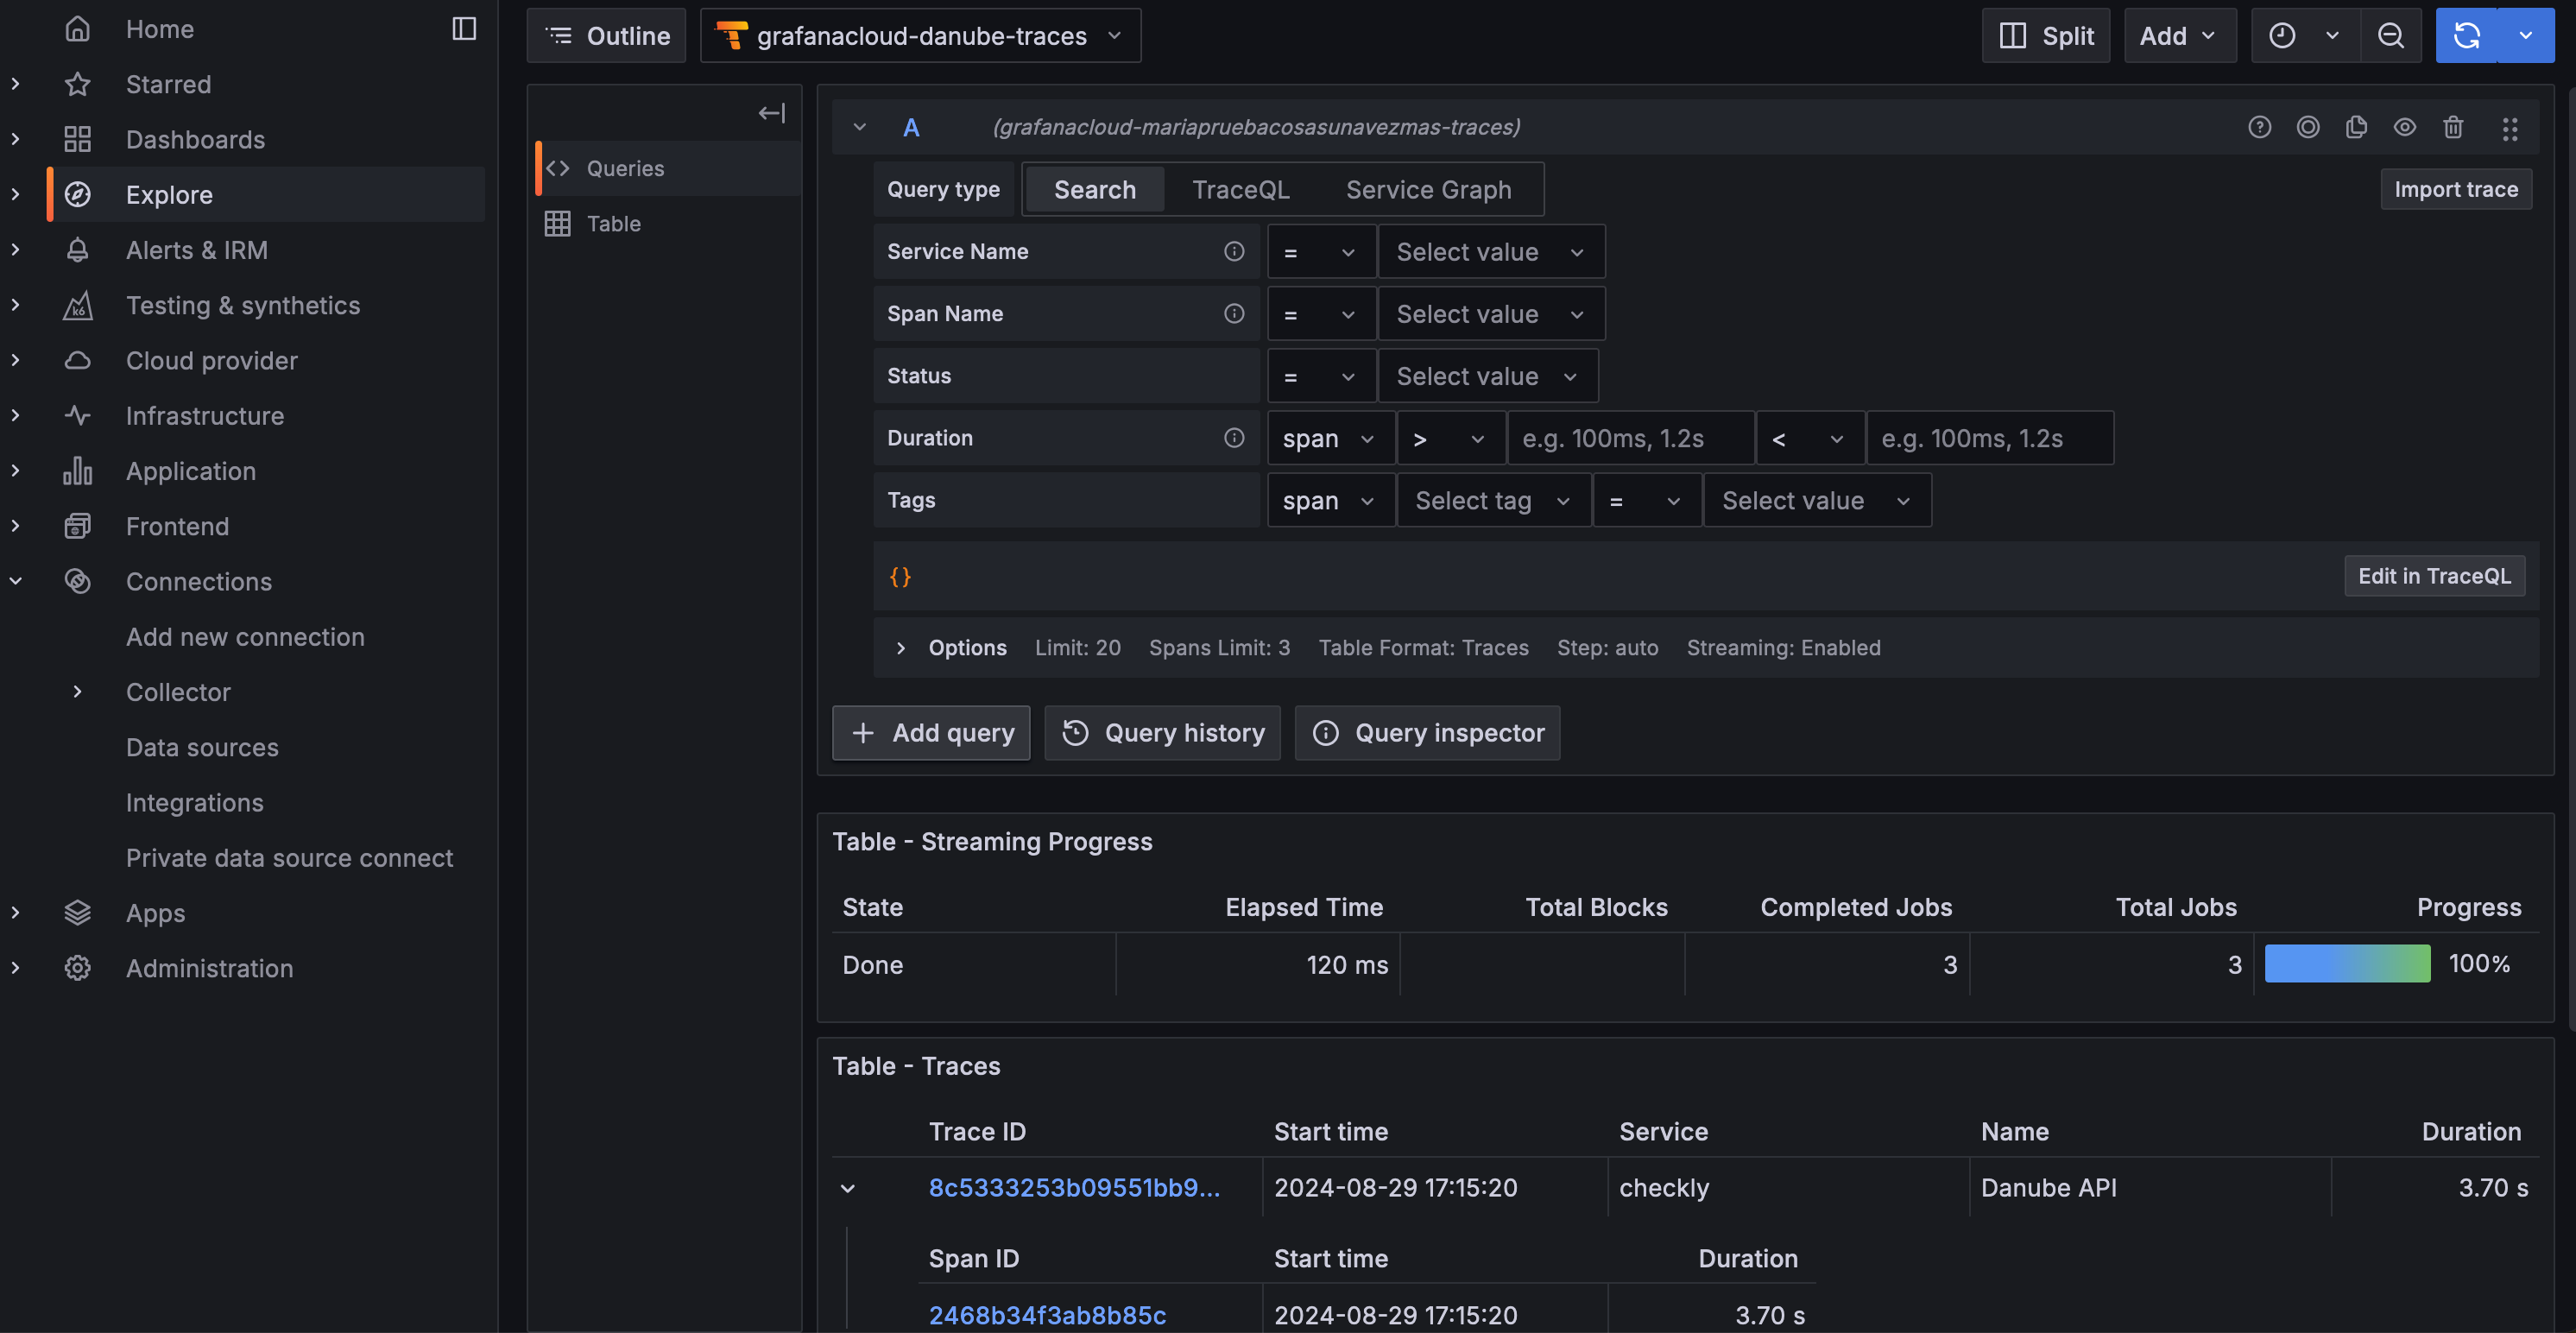
Back in your Grafana Cloud Instance (for example danube.grafana.net), head over to “Explore”, select the Tempo source that is named
grafanacloud-yourOrganization-traces: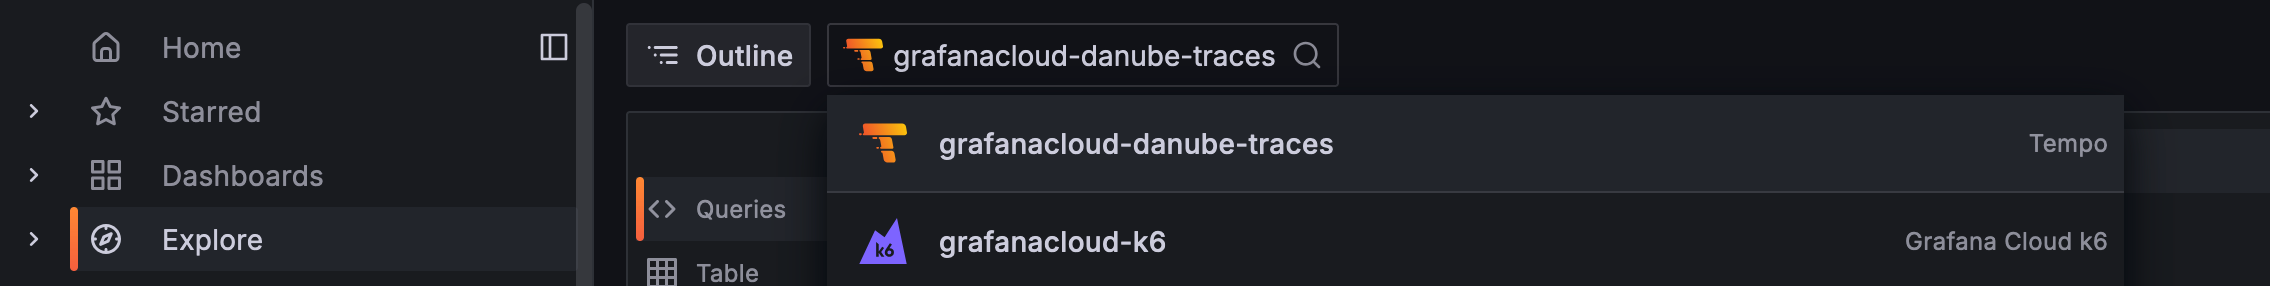
checklyin the service column.