Where traditional status page setups fall short
Traditional status pages suffer from a fundamental problem: they communicate infrastructure health, not user experience. Your servers might report healthy CPU usage while users can’t log in because of an incorrectly used React feature. Your database might show normal query times while users can’t search for products. Infrastructure monitoring matters but only tells part of the story. The disconnect of green status bars and broken user experience erodes trust. Users learn to ignore status pages because they’ve been burned before by “all systems operational” banners during outages they’re actively experiencing. Outages and bugs are unavoidable. Being transparent and honest about them is what matters and builds trust in your service.How Checkly status pages work
Checkly status pages offer everything your current status page provider offers, plus integration with synthetic monitors that validate real user behavior. When you connect a Playwright Check Suite or Browser Check that simulates a user logging in, adding items to cart, and completing checkout, your status page reflects whether that entire flow actually works. Following this approach, your status page reflects what matters to your users. Here’s how the pieces fit together:- Synthetic monitors validate behavior - Playwright Check Suites and Browser Checks use Playwright to simulate user actions. These aren’t simple ping tests or infrastructure checks; they’re validations of your service’s critical user flows in a real browser.
- Services represent user-facing capabilities - You can define services like “Checkout” or “Login” that map to how users think about your application, not your internal architecture.
- Incident automation connects the dots - When a check fails, it can automatically open an incident on the connected service. When the check recovers, the incident resolves.
Set up a status page backed by real synthetic monitoring
Create services that match user expectations
Services should reflect how users perceive your application. Users care about “Login” working, not whether your auth microservice cluster is healthy. Good service examples:- Website
- User Login
- Payments
- Search
Auth Service v2 or Primary Database Cluster.
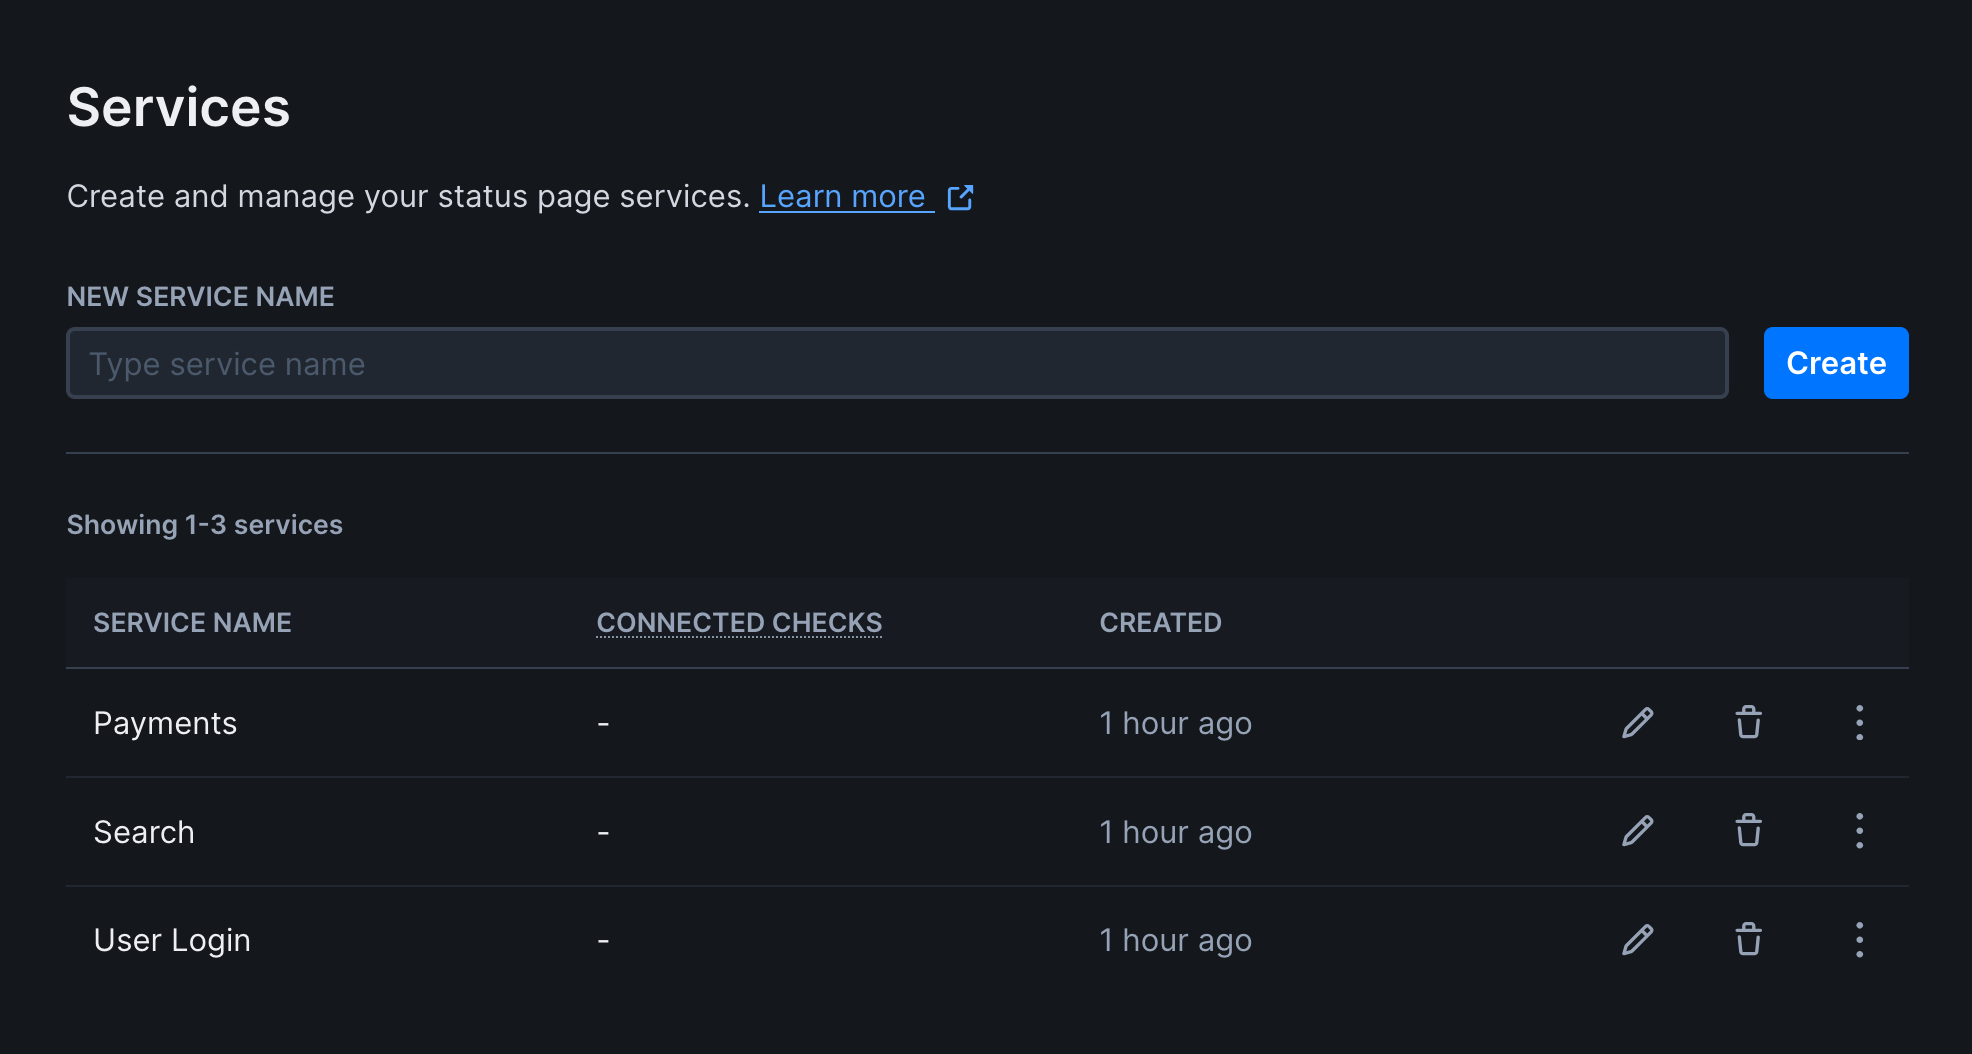
To create a service:
- Navigate to Services under Communicate in the sidebar
- Create a new service with a user-friendly name
Connect synthetic monitors to services
This is where the real behavior validation happens. Each service can be connected to one or more monitors that validate its functionality.Incident automation is available on Communicate Team and Enterprise plans. View pricing
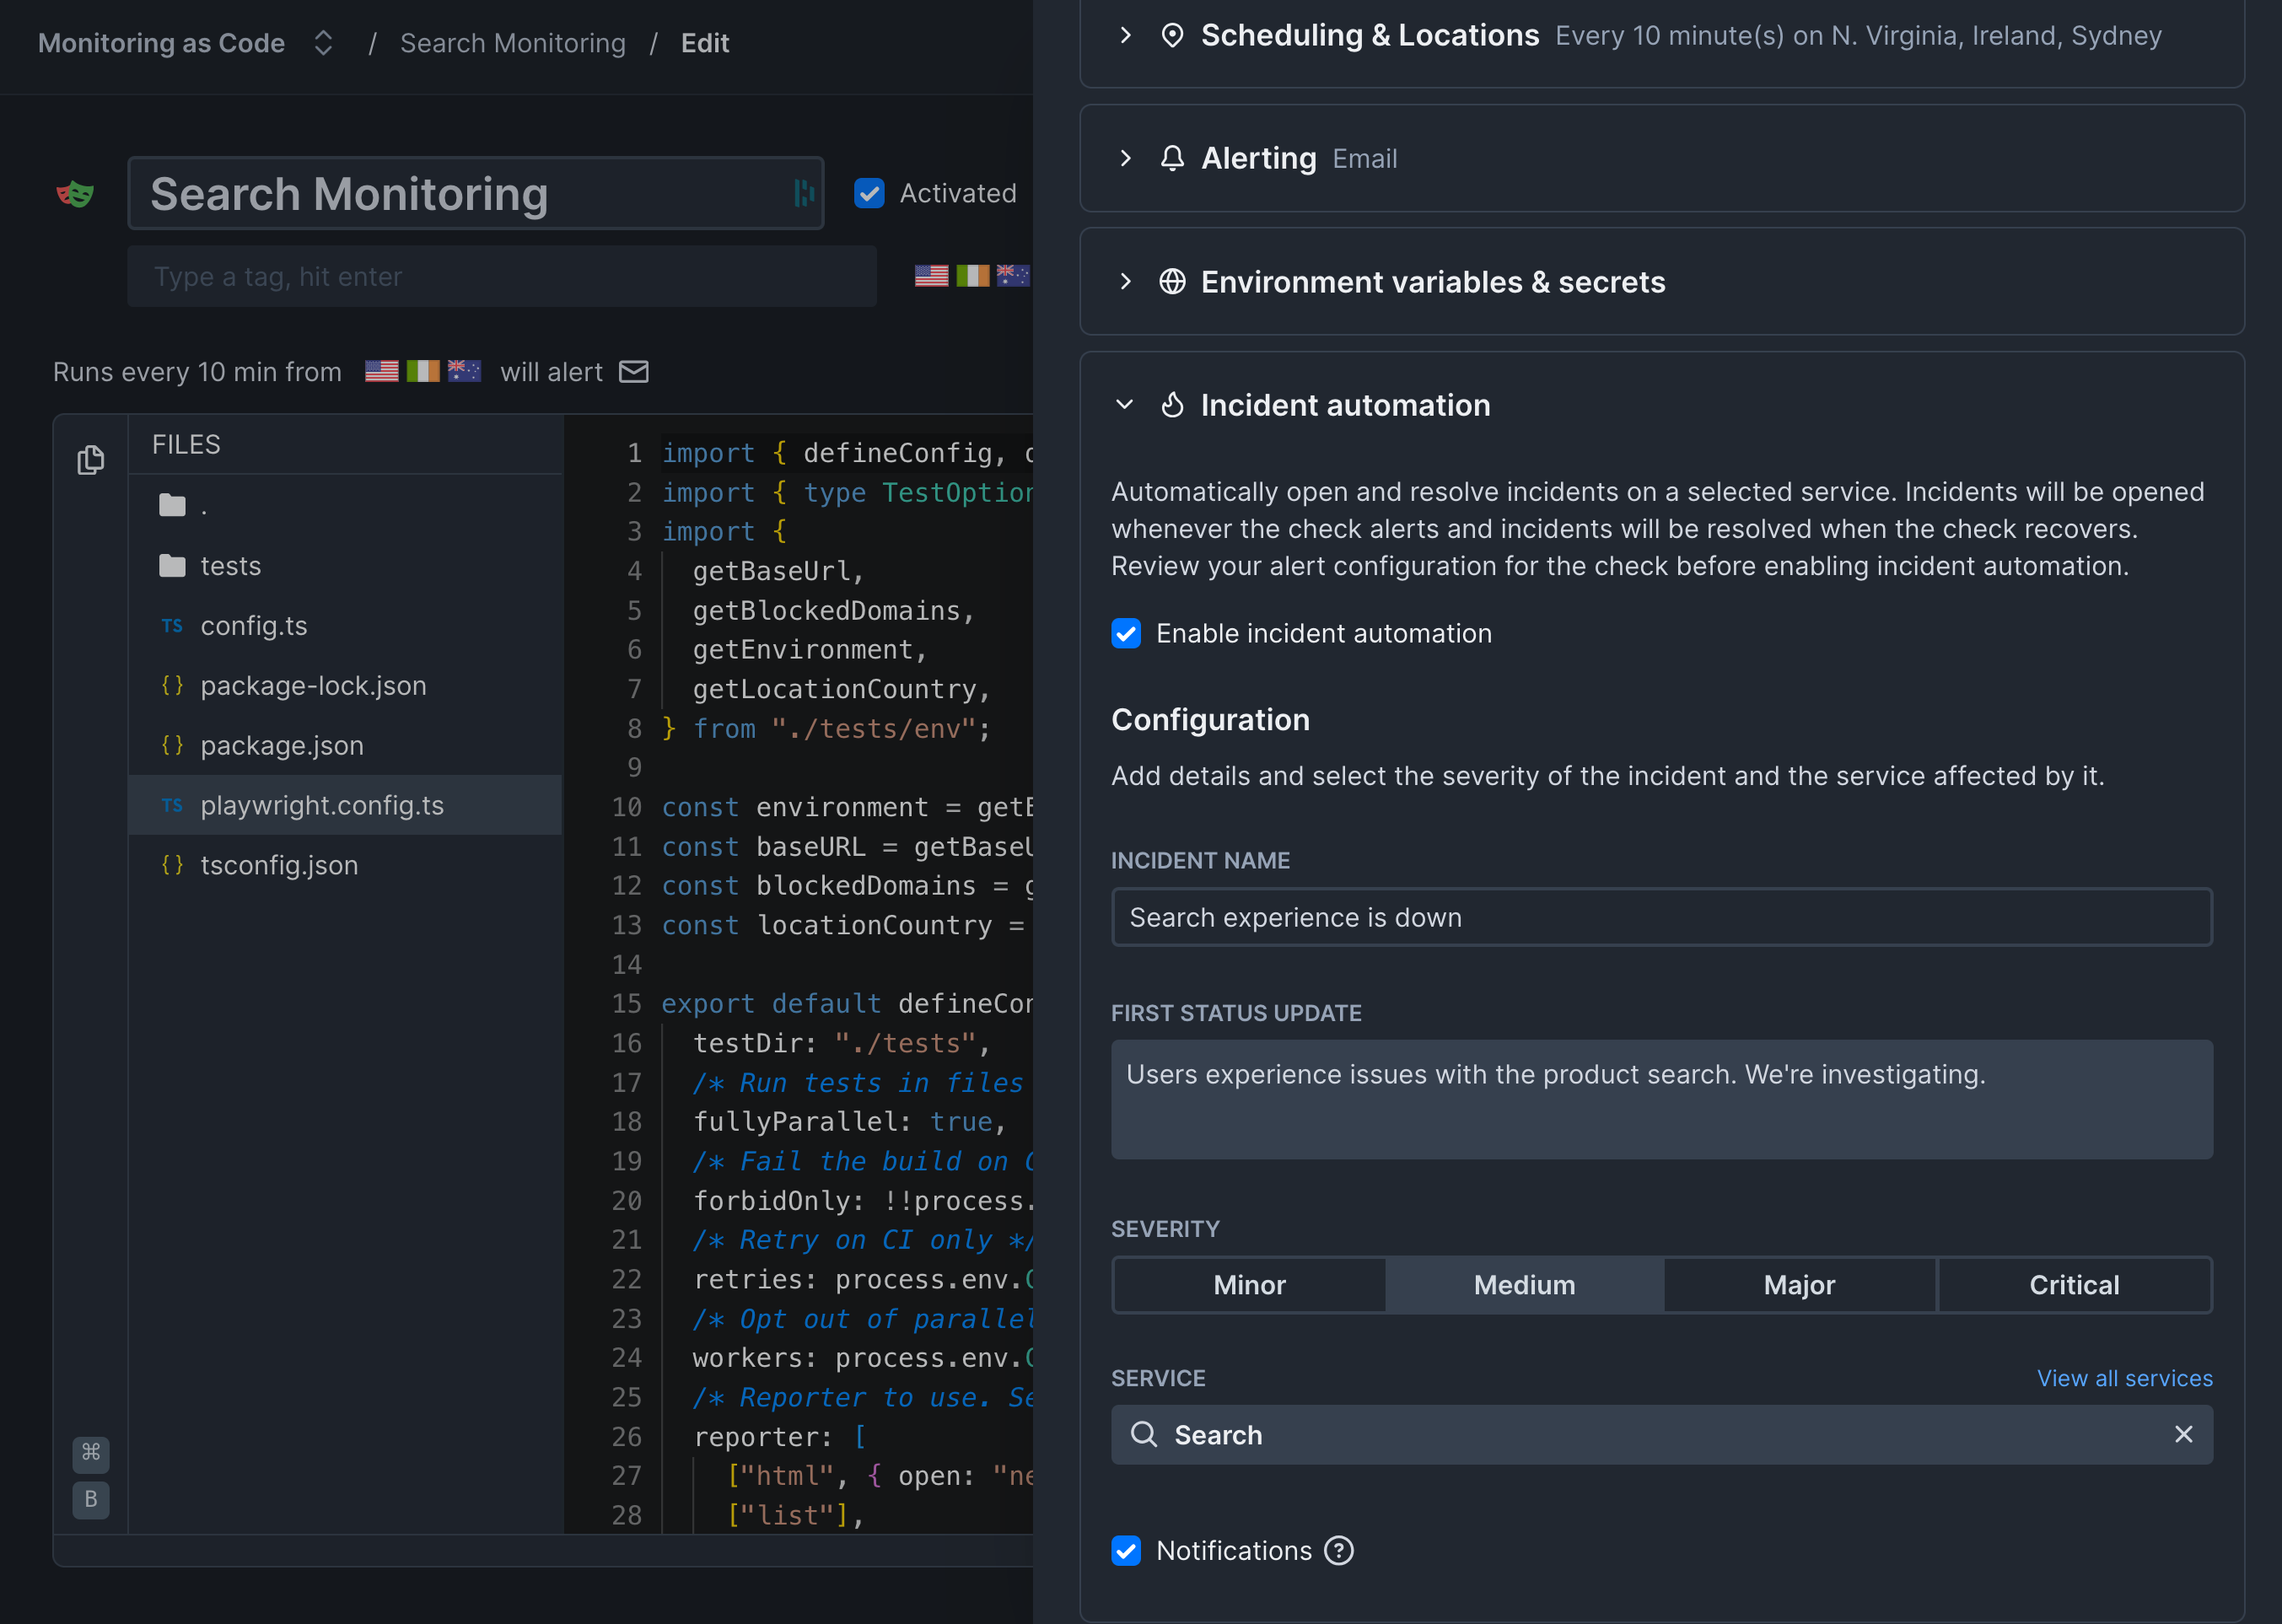
- Open your Playwright Check Suite or Browser Check from the home dashboard
- Click Edit in the check overview page
- Click Settings and enable Incident automation
- Fill in the incident name and initial status update
- Select which service the incident should be opened on
- Save your check
Create the status page
- Go to Status pages under Communicate in the sidebar
- Create a new status page
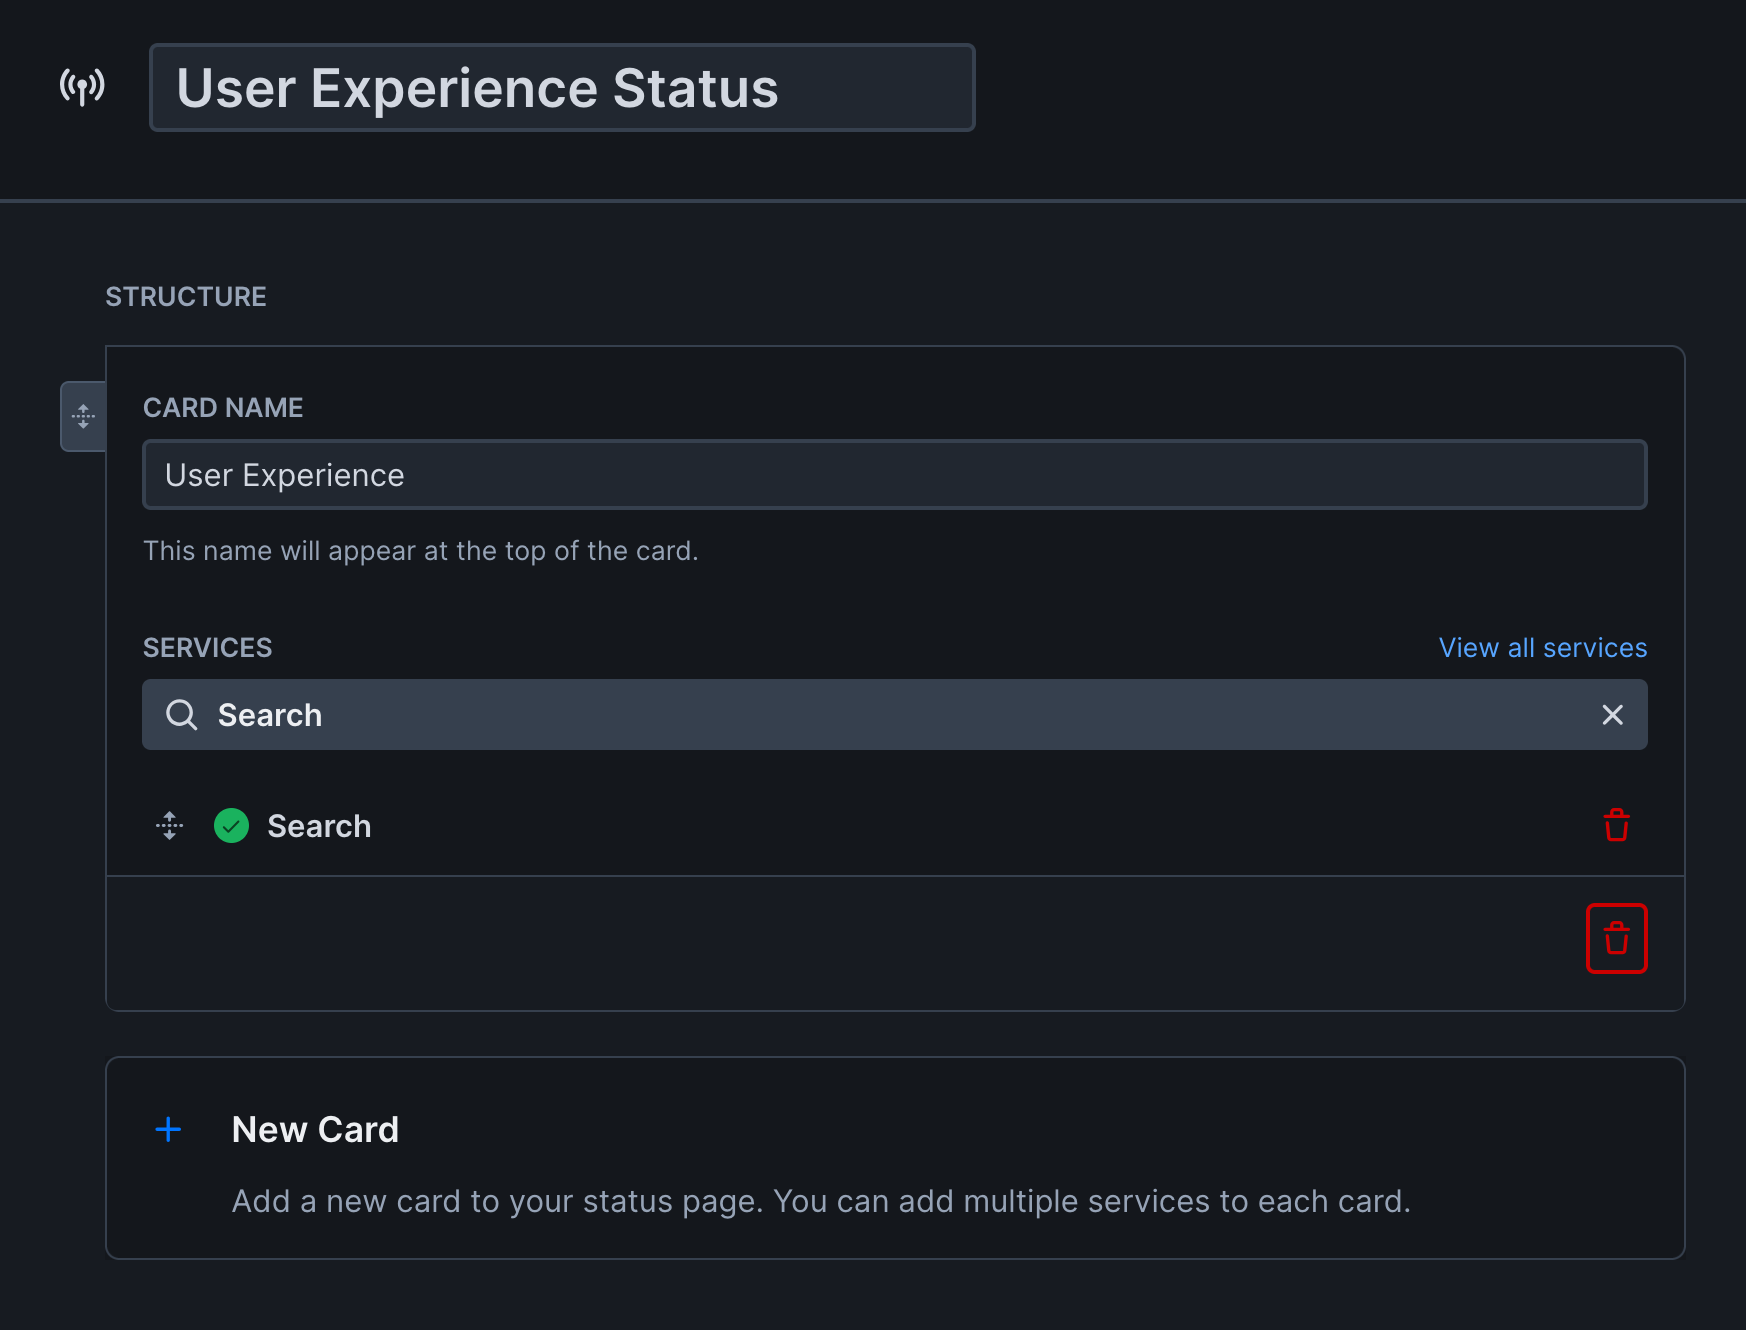
- Enter a name for your page
- Add cards and assign services to them. Group related services on the same card to show average uptime
- Configure domain settings and your status page’s appearance
- Click Create status page
Automate everything with Monitoring as Code
Checkly’s Monitoring as Code approach enables you to automate the entire flow of creating status pages, connecting services, and configuring checks.View code example
View code example
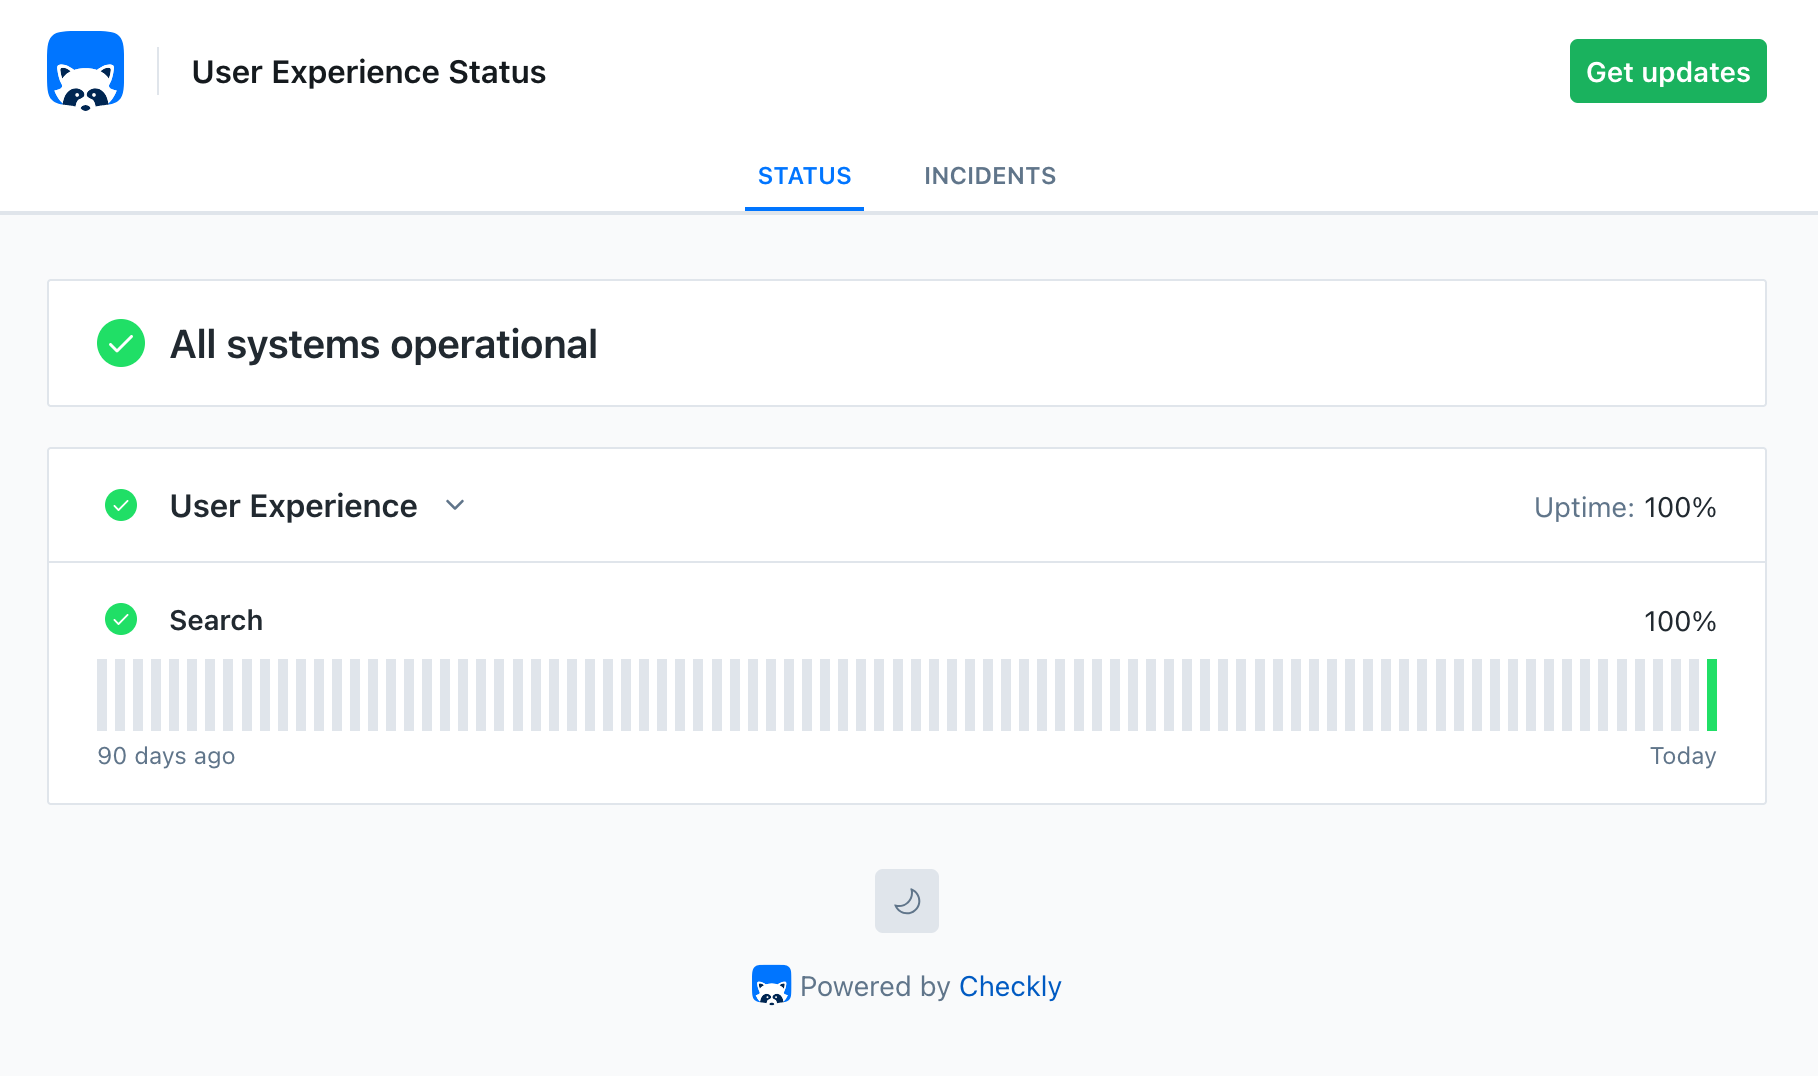
Why this approach works
A status page backed by synthetic monitoring builds trust because it tells the truth. When users see “operational,” they can trust that the application actually works. When there’s an incident, they know about it immediately. This transparency has practical benefits:- Reduced support load - Users check the status page instead of contacting support
- Faster incident response - Automated incident creation means faster communication
- Accurate SLA reporting - Uptime calculations reflect real user experience
Further reading
- Status Pages Overview - Complete reference for status page features
- Incident Management - Detailed guide to creating and managing incidents
- Subscriber Notifications - Set up email notifications for status changes
- Anatomy of a Status Page - What users expect from status pages