This guide will walk you through creating your first Browser Check with Checkly. Browser Checks are perfect for monitoring realistic user flows within your application or services. If you are looking for monitoring general availability, check out the Uptime Monitor Quickstart.Documentation Index
Fetch the complete documentation index at: https://checklyhq.com/docs/llms.txt
Use this file to discover all available pages before exploring further.
Prerequisites
Prerequisites
- A Checkly account (sign up at checklyhq.com)
- The URL of a website you want to monitor
Create a Browser Check
- Head to Create a Check
- Choose “Browser Check” for comprehensive website monitoring
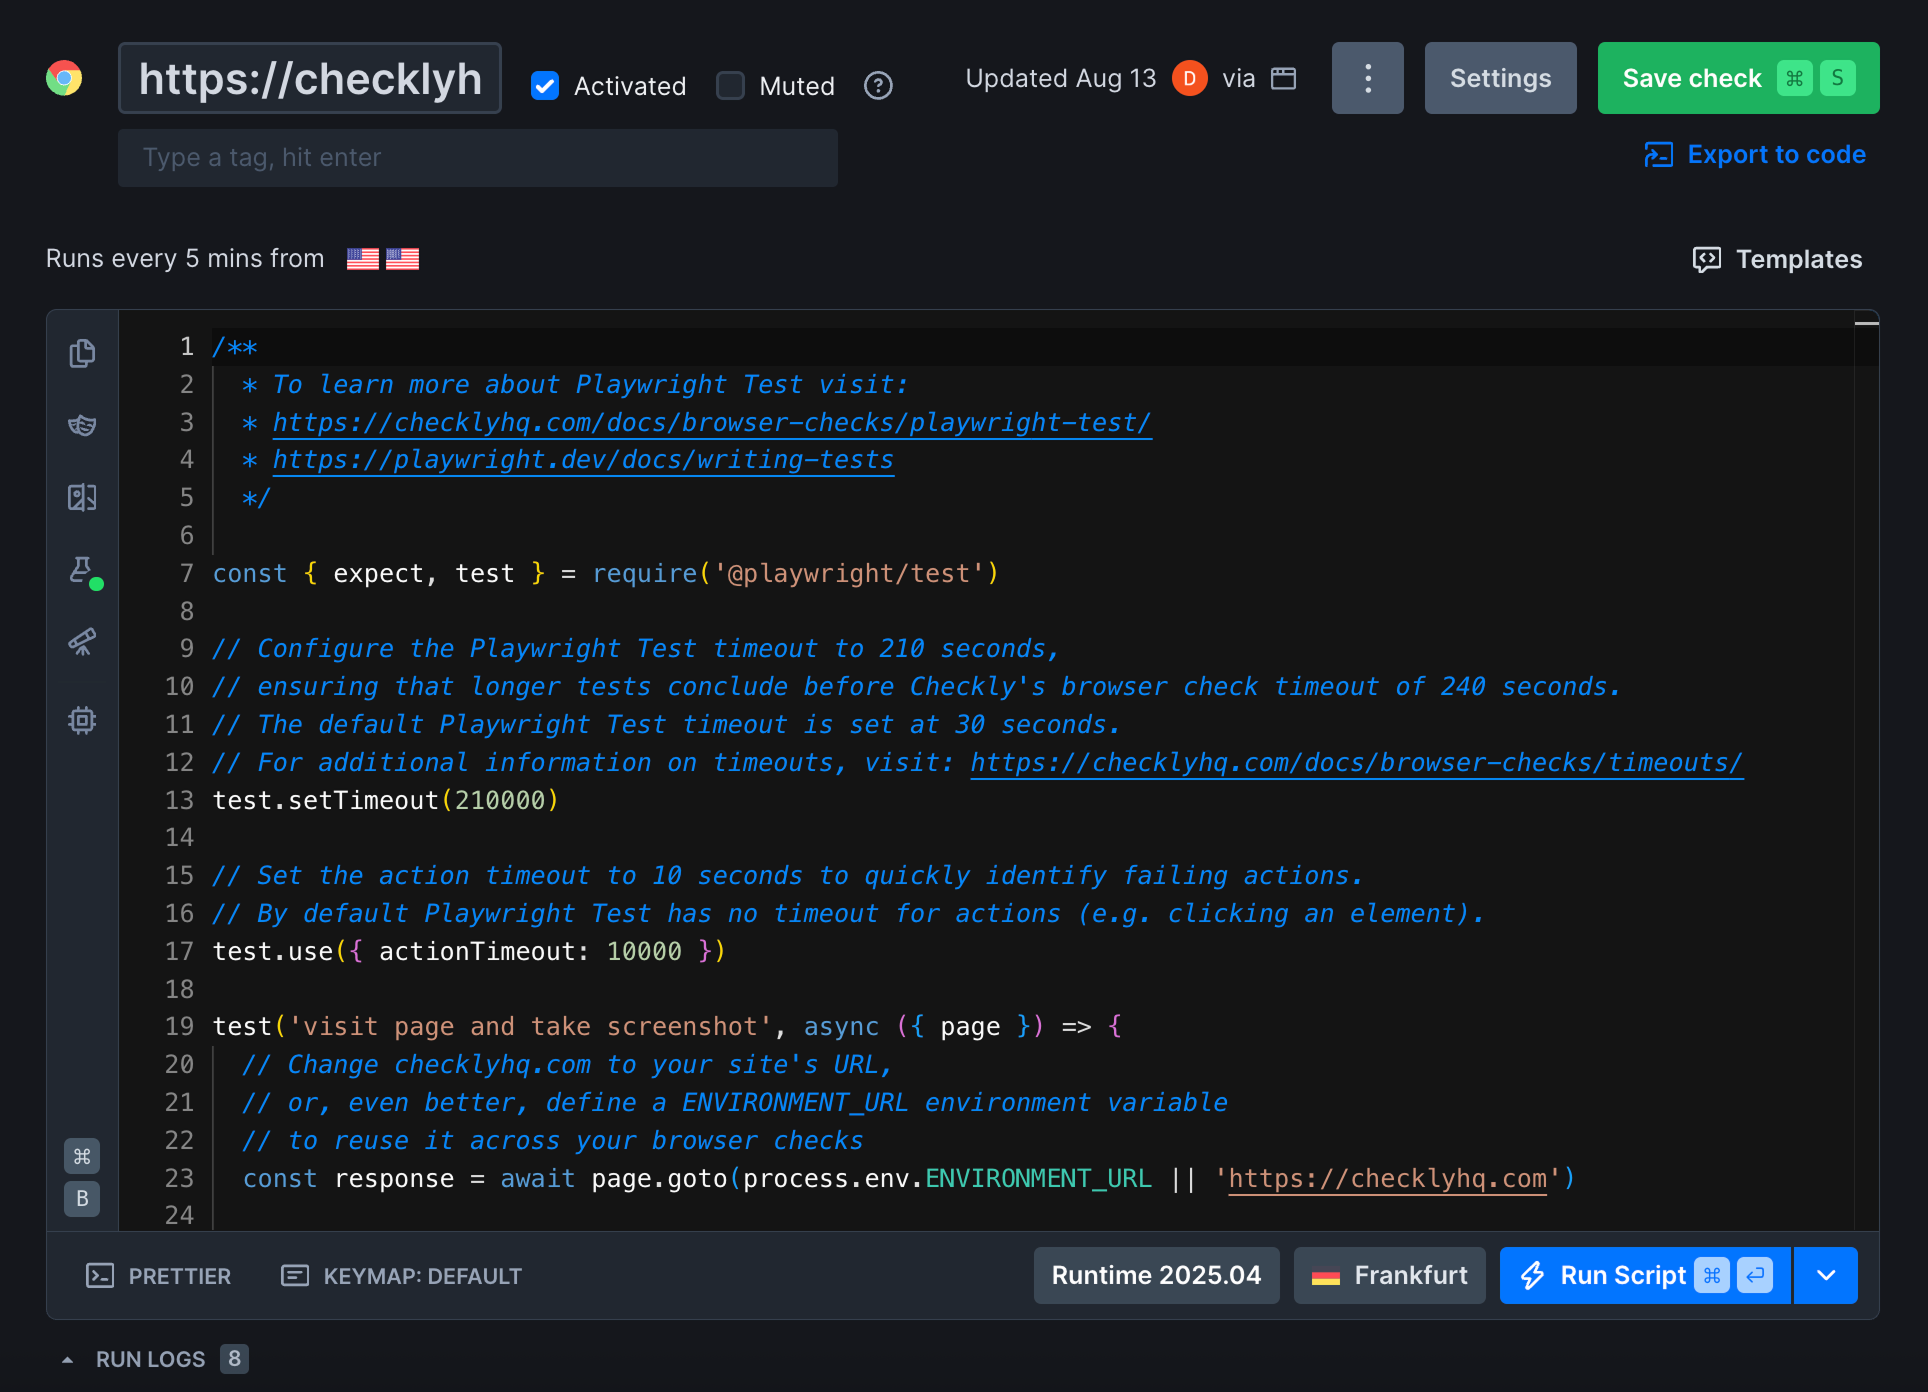
Edit Your Test Script
The following test script will check if the homepage is available, performing correctly, and looks visually correct.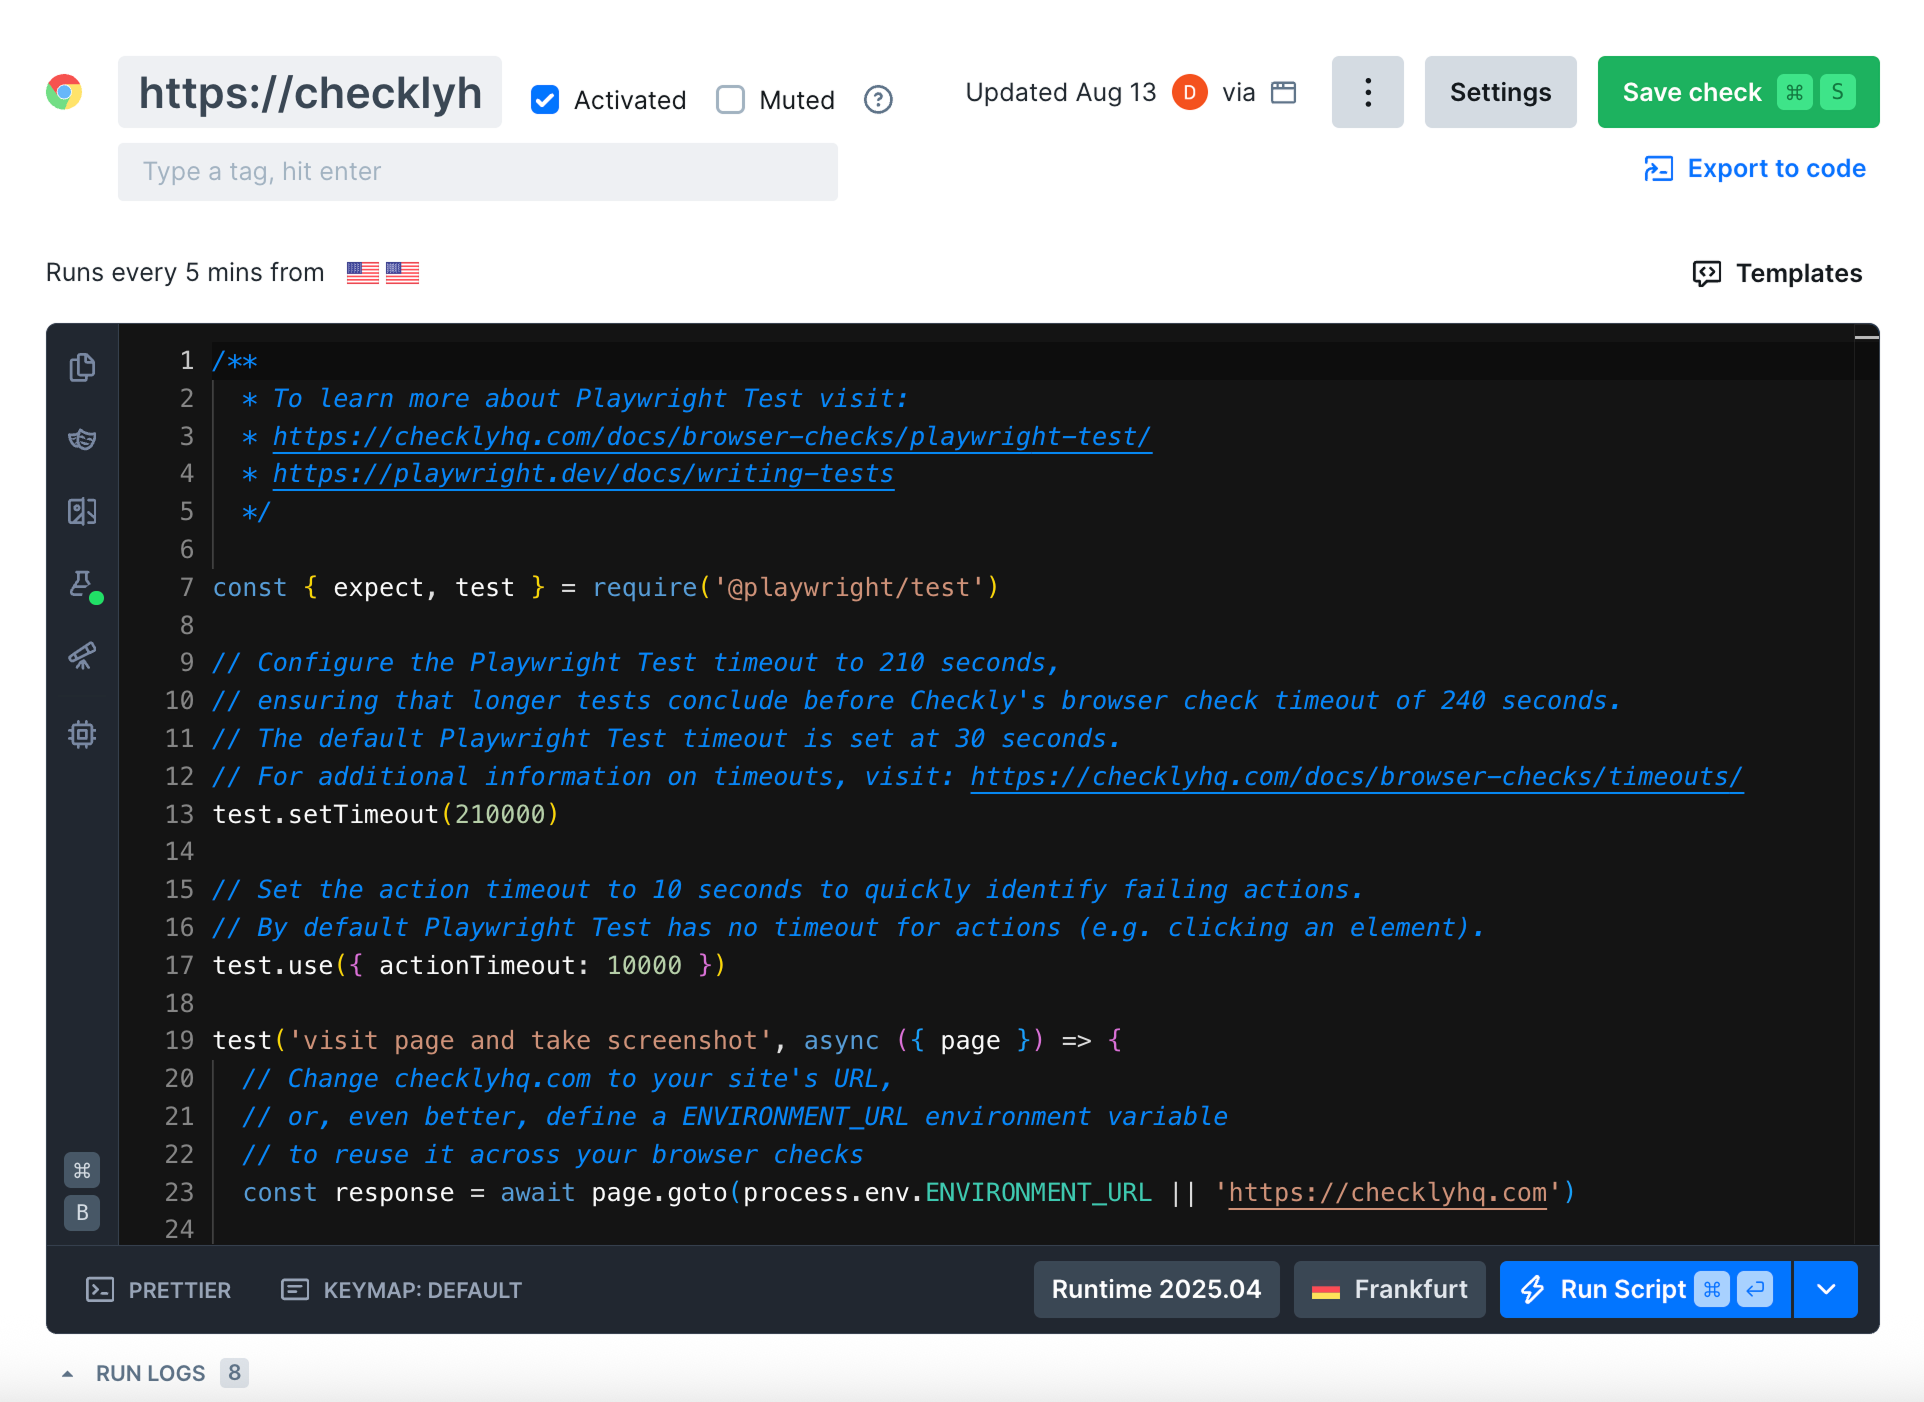
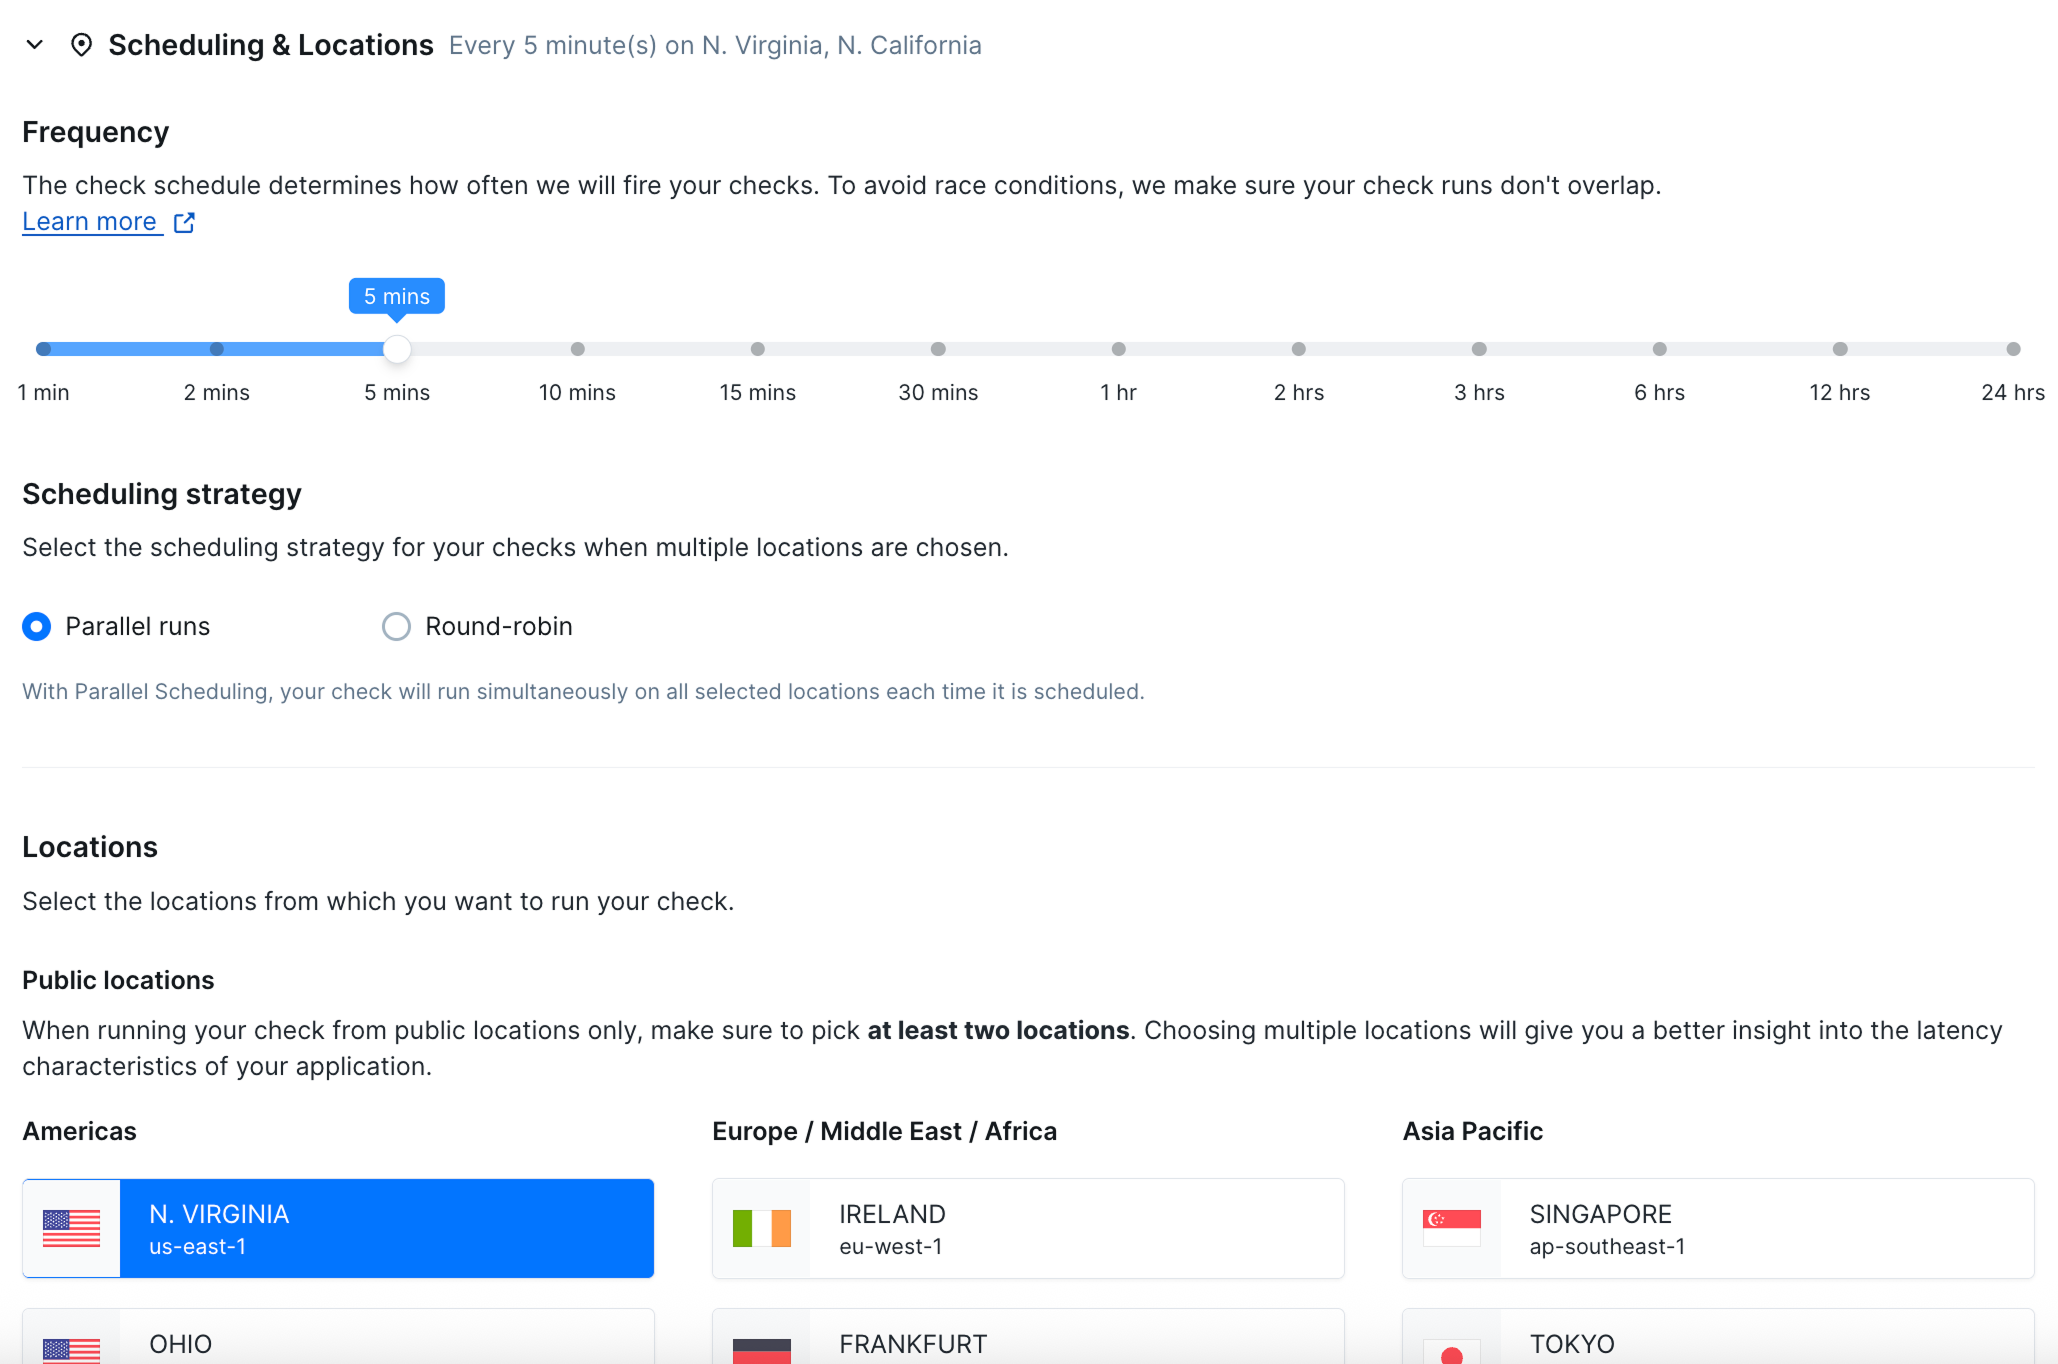
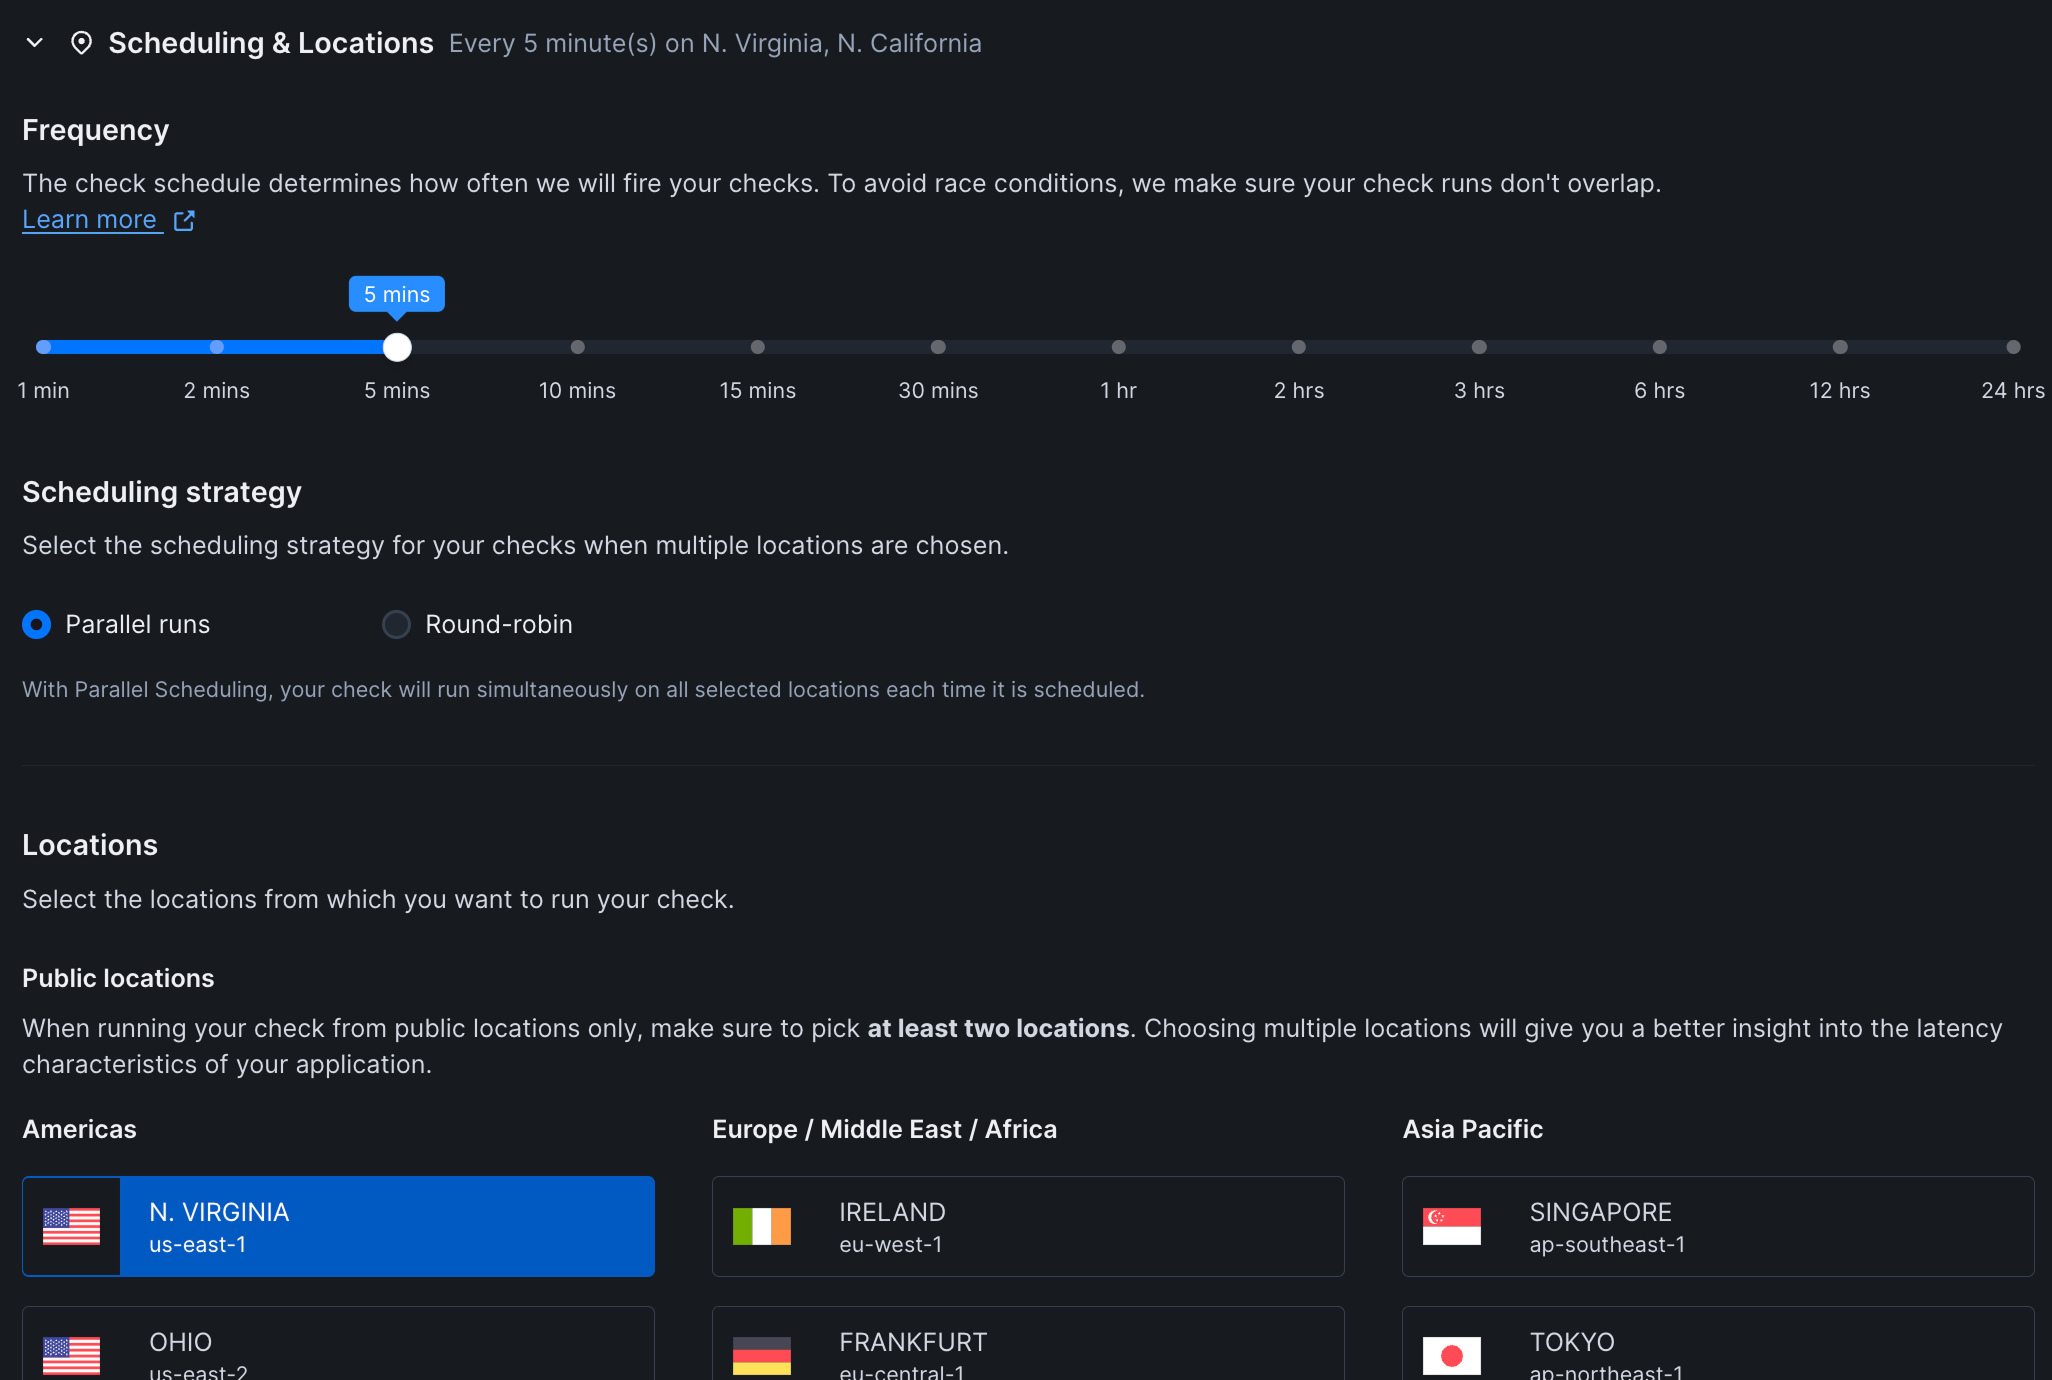
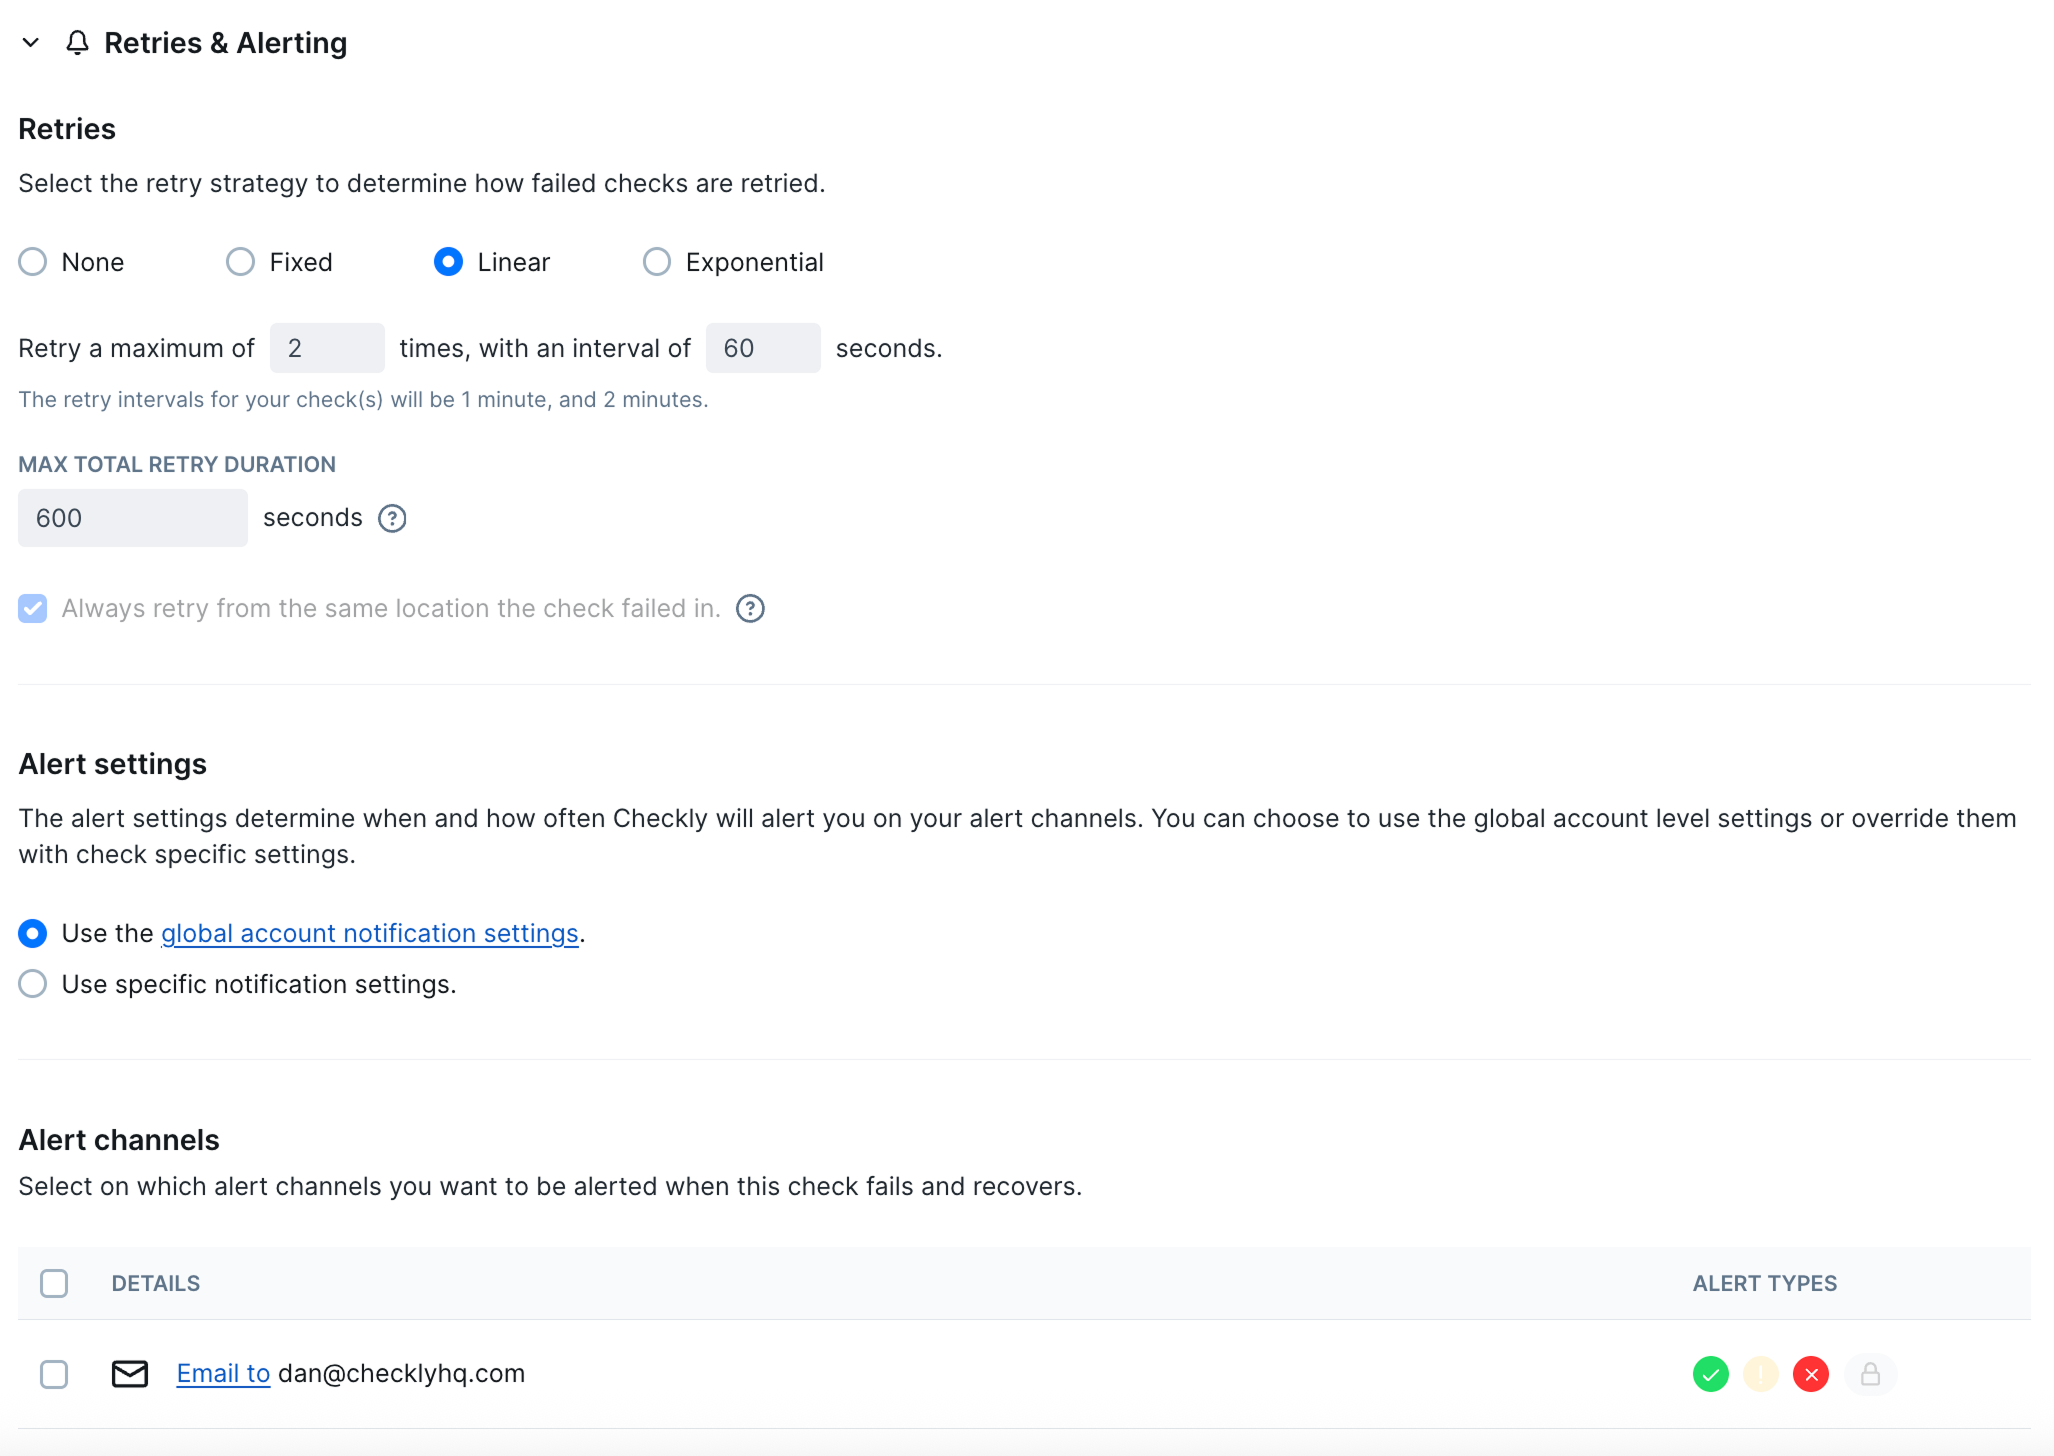
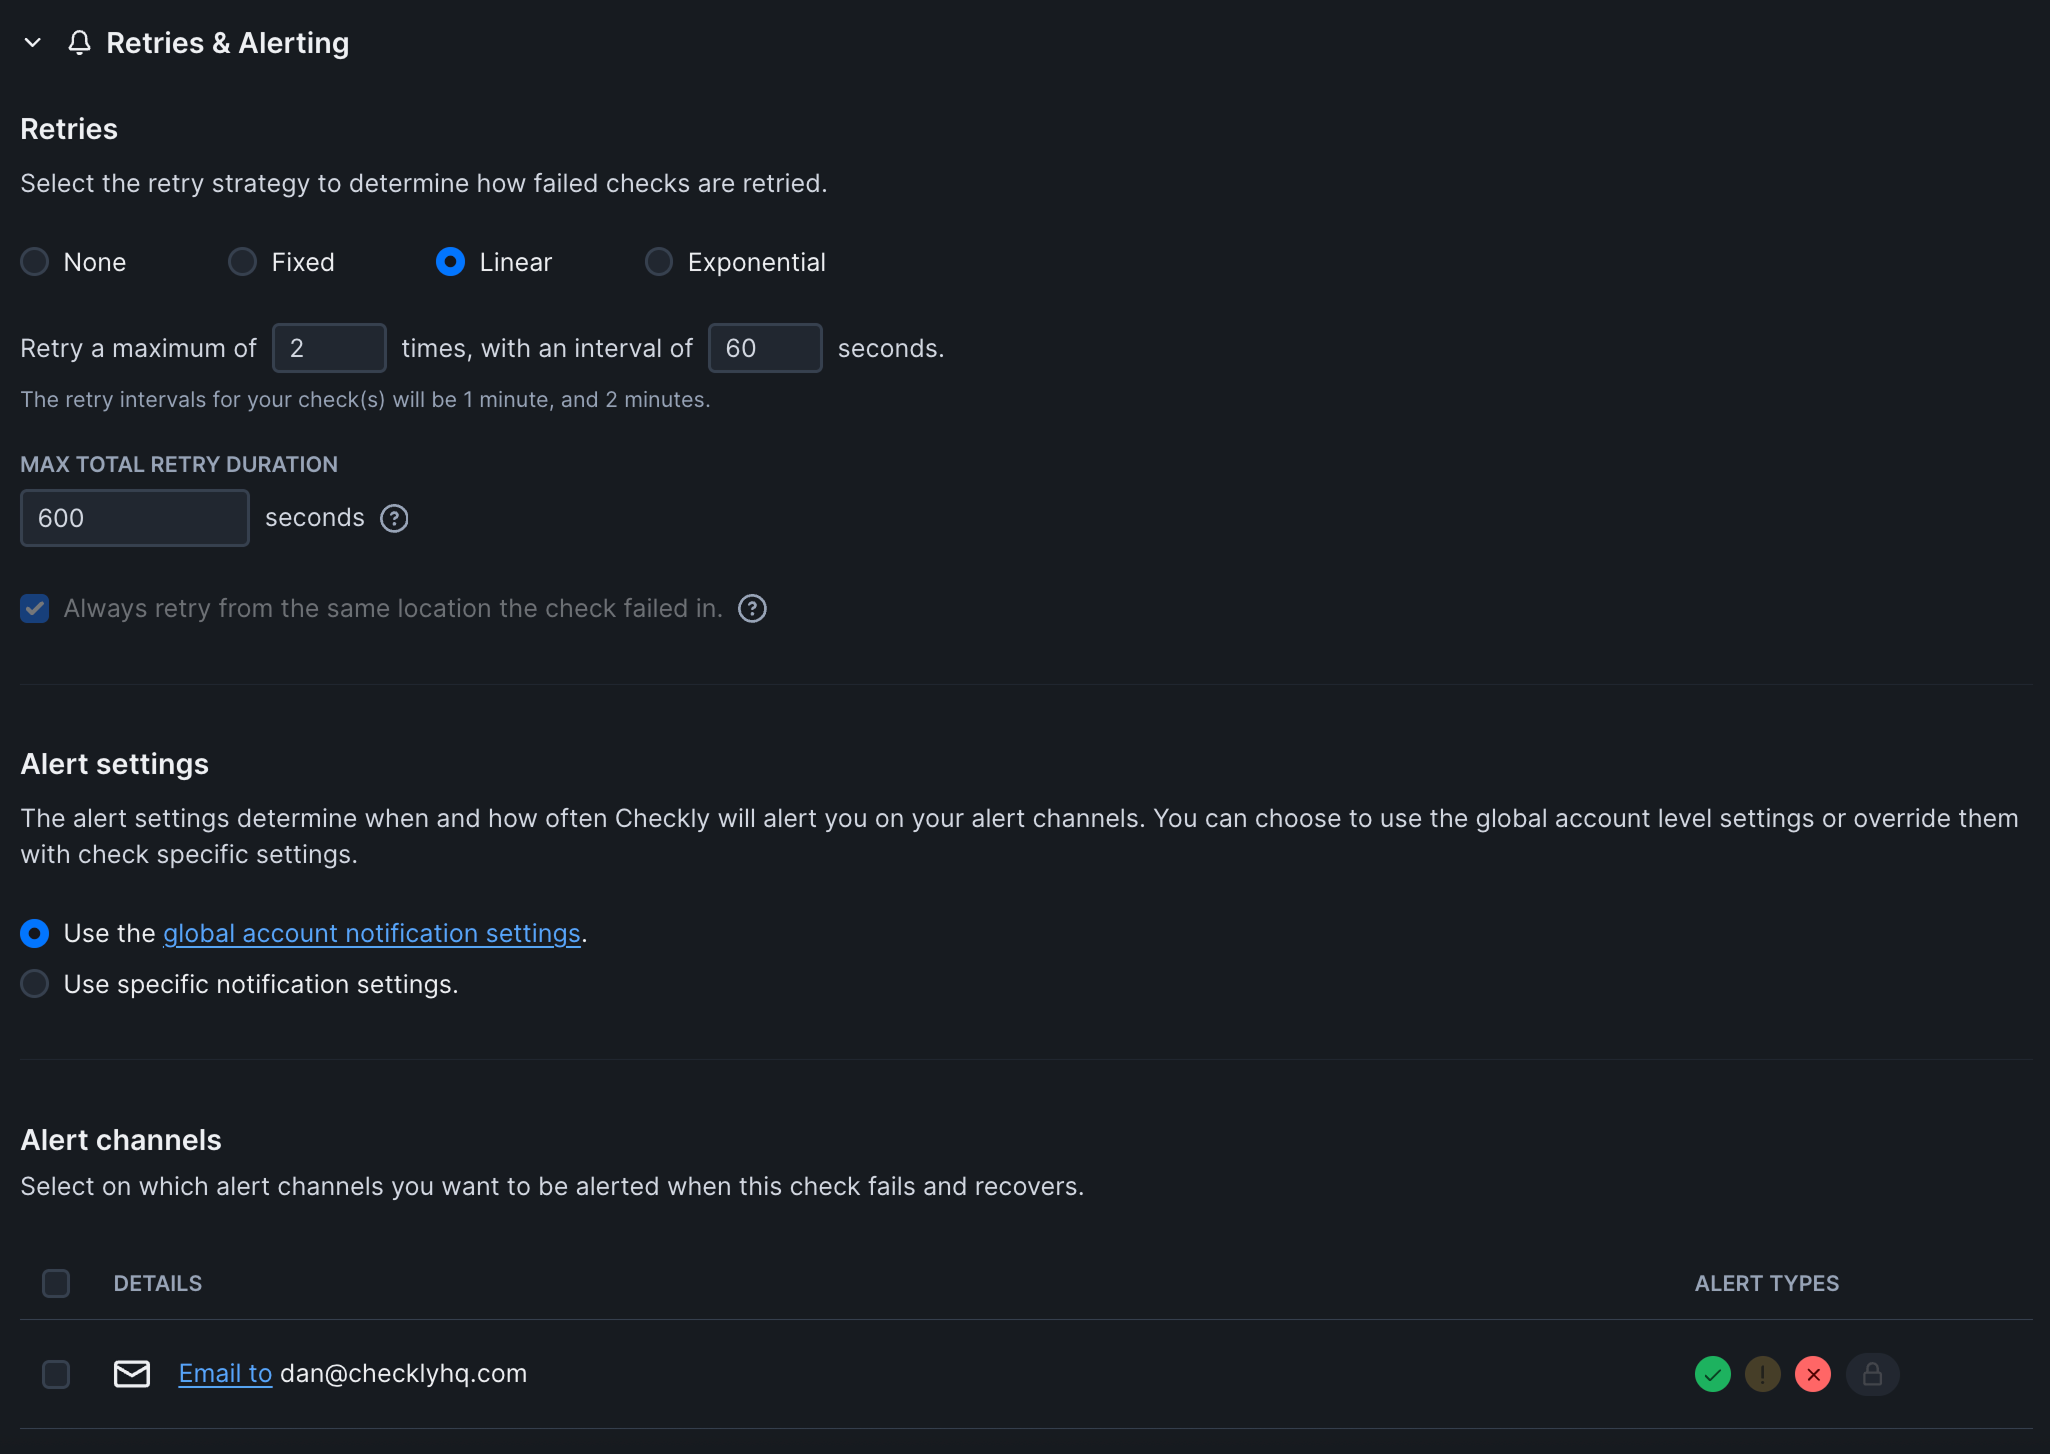
Configure Check Settings
Configure your check settings by clicking the “Settings” button in the top right corner of the check editor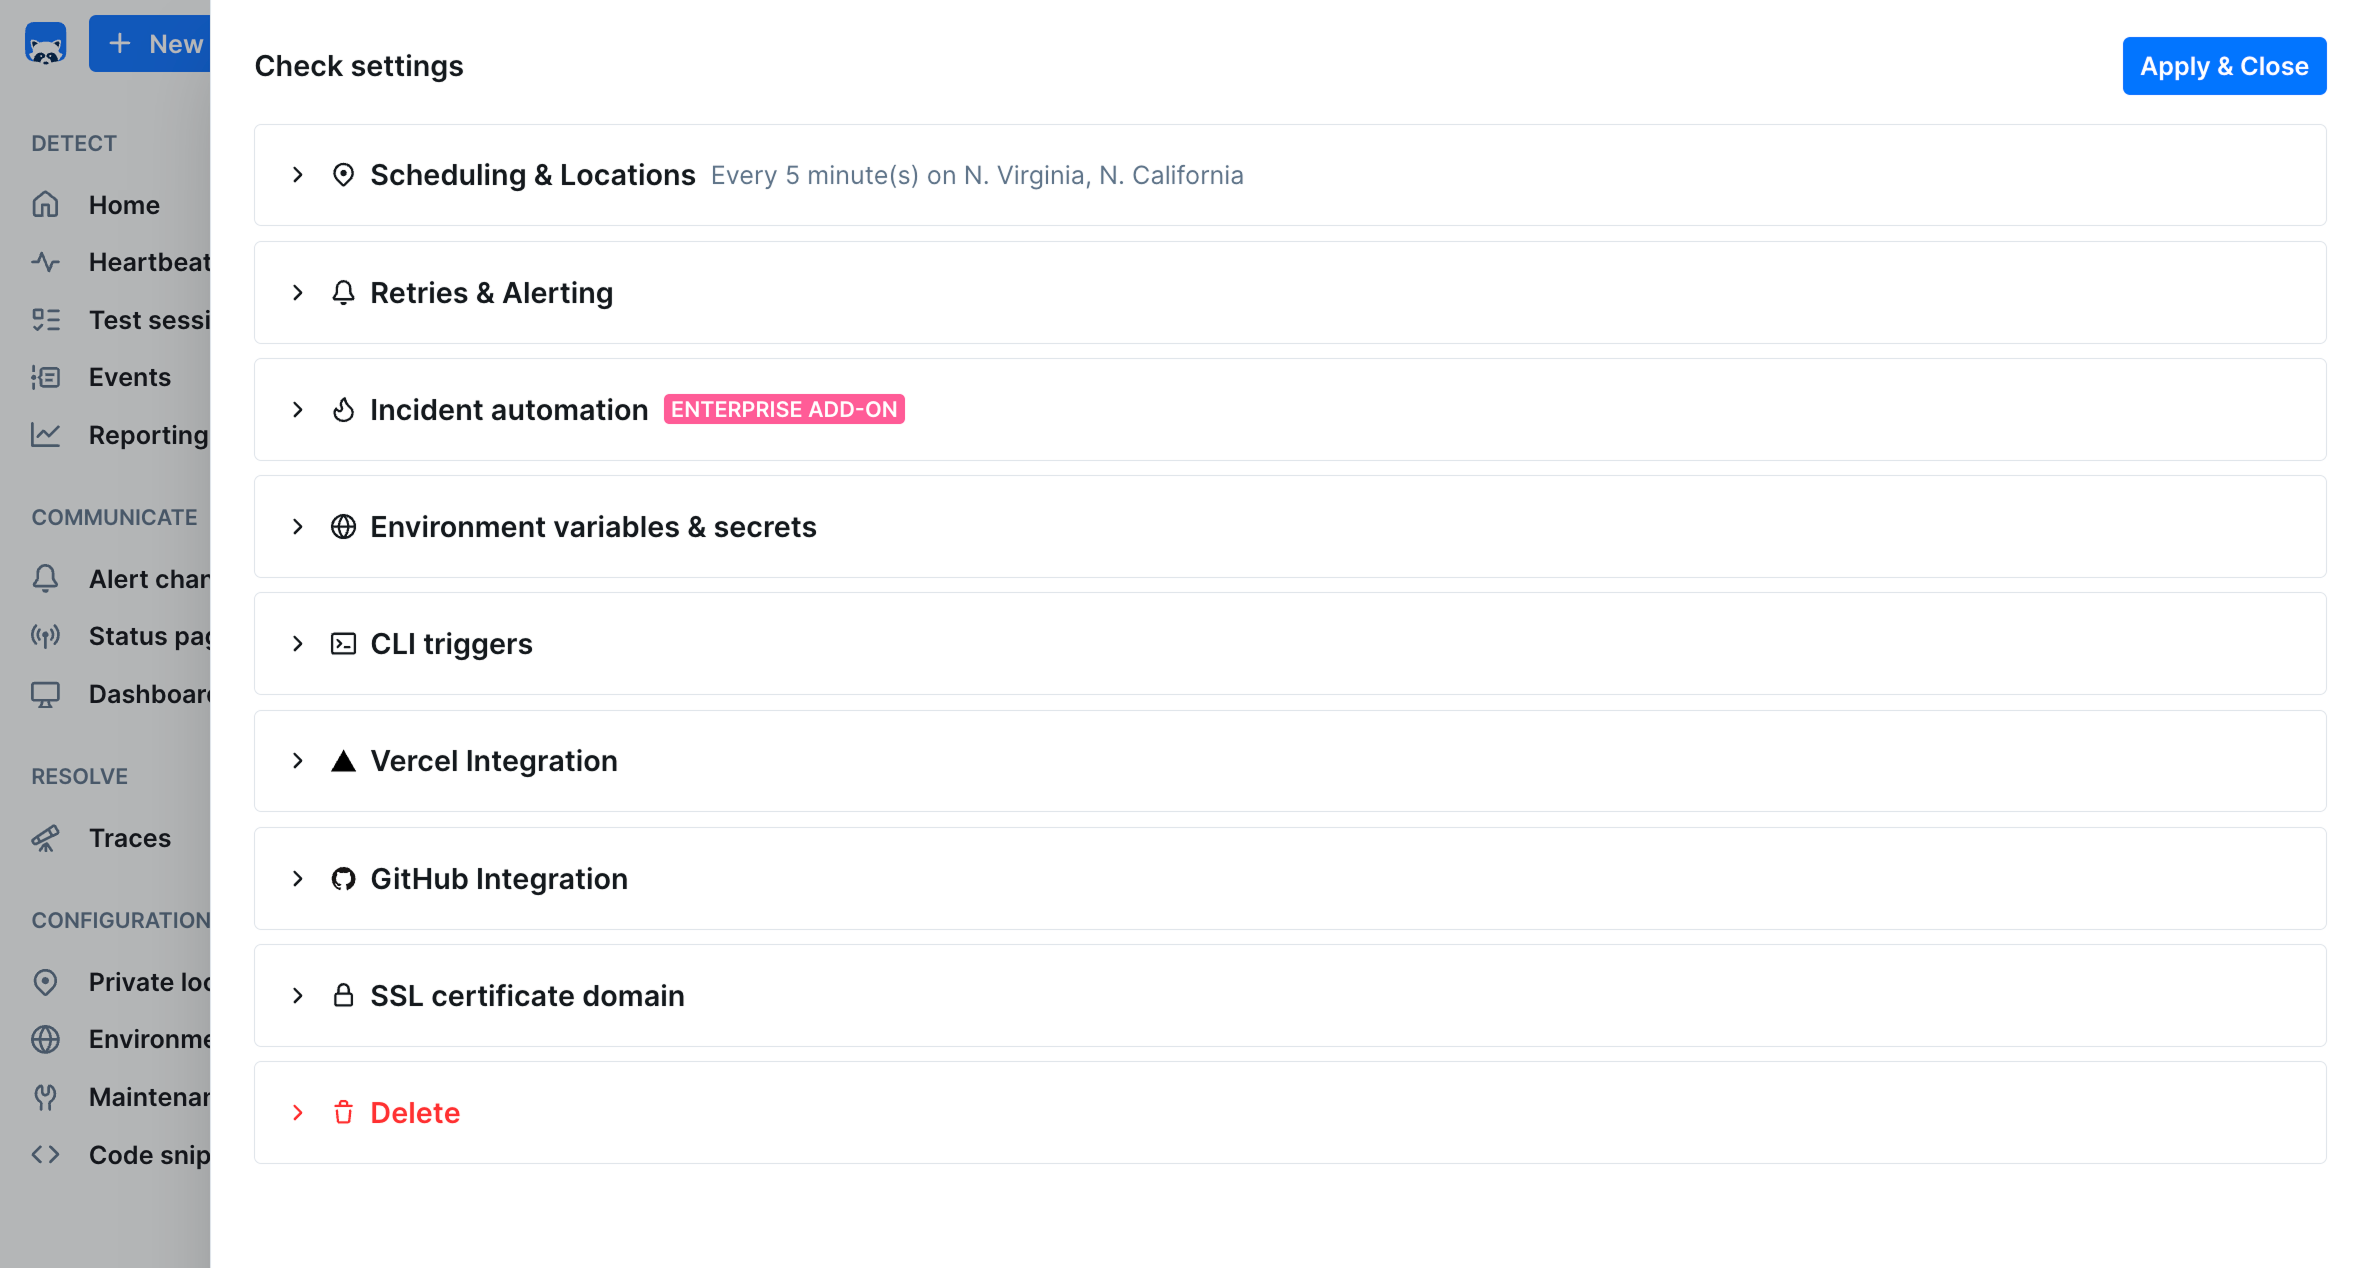
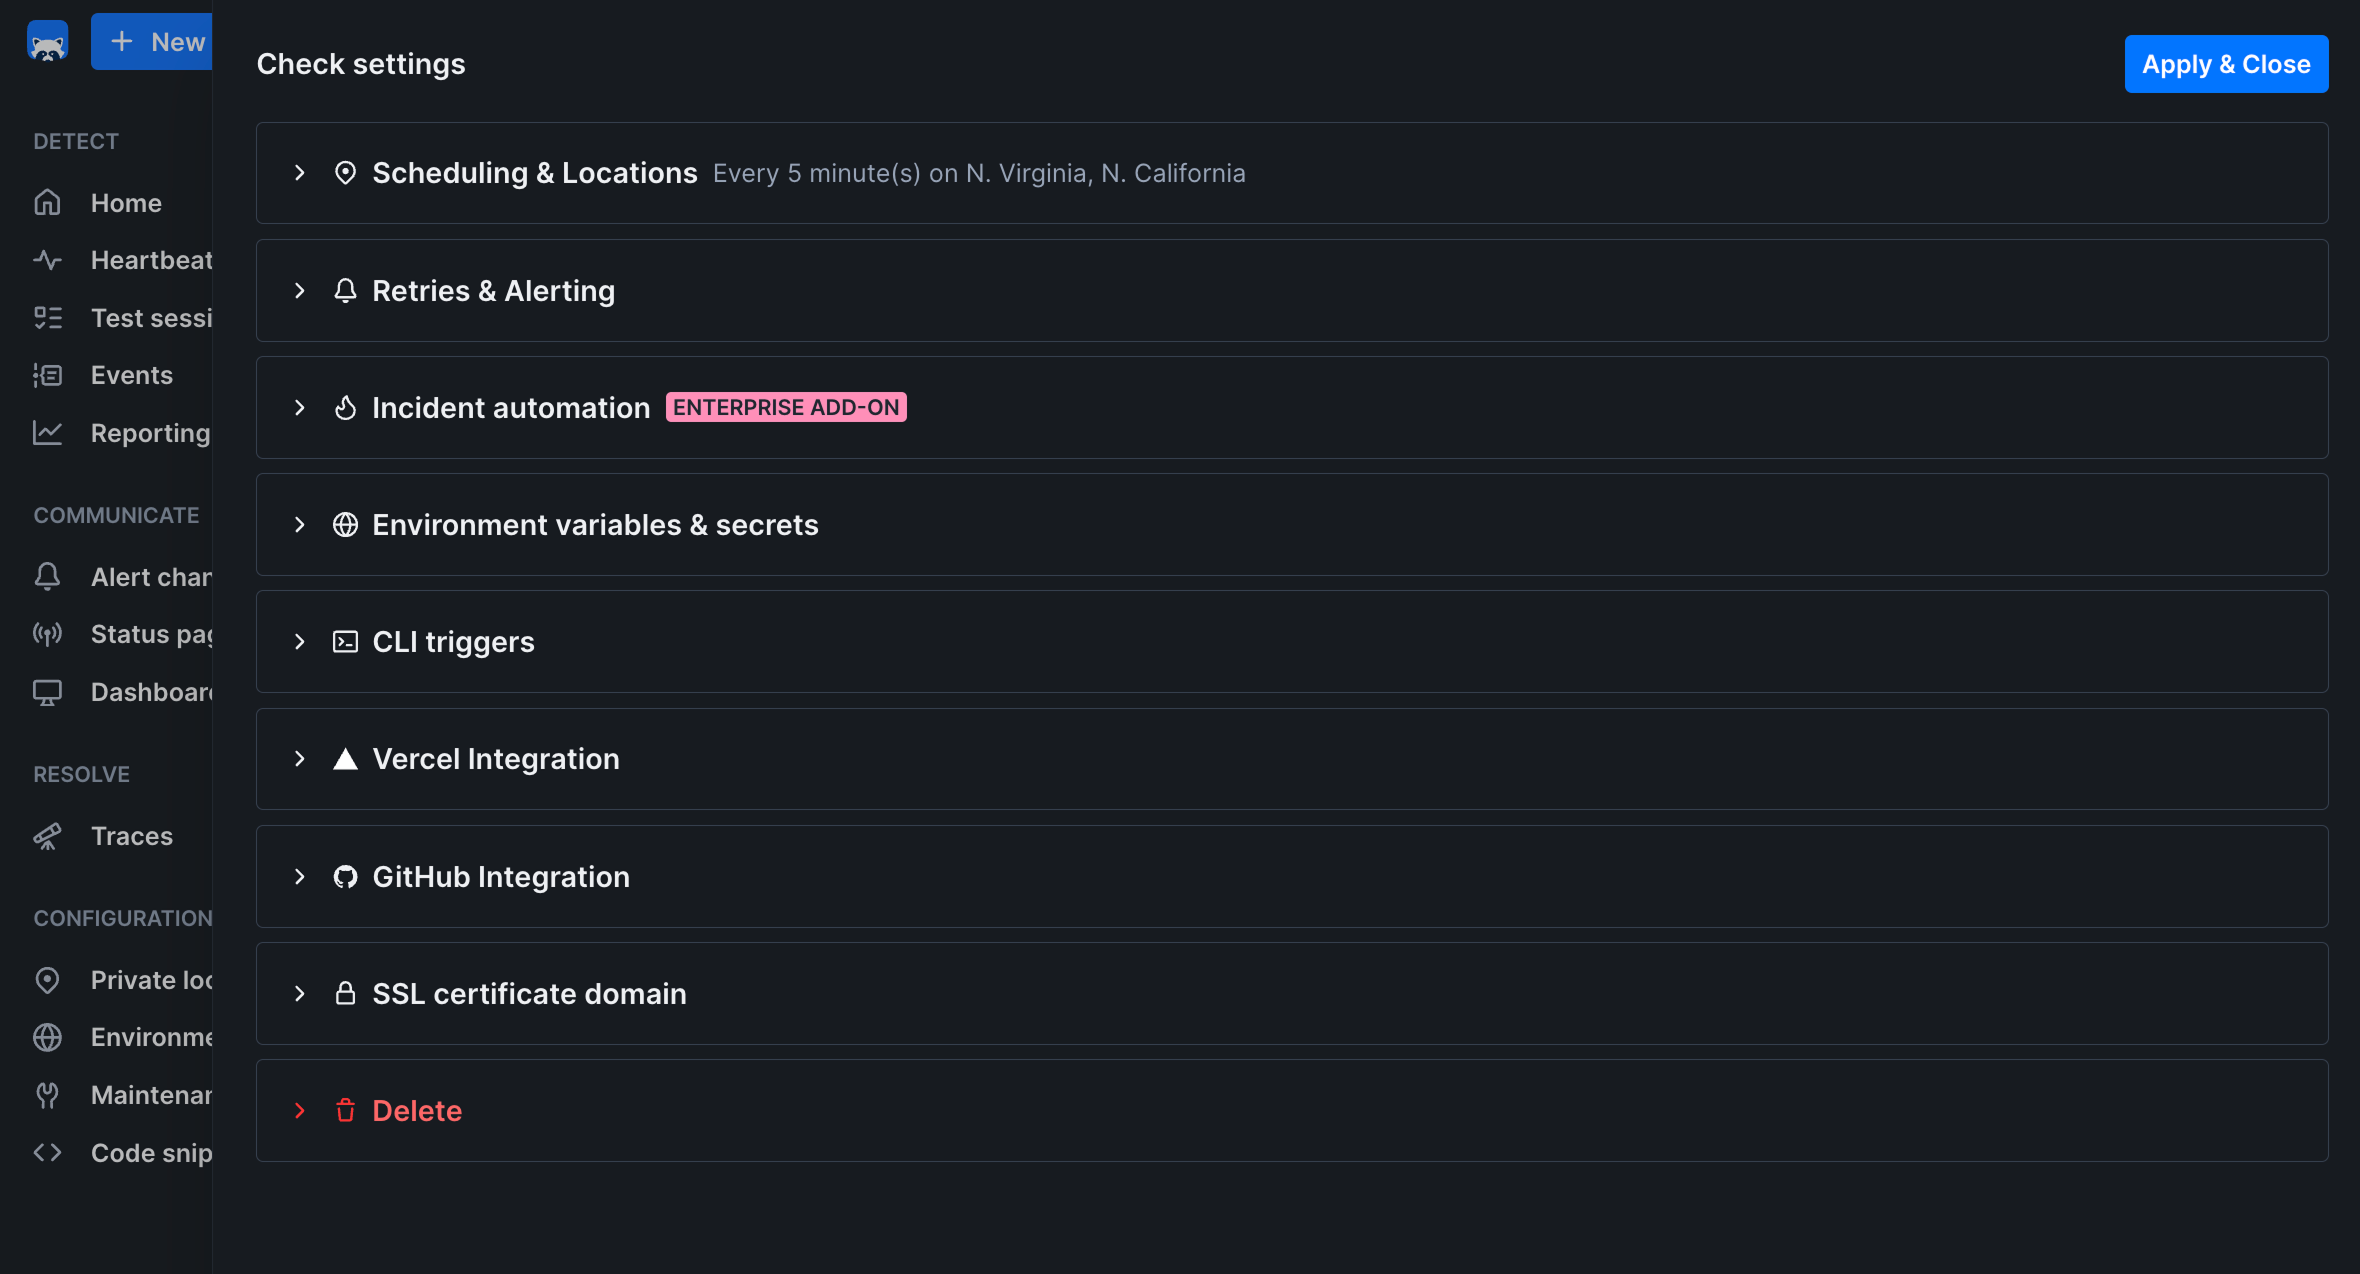
For your first check, the default settings work well. You can always adjust them later.
Test and Save
Before activating your check:
- Click “Test Check” to run it once and verify it works
- Review the results to ensure your website loads correctly
- Check for any errors in the console or network tabs
- Click “Save and Activate” to start continuous monitoring
Next Steps
Now that you have your first check running:- Add API Checks: Monitor your backend services and APIs
- Create Check Groups: Organize related checks together
- Set up Status Pages: Share uptime information with users
- Explore Integrations: Connect with Slack, PagerDuty, or other tools
Upgrading to Monitoring as Code
As your monitoring needs grow, consider upgrading to our CLI approach:- Version Control: Keep your monitoring configuration in Git
- Team Collaboration: Review changes through pull requests
- CI/CD Integration: Deploy monitoring alongside your applications
- Advanced Scripting: Write custom Playwright tests for complex flows