How to get started with Checkly and Monitoring as Code.
If you work in Operations — whether in DevOps or as an SRE — you know that technical failures, from bugs to edge cases to full-blown outages, are the primary reason users lose faith in your service. The better your team handles issues, the better your service will meet user expectations and SLAs. Every issue requires excellent tools to detect, communicate, and resolve problems, and Checkly offers industry-leading solutions for all three.
This guide is designed for DevOps engineers and SREs who work to resolve and prevent technical failures that impact the user experience.
With Checkly, you can identify failures before your users do, resolve issues faster, and communicate more effectively with both users and team members. Here’s what makes Checkly different from other monitoring tools:
Teams from LinkedIn to Render have modernized their infrastructure and cut their debugging time with Checkly.
For this tutorial, we’ll monitor the status of multiple pages, with the ability to simulate deep interaction with your pages through an automated browser. Throughout, we’ll follow Checkly’s Monitoring as Code approach, setting up everything through the CLI and your preferred IDE. The result will be a Checkly dashboard that offers a high level view or your services’ status, and deep insight into the causes of failures.
Here’s a preview of our goal:
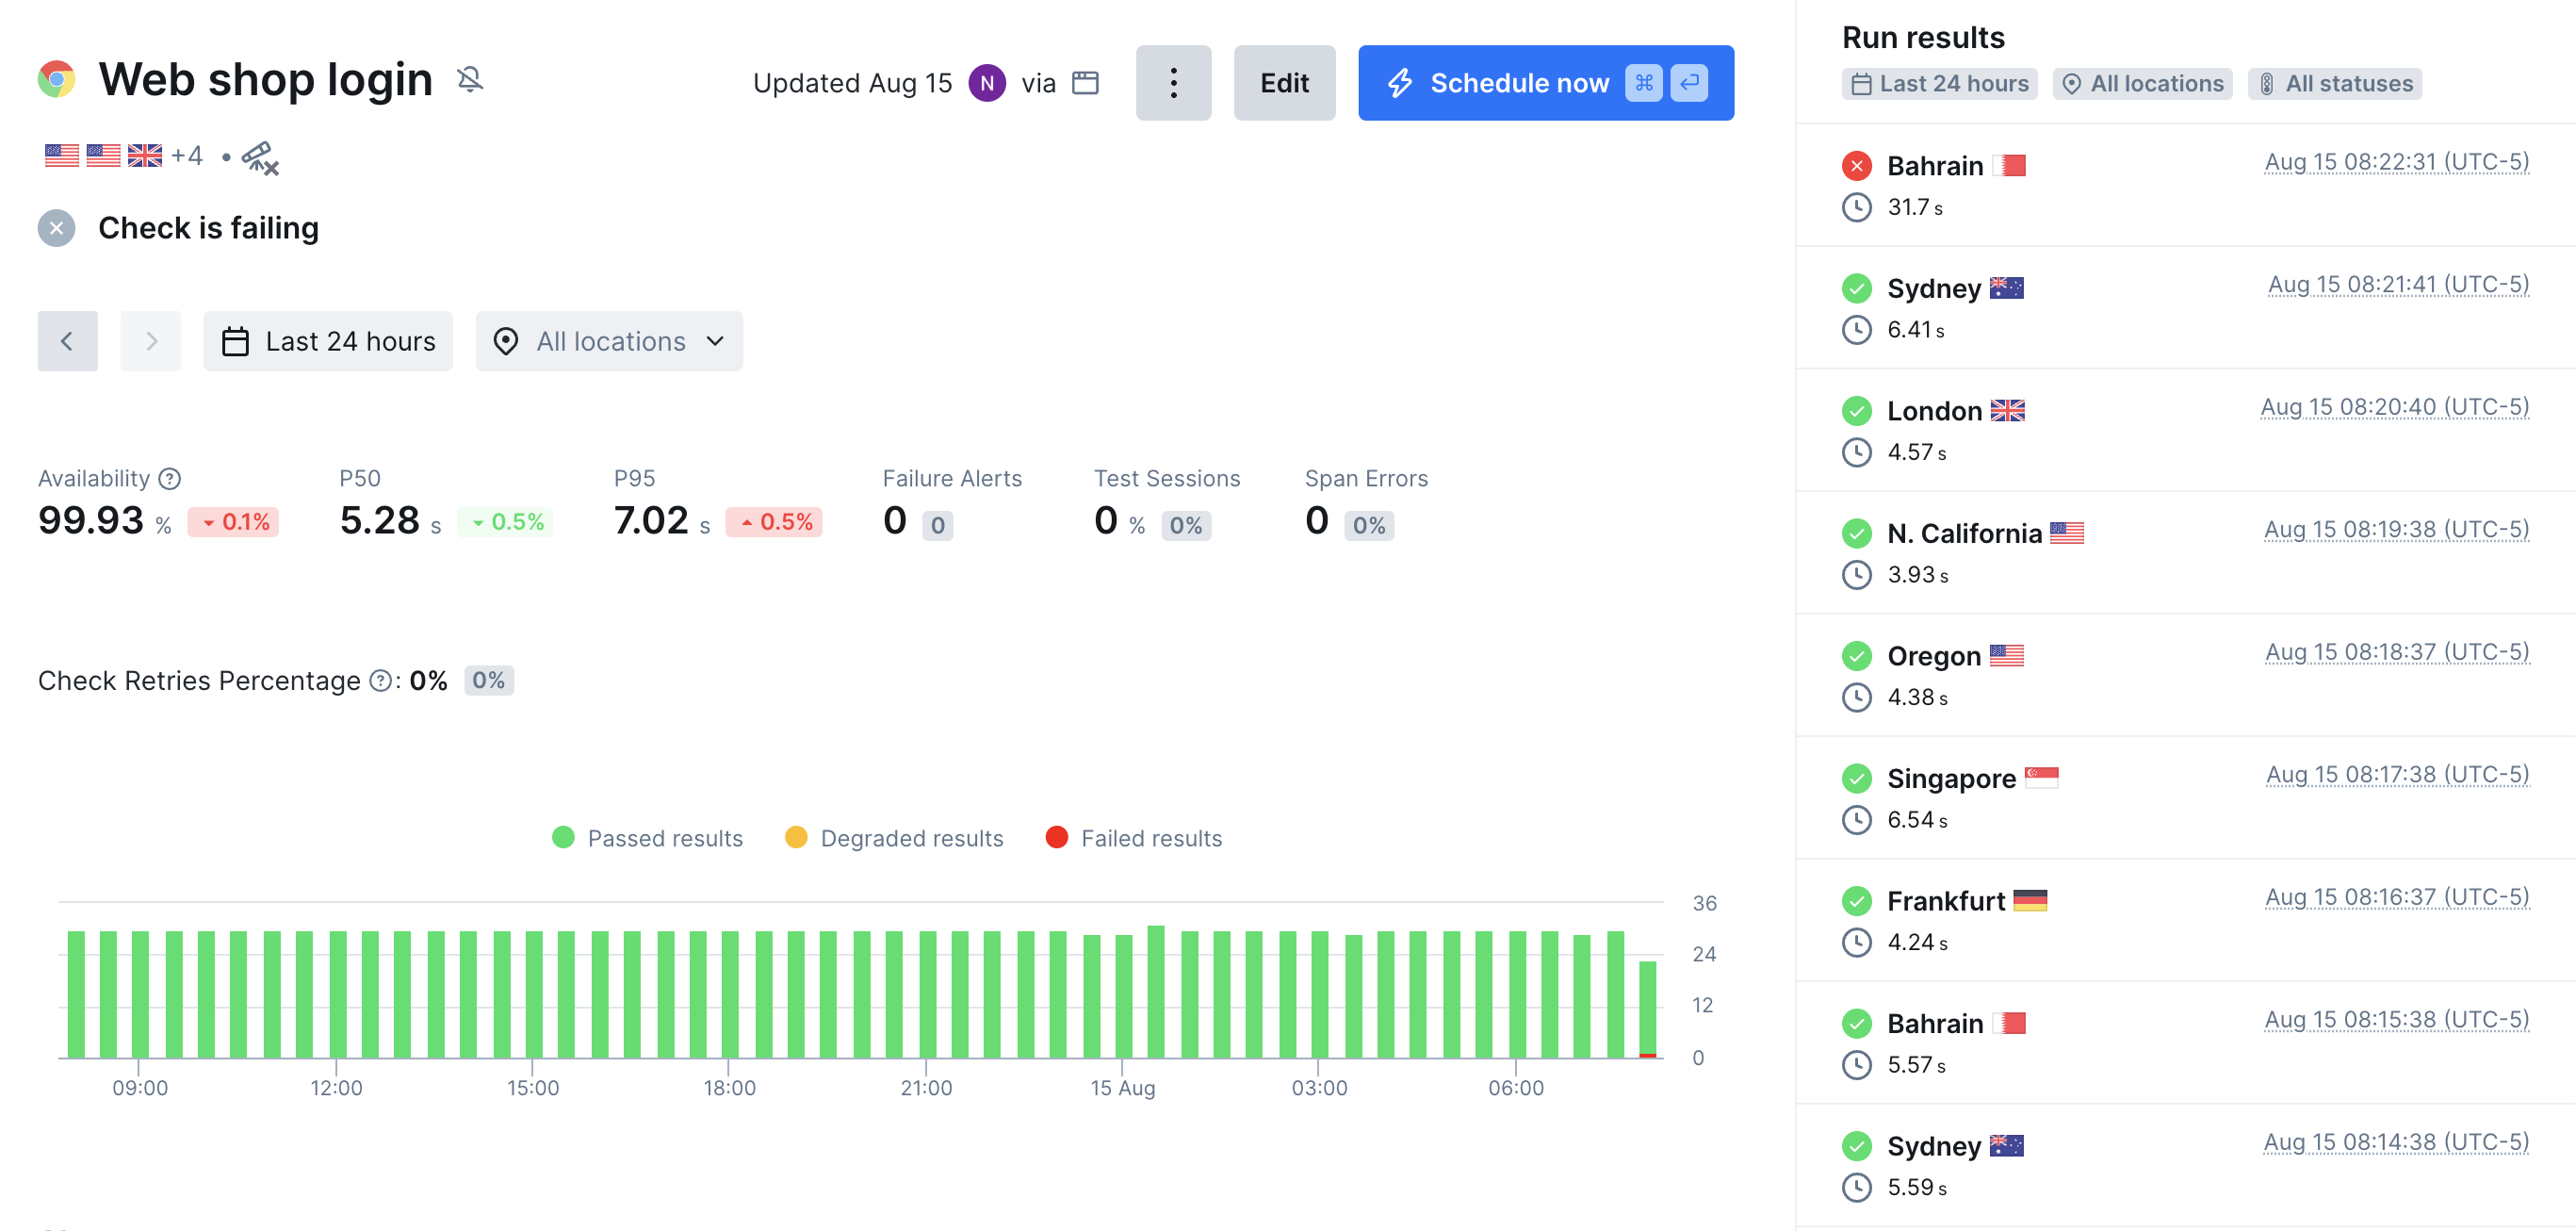
We’ll walk you through every step of the process—all you need is a site, API, or online service to monitor.
You may have already tried adding monitors from the Checkly web UI. While you can configure everything through the web UI, Monitoring as Code is more comfortable for engineers and enables faster setup of comprehensive monitoring. A huge benefit of monitoring as code is managing your monitors with source control, meaning any update to your monitoring configuration is trackable. Never again will you wonder if something changed about a monitor that is suddenly failing, you’ll know how it changed, when it was updated, and by whom!
This section will guide you through:
Start by creating a new project with:
npm create checkly@latest
You’ll get a few quick prompts on the name and setup of your project:
Hi Nica Mellifera! Let's get you started on your monitoring as code journey!
✔ Where do you want to create your new project? … detect-comm-resolve
◼ Cool. Your project will be created in the directory "/Users/nica/checkly/examples/detect-comm-resolve"
? Which template would you like to use for your new project? › - Use arrow-keys. Return to submit.
❯ An advanced TypeScript project with multiple examples and best practices (recommended)
An advanced JavaScript project with multiple examples and best practices
A boilerplate TypeScript project with basic config
A boilerplate JavaScript project with basic config
✔ Would you like to install NPM dependencies? (recommended) … yes
✔ Packages installed successfully
✔ Would you like to initialize a new git repo? (optional) … no
Dialog on setting up a new Checkly repository.
This will create a new project with this structure:
__checks__/ # All monitoring checks
├── api.check.ts # API endpoint checks
├── heartbeat.check.ts # Heartbeat monitoring (commented out)
├── homepage.spec.ts # Browser-based Playwright tests
└── url.check.ts # Simple URL monitoring
package.json # Dependencies
checkly.config.ts # Project configuration file
With a project set up, we can start writing our first monitors. Monitors come in two categories: simple and scalable uptime monitoring, and the more complex synthetic monitoring.
All monitors are created as .check.ts
files implementing the Checkly CLI construct. Here’s an example URL Monitor:
import { UrlAssertionBuilder, UrlMonitor } from 'checkly/constructs' // Import required constructs from Checkly CLI
new UrlMonitor('url-monitor-example', { // Create new URL monitor with unique logical ID
name: 'Example URL Monitor', // Human-readable name for the monitor
activated: true, // Enable the monitor to run checks
frequency: 1, // Run check every 1 minute
maxResponseTime: 10000, // Maximum response time in milliseconds before marking as failed
degradedResponseTime: 5000, // Response time in milliseconds for degraded performance warning
request: { // Configure the HTTP request settings (required)
url: 'https://httpbin.org/get', // Target URL to monitor
followRedirects: false, // Do not follow HTTP redirects (3xx responses)
skipSSL: false, // Validate SSL certificates (recommended for security)
assertions: [ // Define validation rules for the response
UrlAssertionBuilder.statusCode().equals(200),
]
}
})
To create a new URL monitor, add a new file like url-monitor.check.ts
in the __checks__/
directory. Import UrlMonitor
and UrlAssertionBuilder
from checkly/constructs
, then instantiate a new monitor with a unique logical ID, name, and request configuration. The monitor will send GET requests to your specified URL and validate HTTP status codes with UrlAssertionBuilder.statusCode().equals(200)
to ensure the endpoint returns successful responses.
URL monitors have limited assertion features, they’re primarily there to guarantee uptime with a broad reach. Uptime monitoring also includes low level checks like TCP monitors, and Heartbeat monitors which listen for pings from your automated tasks. For deeper synthetics monitoring of your endpoints, to test and monitor correctness of responses in depth, reach for synthetics checks like API checks. Thankfully, the constructs signature is very similar:
import { ApiCheck, AssertionBuilder } from 'checkly/constructs'
new ApiCheck('books-api-advanced-check', {
name: 'Books API - Advanced Validation',
alertChannels: [], //we'll add alert channes below. Currently this check will not send alerts!
degradedResponseTime: 5000,
maxResponseTime: 15000,
request: {
url: 'https://danube-web.shop/api/books',
method: 'GET',
followRedirects: true,
skipSSL: false,
headers: [{
key: 'X-My-Header',
value: 'My custom header value'
}],
assertions: [
// Validate HTTP response status
AssertionBuilder.statusCode().equals(200),
// Check response headers
AssertionBuilder.headers('content-type').contains('application/json'),
// Validate first book has required fields
AssertionBuilder.jsonBody('$[0].id').isNotNull(),
AssertionBuilder.jsonBody('$[0].price').isNotNull(),
// Check that title and author are not empty
AssertionBuilder.jsonBody('$[0].title').notEmpty(),
AssertionBuilder.jsonBody('$[0].author').notEmpty(),
// Validate price is positive
AssertionBuilder.jsonBody('$[0].price').greaterThan(0),
// Check that we have multiple books in the catalog
AssertionBuilder.jsonBody('$.length').greaterThan(1),
// Validate response time
AssertionBuilder.responseTime().lessThan(3000)
],
},
runParallel: true,
})
All of these assertions are available in the AssertionBuilder
section of the constructs API. You can go even further with API checks: from running scripts before each check to evaluating JSON responses. These advanced options are covered in detail in our documentation site. With Checkly CLI constructs you can create and configure every type of monitor, and feed it any variation of configuration. Some extensions of API checks include:
We can extend the principles here to create multiple monitors from a single file. In this example we provide an array of URLs to monitor and create as many URL monitors as we need.
import { UrlAssertionBuilder, UrlMonitor } from 'checkly/constructs'
// Configuration: URLs to monitor
const urlsToMonitor = [
'https://danube-web.shop/',
'https://danube-web.shop/api/books',
'https://httpbin.org/get',
'https://httpbin.org/status/200'
]
// Loop through each URL and create a monitor
urlsToMonitor.forEach((url, index) => {
// Extract domain name for monitor ID
const domain = new URL(url).hostname.replace('www.', '')
// Generate unique logical ID for each monitor
const logicalId = `multi-url-monitor-${index + domain}`
new UrlMonitor(logicalId, {
name: `Multi URL Monitor - ${url}`,
activated: true,
request: {
url: url,
followRedirects: true,
skipSSL: false,
assertions: [
UrlAssertionBuilder.statusCode().equals(200),
]
}
})
})
This example shows the power of constructs for creating monitors. However, real world implementations would probably query a list of URLs from an endpoint rather than having the array of URLs hard-coded.
Notice that the check above isn’t configured with a maxResponseTime
, alertChannels
, and several other settings. Without these settings the project defaults in checkly.config.ts
will be used. We could also assign checks to a group to manage a subset of checks with one configuration. More detail on groups is covered in the Checkly documentation. There’s more detail on alert thresholds and how alerts are communicated in part 2, below.
We can test this file (and the others added above) with the npx checkly test
command, which will scan the /__checks__
directory and run all of our checks through the Checkly monitoring network.
__checks__/multiple-url-monitor.check.ts
✔ Multi URL Monitor - https://danube-web.shop/ (223ms)
✔ Multi URL Monitor - https://danube-web.shop/api/books (222ms)
✔ Multi URL Monitor - https://httpbin.org/get (301ms)
✔ Multi URL Monitor - https://httpbin.org/status/200 (284ms)
__checks__/url-monitor-example.check.ts
✔ Example URL Monitor (2s)
__checks__/books-api-advanced-check.check.ts
✔ Books URL (233ms)
6 passed, 6 total
With tests passing, we’re ready to deploy our first set of checks.
checkly.config.ts
and edit the projectName
and logicalId
values in the config file. You’ll also want to look at the other defaults set here to make sure they make sense as global defaults for your Checkly project.npx checkly deploy -p
to see a preview of what checks will be created, make sure this list is consistent with what you expect to change in your Checkly project.npx checkly deploy
command.Here’s the response from a deployment:
$npx checkly deploy
Parsing your project... ✅
Validating project resources... ✅
Bundling project resources... ✅
✔ You are about to deploy your project "New Walkthrough Project" to account "nica@checklyhq.com". Do you want to continue? … yes
Successfully deployed project "New Walkthrough Project" to account "nica@checklyhq.com".
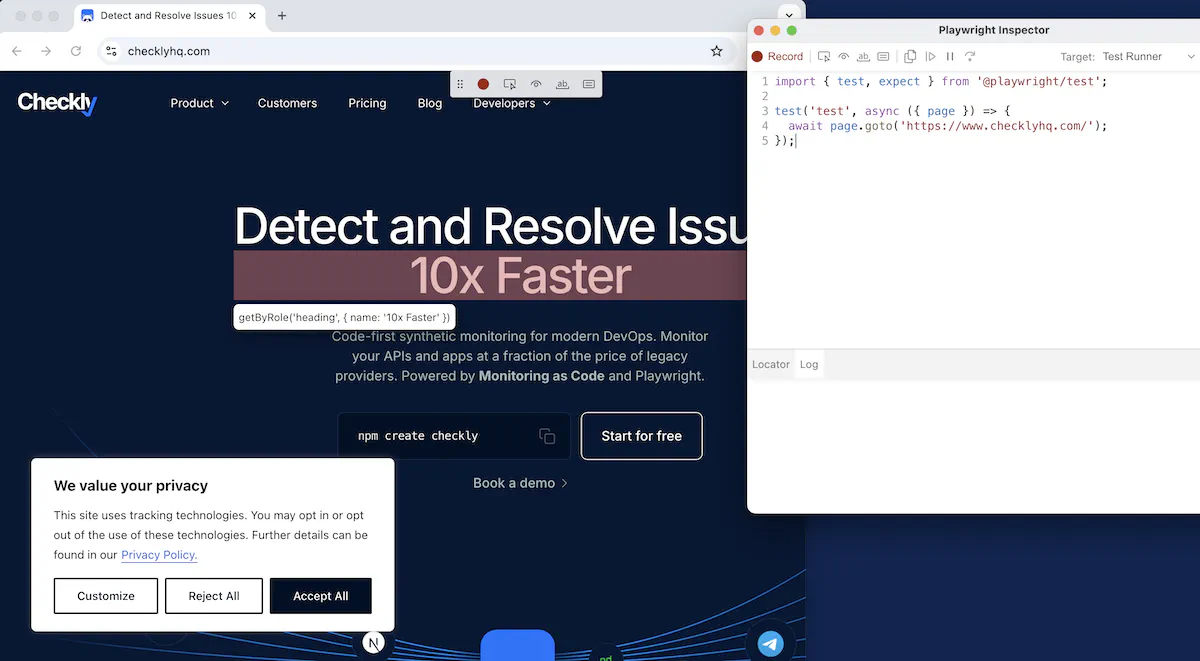
While uptime monitors will ensure that our services are responding and their responses contain valid-looking data, to really test every edge case and user path through our application, we want synthetic monitoring. With Playwright, we can simulate a user’s behavior in a browser, and get consistent, traceable results back from our checks.
If you haven’t written any Playwright tests before, don’t worry. This tutorial will show you how to go from simple button clicking to simulating complex user behavior without having to learn a whole new framework.
To create our first Playwright check, we’ll use the Playwright codegen
tool to capture our behavior in a browser:
npx playwright codegen https://[your site].com
A Chromium browser and a new “Playwright inspector” window should appear. As you click through your site, you’ll see codegen
generating the test script that will follow your path.
codegen
captures your inputs and lets you add assertions, the process is fully documented on our documentation site.
Once you’re happy with the scripted test, copy the code into a .spec.ts
file, and create a construct for your check as a .check.ts
file, based on the CLI constructs; this time for browser checks. Here’s an example of a check for the demo site Danube Web Shop:
import { AlertEscalationBuilder, BrowserCheck, RetryStrategyBuilder } from 'checkly/constructs'
new BrowserCheck('browse-danube-homepage-v1', {
name: 'Browse Danube Homepage',
code: { //where to look for the Playwright script for this check
entrypoint: './homepage-browse.spec.ts',
},
//the settings below are common to all check types mentioned above
activated: true,
muted: true,
shouldFail: false,
locations: [
'us-east-1',
'us-west-1',
],
frequency: 30,
// what must happen to generate an alert
alertEscalationPolicy: AlertEscalationBuilder.runBasedEscalation(1, {
amount: 0,
interval: 5,
}, {
enabled: false,
percentage: 10,
}),
//how are retries spaced, and how many to perform
retryStrategy: RetryStrategyBuilder.linearStrategy({
baseBackoffSeconds: 60,
maxRetries: 2,
maxDurationSeconds: 600,
sameRegion: true,
}),
runParallel: true,
})
import { test, expect } from '@playwright/test';
test('test', async ({ page }) => {
// Navigate to the homepage
await page.goto('https://danube-web.shop/');
// Click on text element containing "Haben oder haben"
await page.getByText('Haben oder haben').click();
// Click the "Add to cart" button to add the item to shopping cart
await page.getByRole('button', { name: 'Add to cart' }).click();
// Click on a generic link element (breadcrumb)
await page.getByRole('link').click();
// Click on a link containing "Fantasy" text (a category filter)
await page.locator('a').filter({ hasText: 'Fantasy' }).click();
// Assert that "The Polar Turtle" product text is visible on the page
await expect(page.getByText('The Polar Turtle')).toBeVisible();
// Assert that the price "$9" is visible (using .first() to get the first occurrence)
await expect(page.getByText('$9').first()).toBeVisible();
});
Much of the content of the .check.ts
file will look familiar by this point, as much of this configuration is shared by all check types. If you’ve not used Playwright tests before, all of homepage-browse.spec.ts
will be new. Playwright’s codegen
tool will generate best practices Playwright, using the preferred type of locators for each element you click.
You can see in the script one of the many advantages of the Playwright framework by noticing what’s missing: there are no wait()
lines for the check to pause and wait for the site to load! Playwright’s auto-waiting makes it unnecessary to add manual waiting to have our script work. Instead, Playwright will continually attempt to click the item, and do so as soon as it’s available.
In this first check, we’ve made only straightforward assertions of visible page elements, but this script will run in a full environment when deployed to Checkly, so we can do any type of scripted assertion we like: compare the page contents to the result of an API request, or parse the page in detail to compare to configuration value, it’s all possible. Our documentation site goes very deep into Playwright fundamentals and advanced use cases.
Once our check looks right, it’s time to run
npx checkly test homepage-browse
The same command used in a previous section ran everything in the /__checks__
directory, but we can specify a file or part of a name to only run matching tests.
Running 1 checks in eu-west-1.
__checks__/homepage-browse.check.ts
✔ Browse Danube Homepage (6s)
1 passed, 1 total
Now that issues have been detected with proactive monitoring, we need to plan how our team will find out about problems. Checkly lets you customize what notifications your team receives, the information in those notifications, and the thresholds where a monitor decides that a particular check is failing.
By setting up alert rules, you can define conditions—such as consecutive failures or specific error responses—that trigger alerts. You can also configure how to handle retries before generating an alert, and whether reminder messages go out for an ongoing alert. This is particularly useful for handling transient network issues or brief API hiccups. Well-tuned alerting policies allow your DevOps or SRE team to quickly identify and investigate issues before they escalate, without burdening the team with many false alarms. All of these settings are covered in the alertSettings
portion of the construct for any monitor.
alertSettings: {
reminders: { // Controls reminder notifications after initial alert
amount: 0, // Number of reminder notifications to send (0 = no
reminders)
interval: 5 // Time interval in minutes between each reminder
notification
},
escalationType: "RUN_BASED", // Sets escalation trigger type (RUN_BASED or TIME_BASED)
runBasedEscalation: { // Configuration for run-based escalation
triggers
failedRunThreshold: 1 // Number of consecutive failed runs before
escalating alert
},
timeBasedEscalation: { // Configuration for time-based escalation
triggers
minutesFailingThreshold: 5 // Minutes check must be failing before
escalating alert
}
These settings just like all the settings in this section can be managed at the individual check level, as a group, or across the whole project in the checkly.config.ts
file.
Along with carefully controlling when alerts go out after detecting failure, it’s important to control alert channels.
To ensure your team is promptly notified of outages, configure Checkly alerts to send notifications through channels like email, Slack, PagerDuty, or webhooks. In your Checkly CLI constructs, you can create alert channels like this example which creates an SMS alert channel:
import { SmsAlertChannel } from 'checkly/constructs'
const smsChannel = new SmsAlertChannel('sms-channel-1', {
name: 'Ops on-call',
phoneNumber: '+31061234567890',
})
Here’s another alert channel, this one for Slack.
import { SlackAlertChannel } from 'checkly/constructs'
export const slackChannel = new SlackAlertChannel('slack-channel-1', {
url: new URL('https://hooks.slack.com/services/YOUR/SLACK/WEBHOOK'),
channel: '#alerts',
sendRecovery: true,
sendFailure: true,
sslExpiry: true,
})
Now we can go back to our URL monitor from part 1 and update it to include multiple alert channels:
import { UrlAssertionBuilder, UrlMonitor } from 'checkly/constructs'
import { emailChannel } from './email-alert-channel'
import { slackChannel } from './slack-alert-channel'
import { webhookChannel } from './webhook-alert-channel'
new UrlMonitor('url-monitor-example', {
name: 'Example URL Monitor',
activated: true,
frequency: 1,
maxResponseTime: 10000,
degradedResponseTime: 5000,
alertChannels: [emailChannel, slackChannel, webhookChannel], // Array of alert channels to notify when check fails or recovers
request: {
url: 'https://httpbin.org/get',
followRedirects: false,
skipSSL: false,
assertions: [
UrlAssertionBuilder.statusCode().equals(200),
]
}
})
Integrating alerting with incident management tools ensures seamless communication during outages. For example, connecting Checkly with PagerDuty can automatically open incidents, while Slack alerts keep the team informed in real time. Of course you can also send alerts out to a webhook to connect with your DIY alerting solution. By combining proactive alerting with smart retry logic, you create a robust monitoring system that keeps your DevOps or SRE team focused on resolving critical issues.
For communicating directly with your users, teams should explore status pages to automatically communicate downtime or degraded performance.
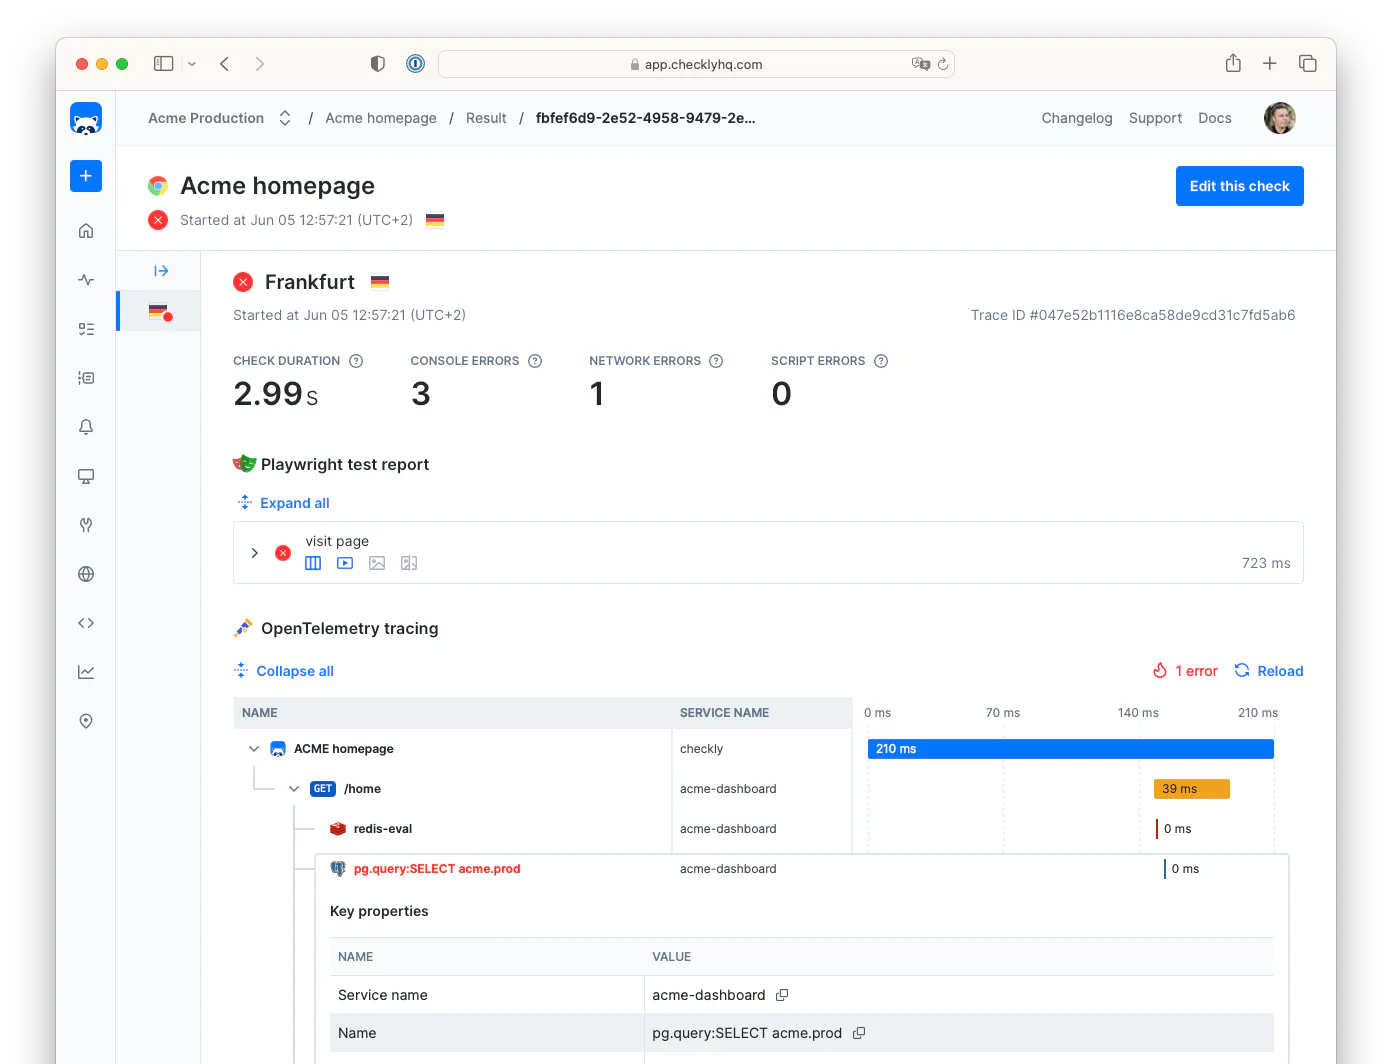
Now that the problem is detected and our team has been alerted, it’s time to repair the issue. This will take us away from Monitoring as Code and into the Checkly dashboard UI where we can get a high level view of monitor performance, then zoom in to individual failures and their causes.
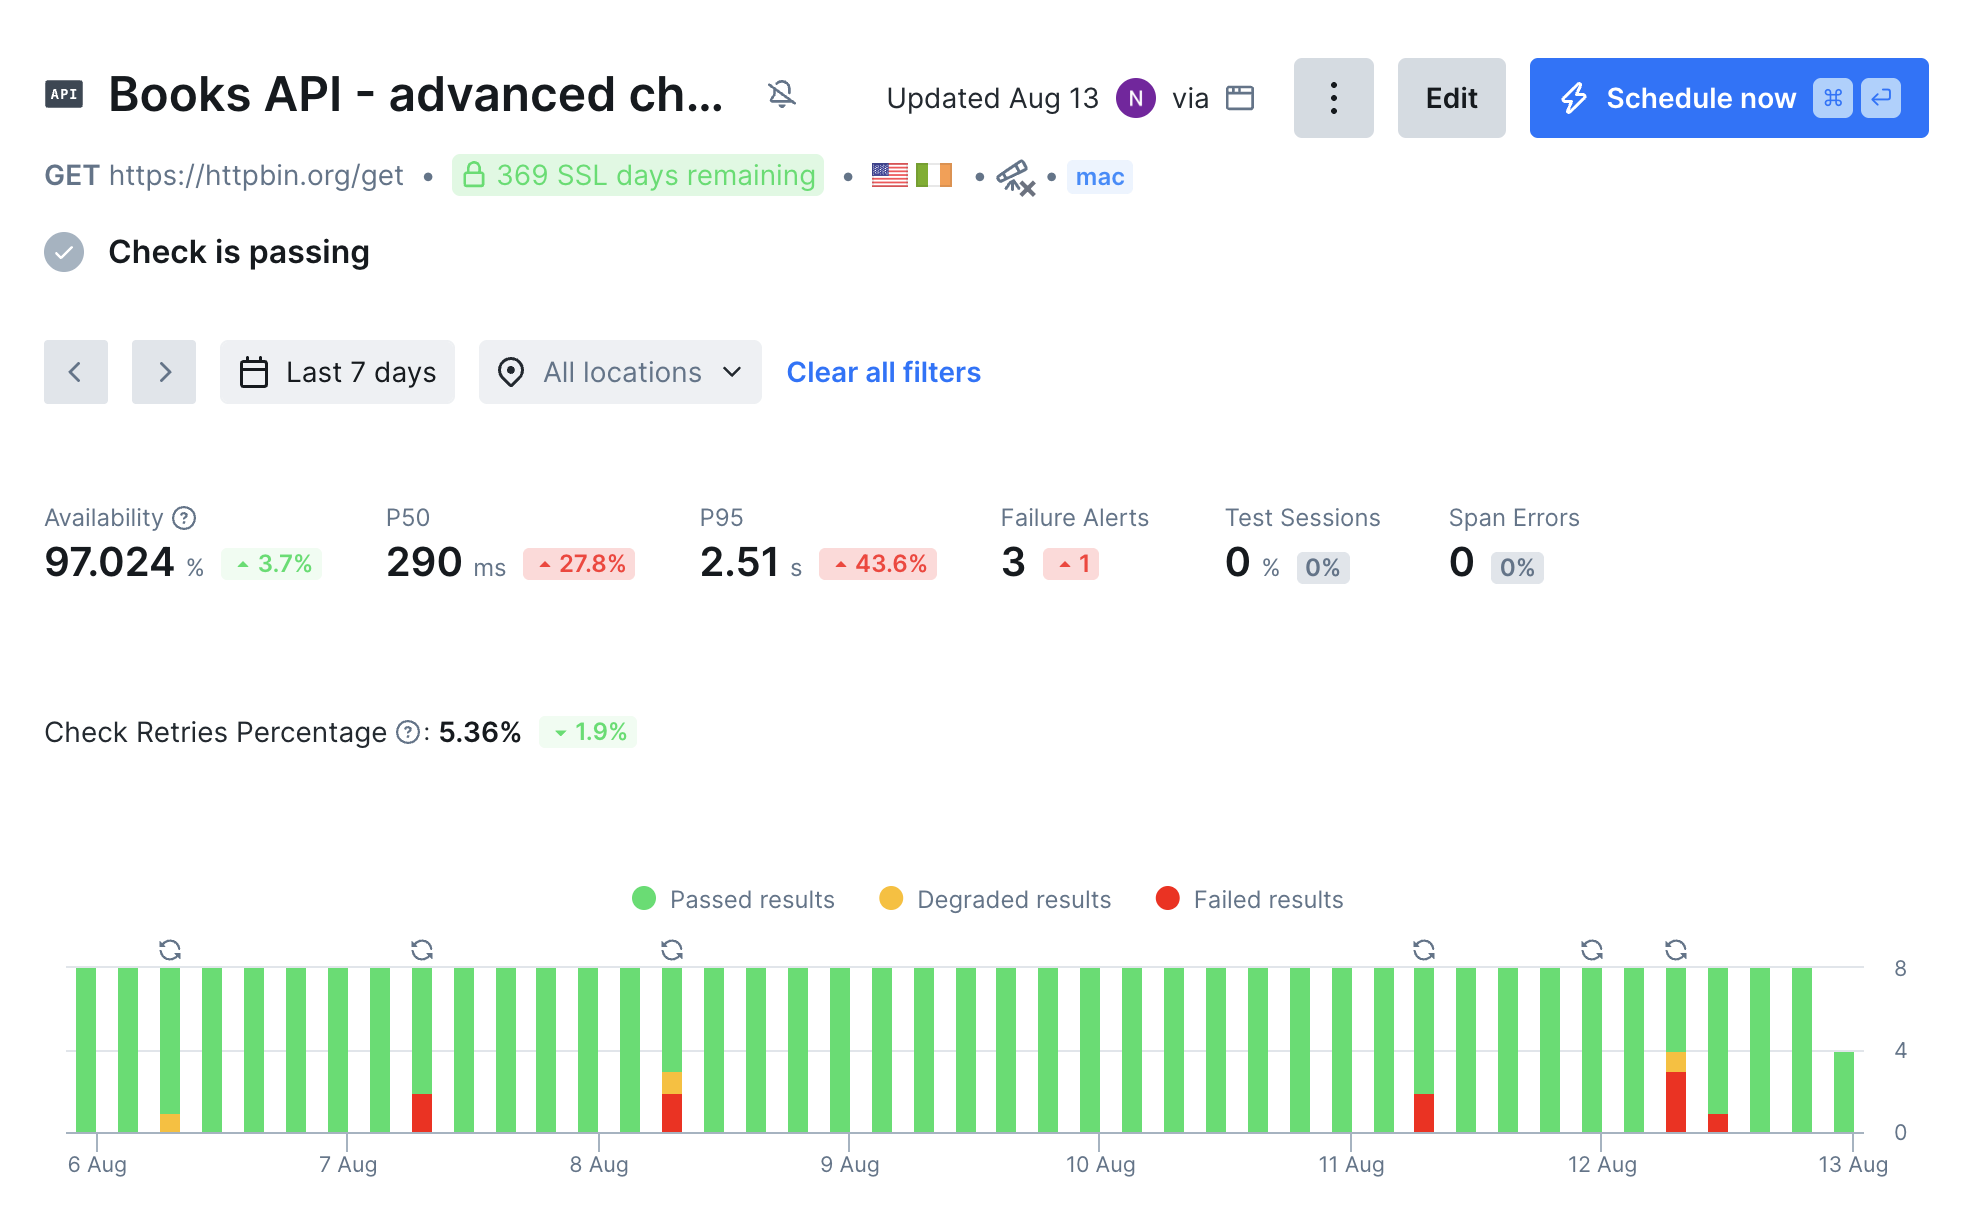
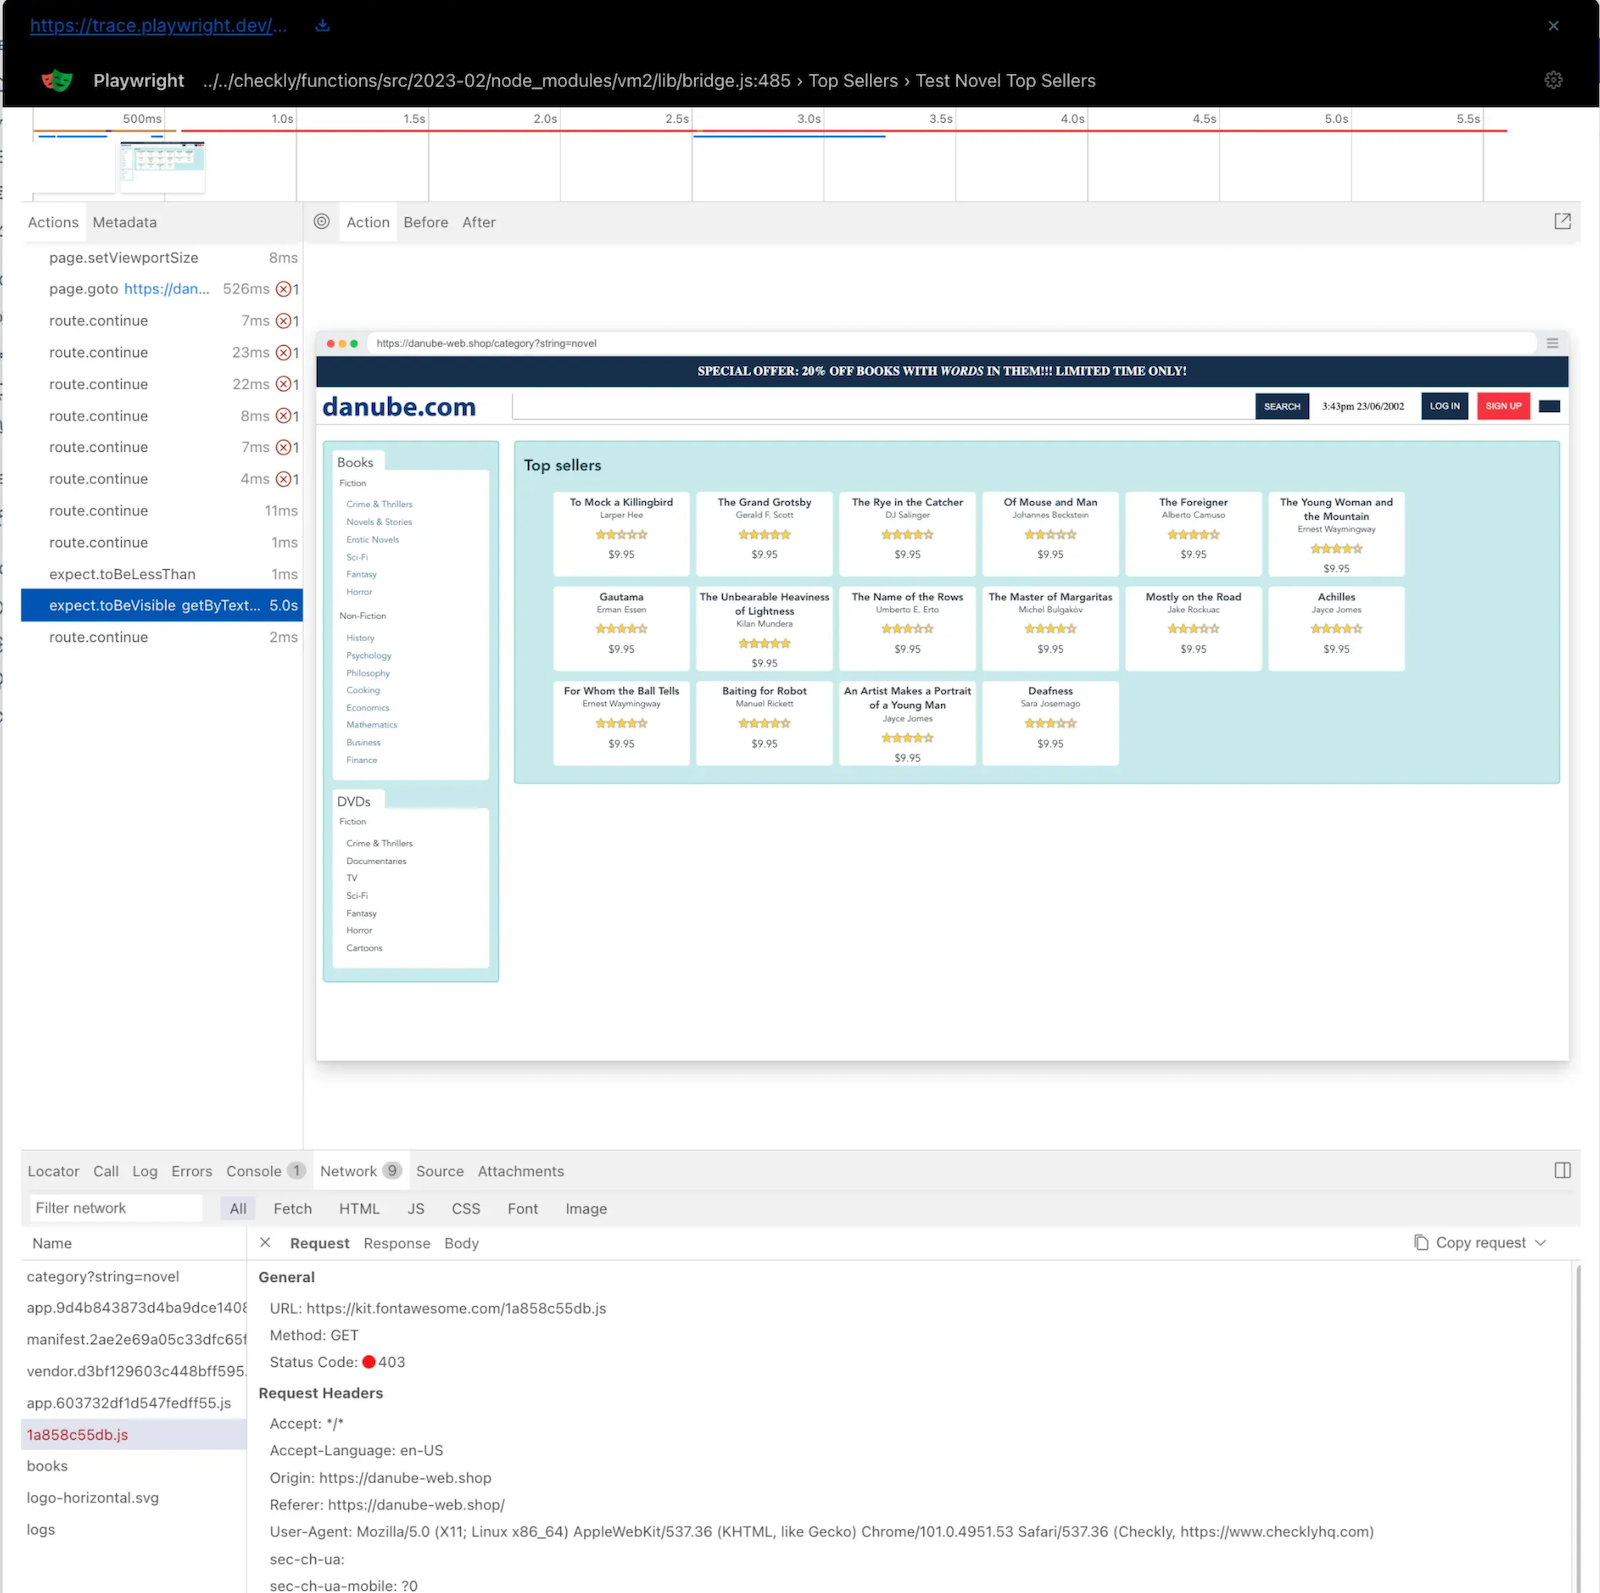
From a high-level view it’s easy to see this API, while usually available, has repeated failures in the recent past.
For API checks, failed check runs will generate a report that contains the response received and the timing of the request.
For browser checks, Checkly provides detailed traces and execution logs that help you diagnose why a check failed, offering insights into issues like slow response times, HTTP errors, or script failures. By reviewing the Trace View, you can examine each step of a check’s execution, including network requests, console logs, and screenshots from the browser check’s run. This granular data allows your team to pinpoint whether a failure stems from backend latency, third-party API issues, or frontend rendering problems. Additionally, Checkly’s error messages and stack traces simplify debugging, helping your team quickly identify root causes and implement fixes. Whether the issue is a timeout, a broken assertion, or a resource loading failure, Checkly’s trace data ensures you have the context needed to resolve incidents efficiently.
When your browser check fails, Checkly stores a Playwright trace to offer in-depth, moment-by-moment reviews of what the browser saw as it tried to load the page.
If you’re interested in adding back-end tracing information, explore Checkly Traces to send back-end OpenTelemetry trace data to Checkly for requests initiated by Checkly synthetic requests. See the whole process on our documentation site.
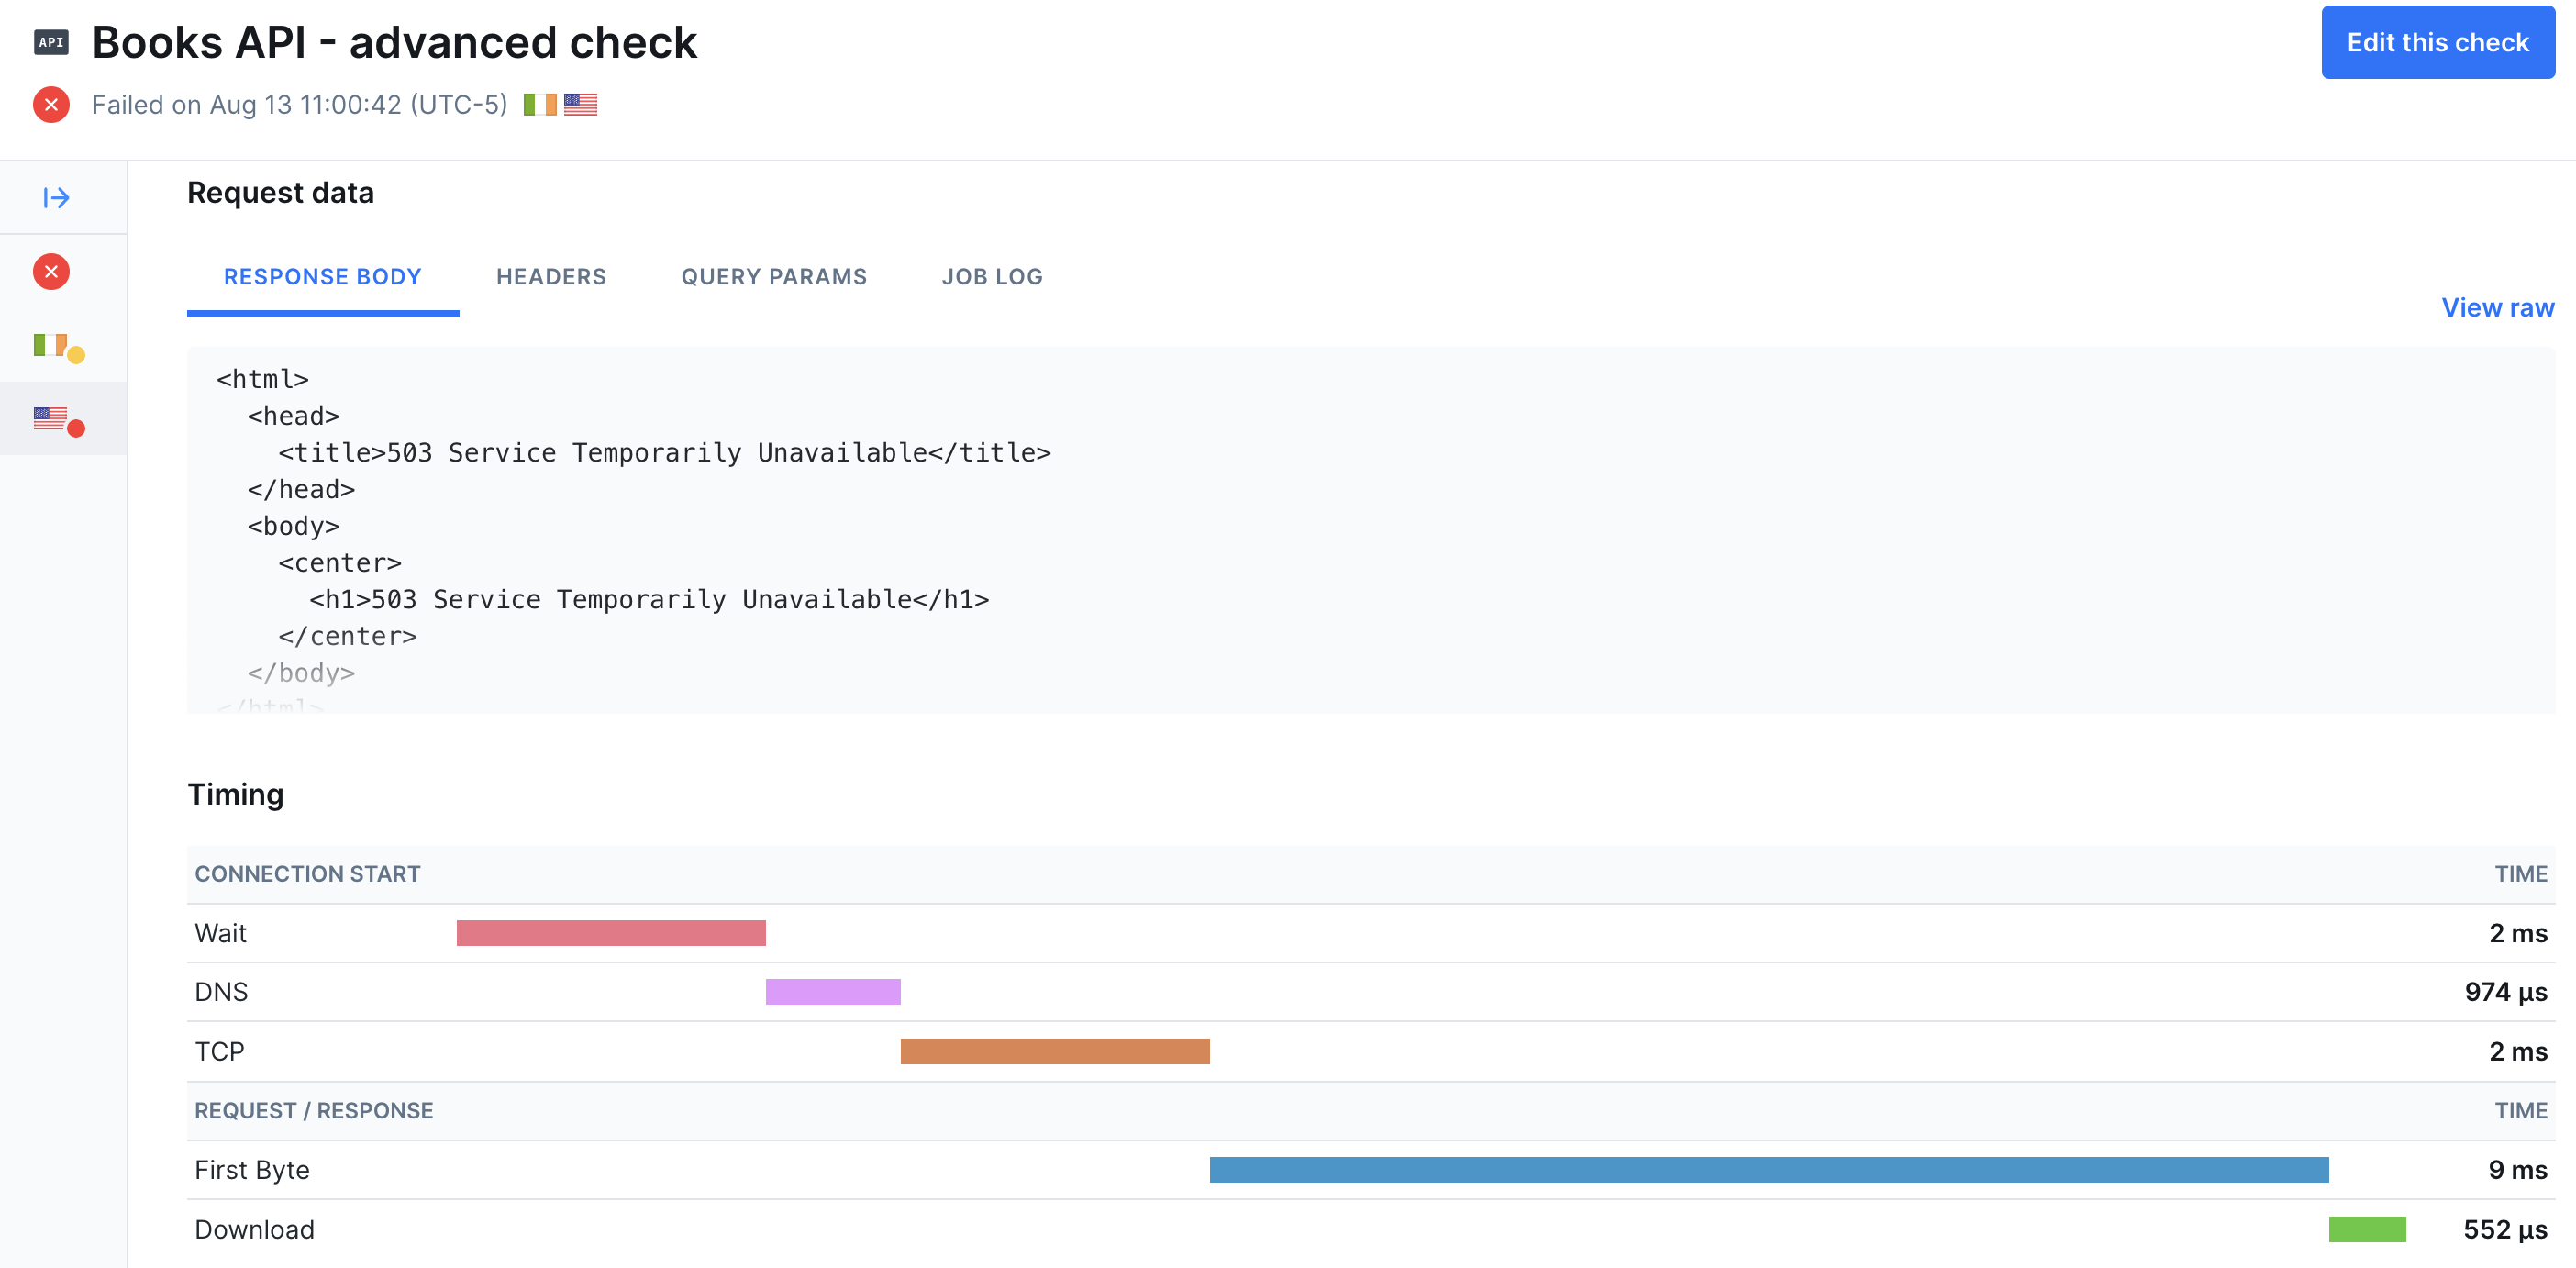
Technical failures are inevitable, but with Checkly, your team can minimize their impact by quickly detecting issues, communicating them effectively, and resolving them before users are affected.
Detect Problems Before Users Do
Checkly’s monitoring tools—from simple uptime checks to complex Playwright-based synthetic tests—ensure you catch issues early. By implementing Monitoring as Code, you maintain consistency, version control, and scalability across your monitoring setup.
Communicate Clearly During Outages
With customizable alerting policies and multiple notification channels (Slack, PagerDuty, SMS, and more), your team stays informed the moment an issue arises. Well-tuned alerting reduces noise while ensuring critical failures get immediate attention. Teams can use status pages to communicate directly with their users.
Resolve Issues Faster with Deep Insights
All checks offer high-level views of the status of your monitors, which can show patterns of performance over time. For API checks, you can see failed check’s full responses and the timing of the requests. Browser checks offer the most insight into failures with detailed Playwright traces, screenshots, and logging from the check execution.
With Checkly, you don’t just monitor your services—you ensure they meet user expectations. Start detecting, communicating, and resolving issues faster today.
🚀 Try Checkly now and build a more reliable service.