

Table of contents
What is Synthetic Monitoring?
Synthetic monitoring is a proactive approach that actively tests websites or apps, either scheduled or on demand, using automated testing scripts, ensuring that any issues are identified and resolved before they impact real users. This approach provides continuous oversight of the online presence, akin to having a vigilant eye on the website 24/7.
In this article, we’re discussing synthetic monitoring, putting the accent on using browsers.
What is Browser Synthetic Monitoring?
Browser Synthetic Monitoring involves using virtual agents to constantly check the performance of a website or application. These agents simulate user actions, ensuring the production site runs smoothly regardless of user activity. There are two main methods used in Browser Synthetic Monitoring:
- Scheduled Jobs: These routine checks occur automatically at set intervals to ensure consistent performance metrics.
- On-Demand Snapshots: This is a manual check that can be initiated at any time to obtain an instant snapshot of the website's performance.
Browser Synthetic Monitoring can be deployed in the form of agents. These agents simulate user actions and can be categorized into two types:
- Synthetic Hosted Agents: These are external agents provided by monitoring services, suitable for testing public websites.
- Synthetic Private Agents: These are installed and hosted on the users’ machines, making them ideal for checking the performance of internal sites and services.
In contrast to Real User Monitoring (RUM), which tracks the interactions of actual users, synthetic monitoring does not rely on real user data. Instead, it gathers performance data using simulated interactions. This proactive monitoring solution allows for the identification and resolution of issues before they affect real users, contributing to a seamless user experience.
In synthetic monitoring, availability refers to the ability of a system or service to be accessible and operational for users. It measures the uptime and accessibility of an application, network, or website from various locations and devices. Ensuring high availability involves continuous checks and simulations to detect any downtime or performance issues proactively.
Correctness, on the other hand, pertains to the accuracy and reliability of the monitored data or responses obtained during synthetic monitoring tests. It involves verifying that the expected outcomes align with the actual results, and ensuring that the monitored system functions accurately without errors or discrepancies. Maintaining correctness involves meticulous validation of responses against predefined benchmarks or expected behaviors.
Both availability and correctness are critical aspects of synthetic monitoring, as they collectively ensure that systems or services not only remain accessible but also deliver accurate and reliable performance, contributing to a positive user experience and overall system reliability.
Types of Browser Synthetic Monitoring
Browser Synthetic Monitoring offers diverse approaches to assess website and application performance. The following types cater to various testing needs:
- Single-URL Monitors: Simulates a user visiting a specific URL and can provide information such as availability and performance measured from different locations.
- Browser Clickpaths: Mimics user navigation through a site, automatically testing availability and performance at scheduled intervals. Moreover, it can also report on UI bugs or unexpected functionality.
- Mobile Simulation: Simulates mobile interactions to assess the availability and performance of mobile applications and websites.
Each monitoring type serves specific purposes, allowing organizations to comprehensively ensure the availability, reliability, and performance of their websites and applications.
Browser Synthetic Monitoring vs. Real User Monitoring
Browser Synthetic Monitoring and Real User Monitoring (RUM) are two distinct approaches to website and application monitoring. Understanding the differences between them is crucial for implementing a comprehensive performance monitoring strategy. Here is a breakdown of both methods:
| Features | Browser Synthetic Monitoring | Real User Monitoring |
|---|---|---|
Approach | Simulates user interactions with scripted tests, ensuring a proactive check on application health. | Observes actual user interactions, offering insights into long-term trends in application performance. |
Use Case | Ideal for catching short-term issues during development or in a live environment, or tracking long-term performance metrics. | Valuable for understanding user experience over time after the application is deployed. |
Implementation | Uses testing scripts to mimic user actions, providing quick insights into application performance. | Requires adding JavaScript code to your site, discreetly tracking real user traffic. |
Repeatable Check vs. Long-Term Insights | Repeatable health check for your app, perfect for early issue detection. | Acts as a constant companion, revealing app trends and patterns in user behavior. |
Combining Synthetic Monitoring and RUM
- Both synthetic monitoring and RUM are valuable in their own right and can be used together to provide a more comprehensive and robust monitoring strategy.
- Synthetic monitoring can help identify short-term issues, while RUM can provide insights into long-term performance data.
- Using both approaches together allows for a deep dive into specific issues and provides full visibility into user and service performance issues.
While synthetic monitoring is useful for early issue identification and controlled environment testing, Real User Monitoring provides insights into long-term performance trends and real user interactions within your app. Employing both approaches together can lead to a more comprehensive understanding of website and application performance, ultimately enhancing user experience and competitive advantage.
Browser Synthetic Monitoring Use Cases
Browser Synthetic Monitoring is a comprehensive approach to ensuring the optimal performance and availability of websites and applications. Before exploring its diverse use cases, let's understand why adopting this proactive monitoring strategy is essential.
Why Use Synthetic Monitoring?
Synthetic monitoring offers a proactive stance in testing and performance monitoring, availability monitoring, and functionality of websites and applications. Here are compelling reasons to consider its adoption:
- Effective Health Monitoring: Ensure the continuous availability, performance, and functionality of your application or website, guaranteeing an optimal experience for its end-users.
- Reducing MTTD: Significantly reduces mean time to detect by raising alerts before issues affect users, facilitating a quicker resolution process.
- Reducing MTTR: Help speed the investigation and resolution process by providing developers, SREs and other incident responders with detailed reports to aid in root cause analysis.
- Have Engineers Own Quality: Tracking production issues (not only bugs but also infrastructure-related problems) and being alerted every time one is detected enables engineering teams to directly take ownership of the quality of the systems they build.
Now that you understand why you should consider using synthetic monitoring over a relative substitute, let's explore its key real-life applications:
- Proactively Detect Failures: Regular checks to detect failures and ensure application availability, performance, and response times.
- Benchmarking: Establish performance benchmarks by simulating user interactions from different geographic locations, providing a baseline for optimization.
- Ensuring SLA Compliance: Monitor application performance to ensure compliance with service level agreements (SLAs), for both providers and customers.
Collectively, these use cases underscore the proactive nature of synthetic tests, their pivotal role in maintaining application performance, and their ability to provide valuable insights for optimizing the user experience while addressing potential issues before they impact real users.
Browser Synthetic Monitoring with Checkly Step-by-Step
Performance monitoring is made easy with a plethora of synthetic monitoring tools available, such as Checkly, Better Stack, AppDynamics, Datadog, Dotcom-Monitor, StatusCake, Site24x7, Uptimia, Upptime, and many more.
Choosing Checkly for Stress-Free Monitoring
With Checkly Monitoring as Code (Mac), implementing synthetic monitoring for KeyUser Flows using Playwright becomes a breeze. Here's why Checkly stands out:
- Monitoring as Code: Code, test, and deploy your testing from your local machine from development to production.
- Reuse Playwright Code Base: Reuse your existing Playwright tests as monitoring checks without the need to change them.
- Sandbox Security: Run each session in a sealed-off sandbox, providing an extra layer of security.
- Automated Debugging: Automatically collect Playwright traces, screenshots, or videos for swift debugging post-alert.
Why Choose Checkly?
With Checkly's CLI workflow, your synthetic monitoring implementation becomes a seamless process. You can be up and running in no time to ensure your crucial web apps and sites are performing up to spec. The Checkly CLI provides two main workflows:
- Coding: These encompass scripts (such as ApiCheck, BrowserCheck, or SlackAlertChannel) written in JavaScript/TypeScript. They are intended to be deployed and executed on the Checkly cloud backend.
- Command: These constitute the fundamental commands for executing your monitoring scripts. The `test` command is utilized for running monitoring checks locally or in continuous integration, while the `deploy` command is employed to push your monitoring scripts to the Checkly cloud backend.
Ready to simplify your monitoring journey? Let's guide you on implementing synthetic monitoring effortlessly using Checkly.
Step 1: Setting Up a Checkly Account
Ensure you have an active Checkly account. If not, sign up. The default free Team trial lasts for 14 days. To access advanced features beyond the trial, subscribe to a pricing plan based on your needs.

Step 2: Setting Up Checkly in Repository
After completing the installation steps, open a terminal in the directory of your project and run the following command:
npm create checklyThis command will bootstrap your repository with the basics needed to start using Checkly MaC in your project.
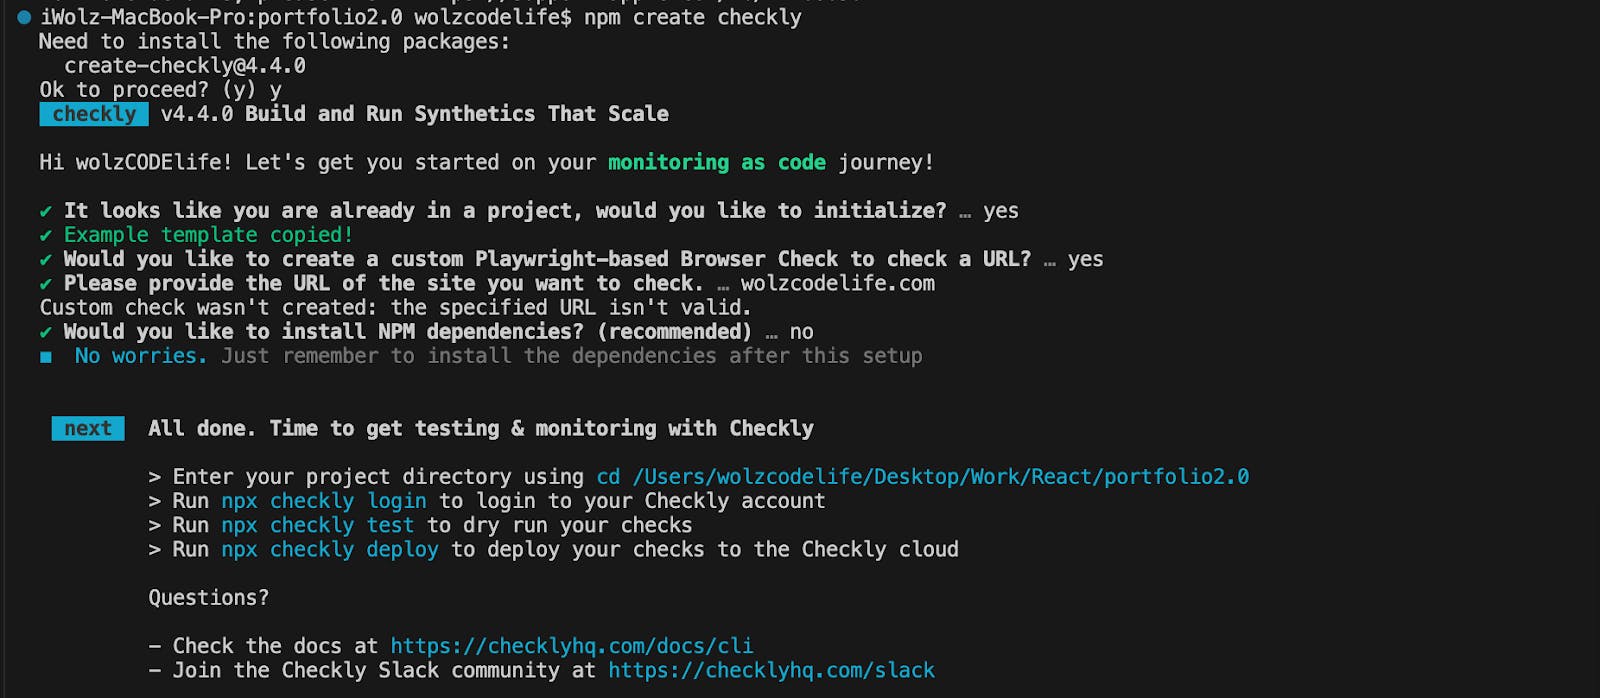
In your project directory, you will find a folder named “__checks__” containing the following test templates:
|__checks__
    |- api.check.ts
    |- heartbeat.check.ts
    |- homepage.spec.ts
Once this setup is complete, log in to your Checkly account via the CLI using the following command:
npx checkly loginYou can choose to log in from the browser or in your terminal. After logging in, you'll be able to update Checkly Checks from your local machine as long as you're connected to the internet.
Step 3: Writing Your Monitoring Scripts
In your development environment, write JavaScript/TypeScript tests for your code updates, similar to unit tests. We typically use the Playwright testing framework in the `.spec.ts` or `.check.ts` file.
Consider a scenario where you want to monitor the title of the Checkly documentation and take a screenshot of the page. To do this, replace the code in the `homepage.spec.ts` with the following:
import { test, expect } from '@playwright/test';

test('Checkly Docs', async ({ page }) => {
  const response = await page.goto('https://www.checklyhq.com/docs/browser-checks/');

  // Ensure the page is loaded successfully
  expect(response?.status()).toBeLessThan(400);

  // Check if the page title is as expected
  const pageTitle = await page.title();
  const expectedTitle = 'Introduction to Checkly | Checkly';
  expect(pageTitle).toBe(expectedTitle);

  // Optionally, you can take a screenshot if needed
  await page.screenshot({ path: 'homepage.jpg' });
});
This test uses the `page.goto` method to navigate to the specified URL (‘https://www.checklyhq.com/docs/browser-checks/’). The method returns a response object, which is stored in the response variable.
Then we use the `expect` function to assert that the HTTP status code of the response is less than 400. This is a way to ensure that the page is loaded successfully without any HTTP errors.
`page.title()` retrieves the title of the page and compares it with the expected title ('Introduction to Checkly | Checkly') using the `expect` function. This ensures that the page title matches the expected value.
Finally, we take a screenshot of the page and save it as 'homepage.jpg'.
Step 4: Running Test Sessions
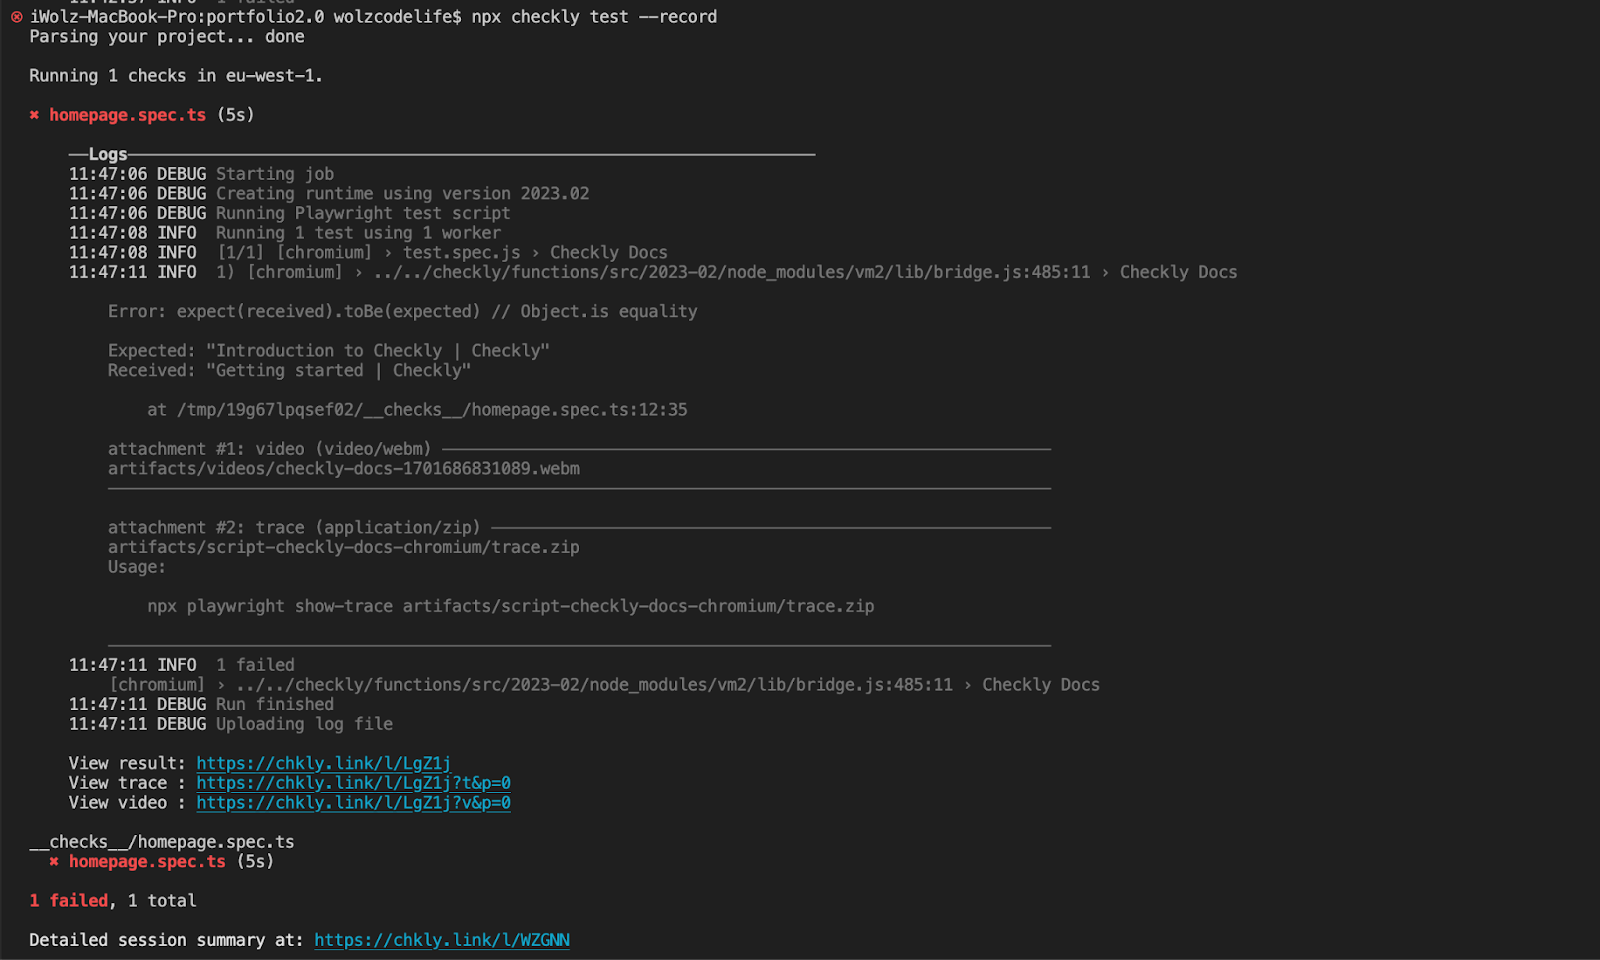
Now that we have our test scripts ready, let’s execute it. We can use the Check CLI command to execute our monitoring pipeline in our staging environment, recording the results for inspection if something fails. Run the following command in the terminal of your project repository to execute the test:
npx checkly test --recordThe `--record` flag is optional, you can use it if you want to record a test session with git info, full logging, videos and traces. `--record` sessions can be reviewed within the Checkly web interface.
Here is the result of the test we just executed:
There are also links to the detailed summary of the test at the end of the result in the terminal. Here is an example of the test summary:
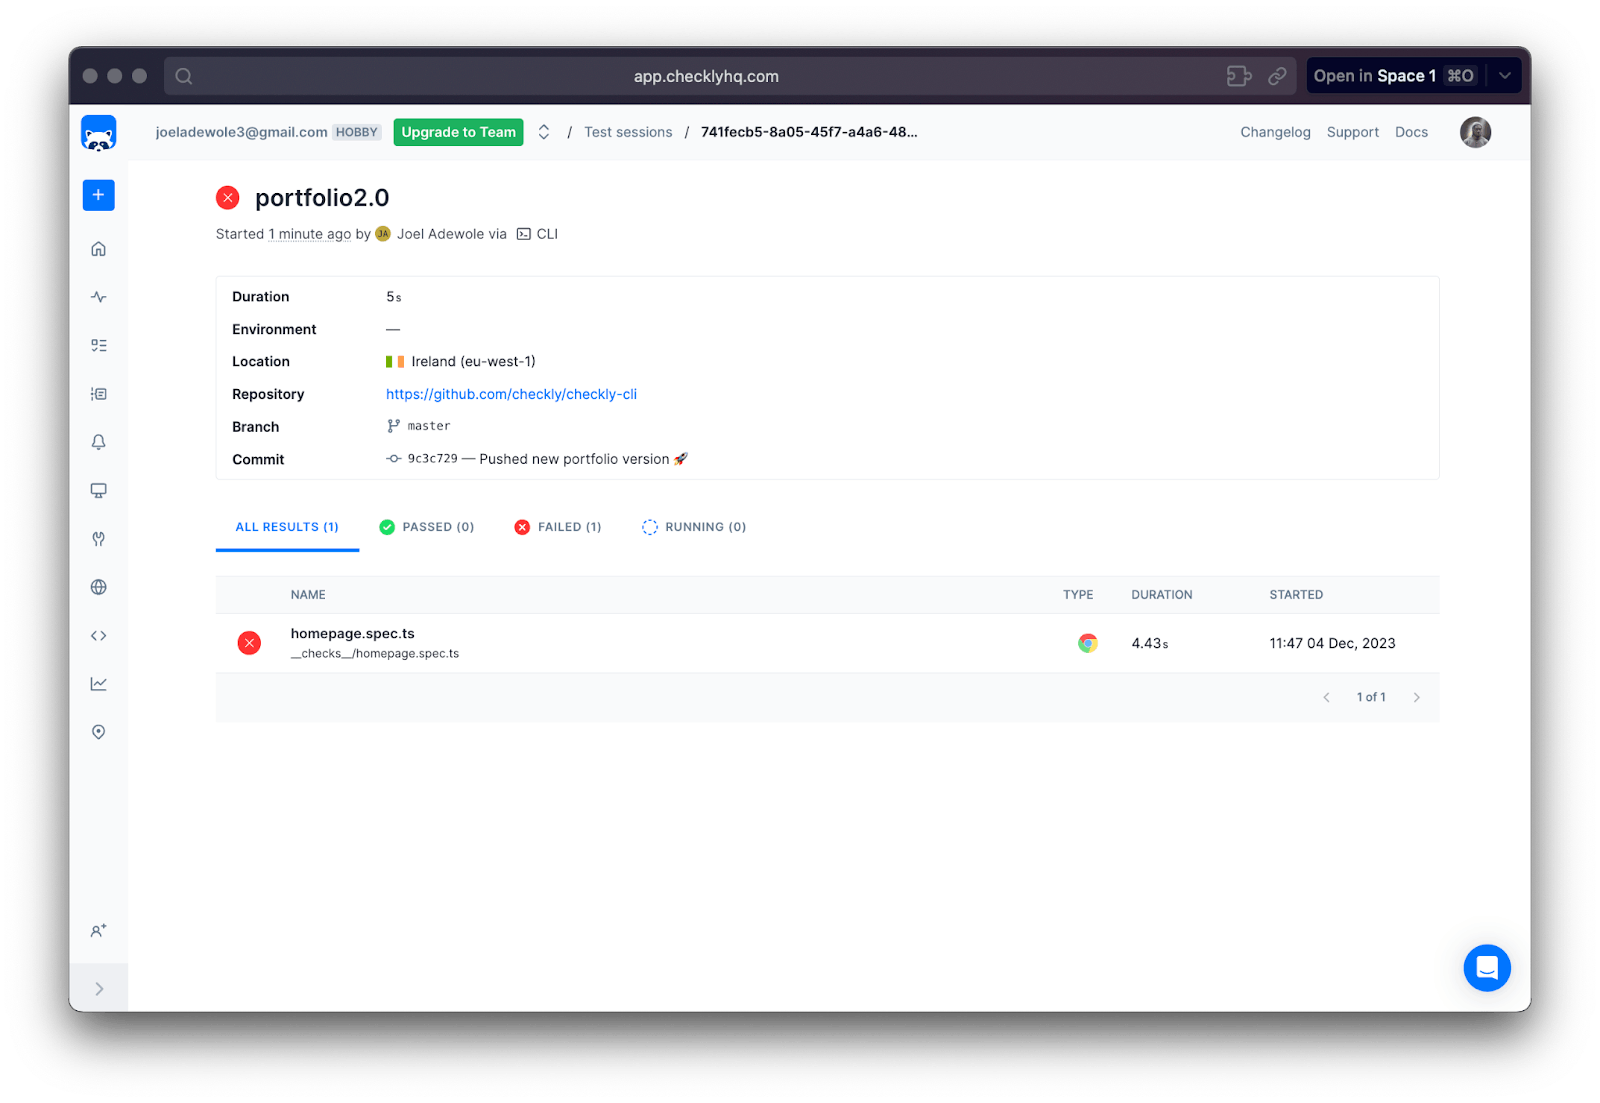
As seen in the result, the test failed because if you browse the URL (https://www.checklyhq.com/docs/browser-checks/) the title of the site is “Getting started | Checkly” and not “Introduction to Checkly | Checkly” as expected in the test case.
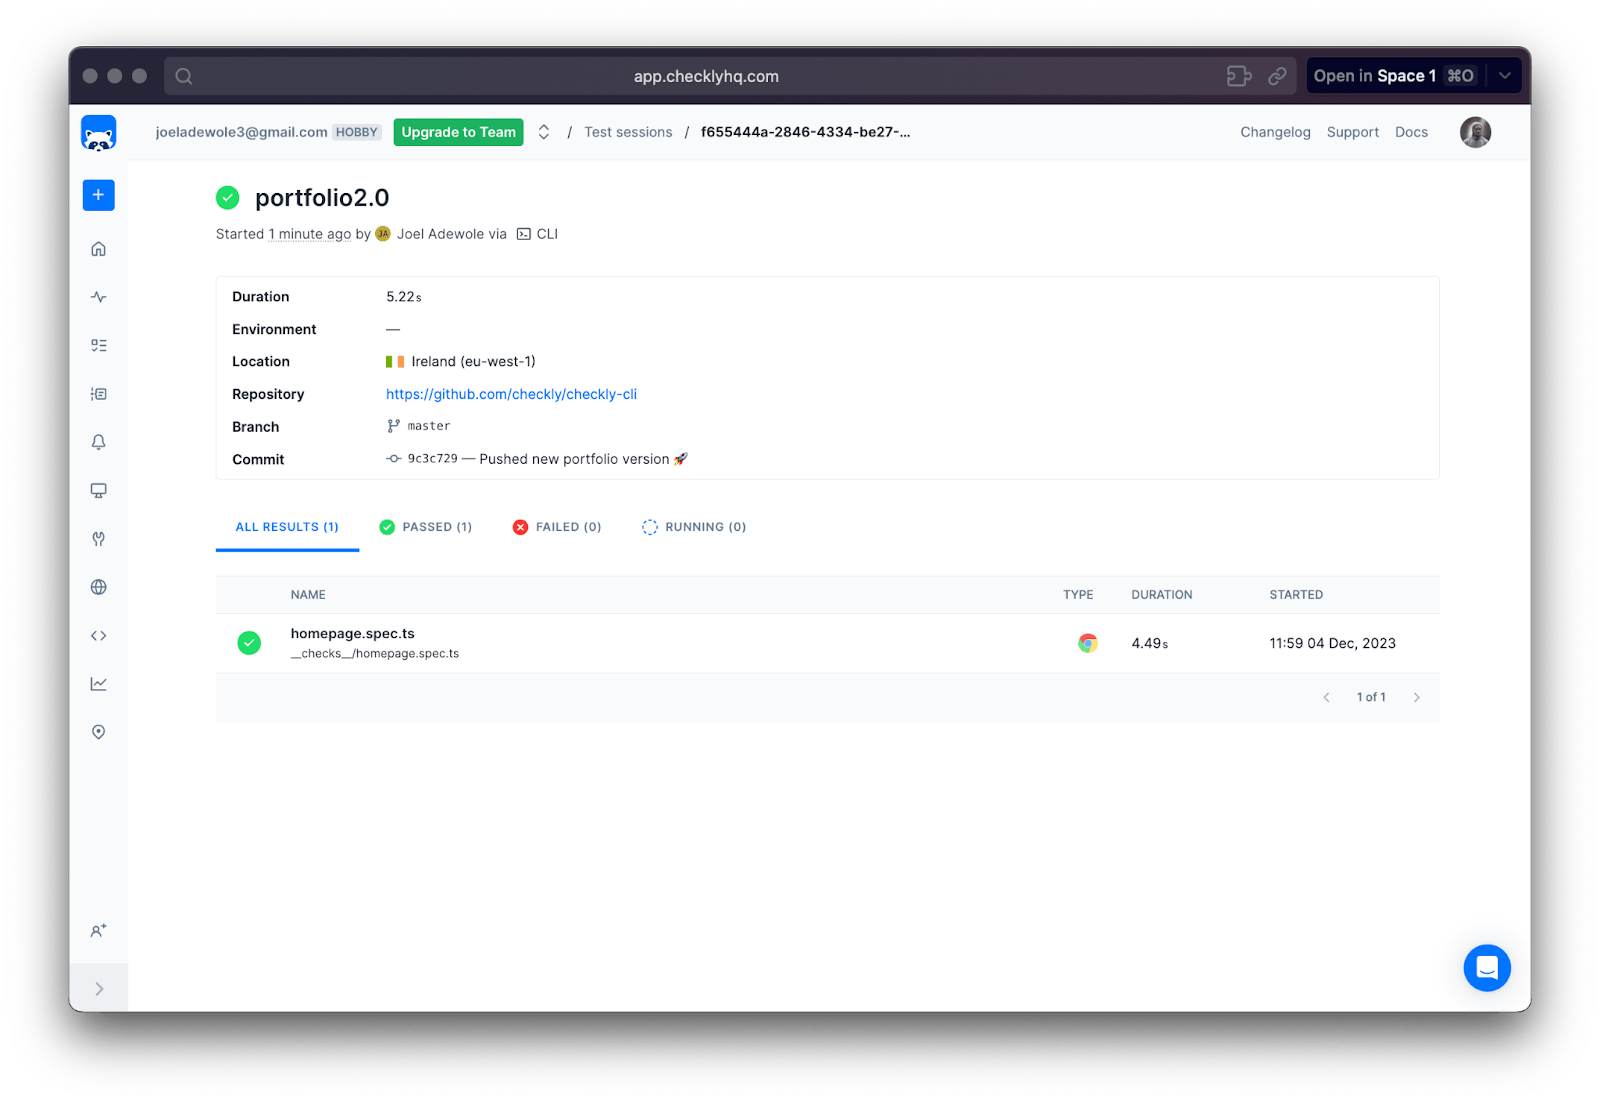
If we update the test case to expect “Getting started | Checkly” we will have a passed test. Here is the result of the test after updating the correct title:

If you check the detailed summary, we should have a passed test too:
Step 5: Deploying Checks
Now that you've reviewed and updated your tests, you can proceed to deploy your MaC workflow and related resources, such as alerts and dashboards. Run the following command in your project terminal to deploy the tests to your Checkly account:
npx checkly deployOnce the deployment is complete, you'll see a success message in your terminal, indicating that the project has been deployed to your Checkly account.
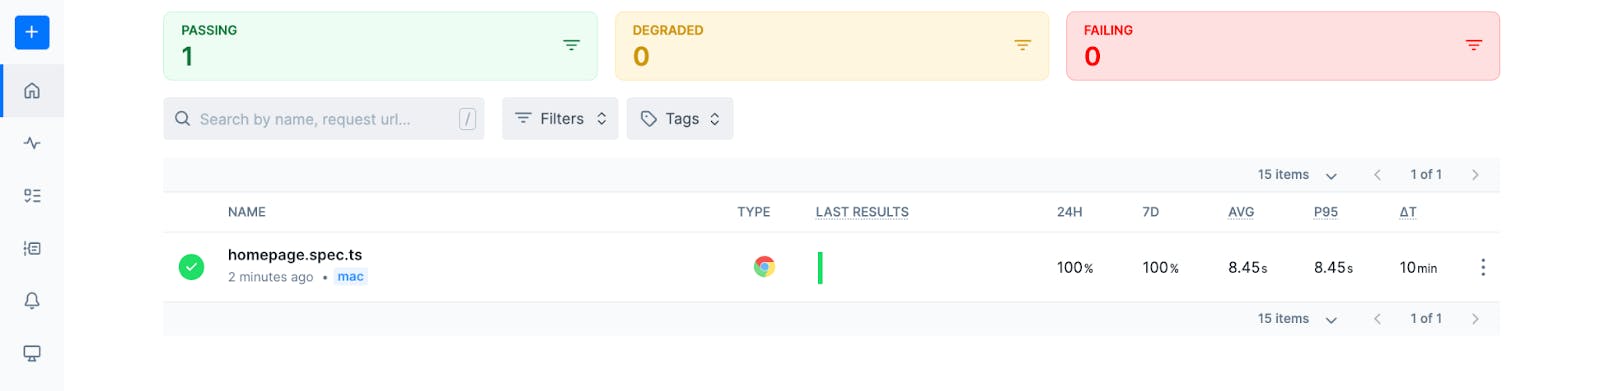
To verify this, navigate to the home section on the left side of the Checkly UI, and you'll find the project with the name of the test script from your local repository.
Step 6: Setting up Alerts
Checkly offers alert services to notify you whenever a check fails. Various alert channels are available, including Slack, SMS, webhook, phone call, email, Opsgenie, PagerDuty, etc.
To set up alerts for your check, go to the specific project, in this case, "homepage.spec.ts." At the top right corner of the code editor, click the "Settings" button. In the revealed side panel, access "Alert Settings" under "Retries & alerting."
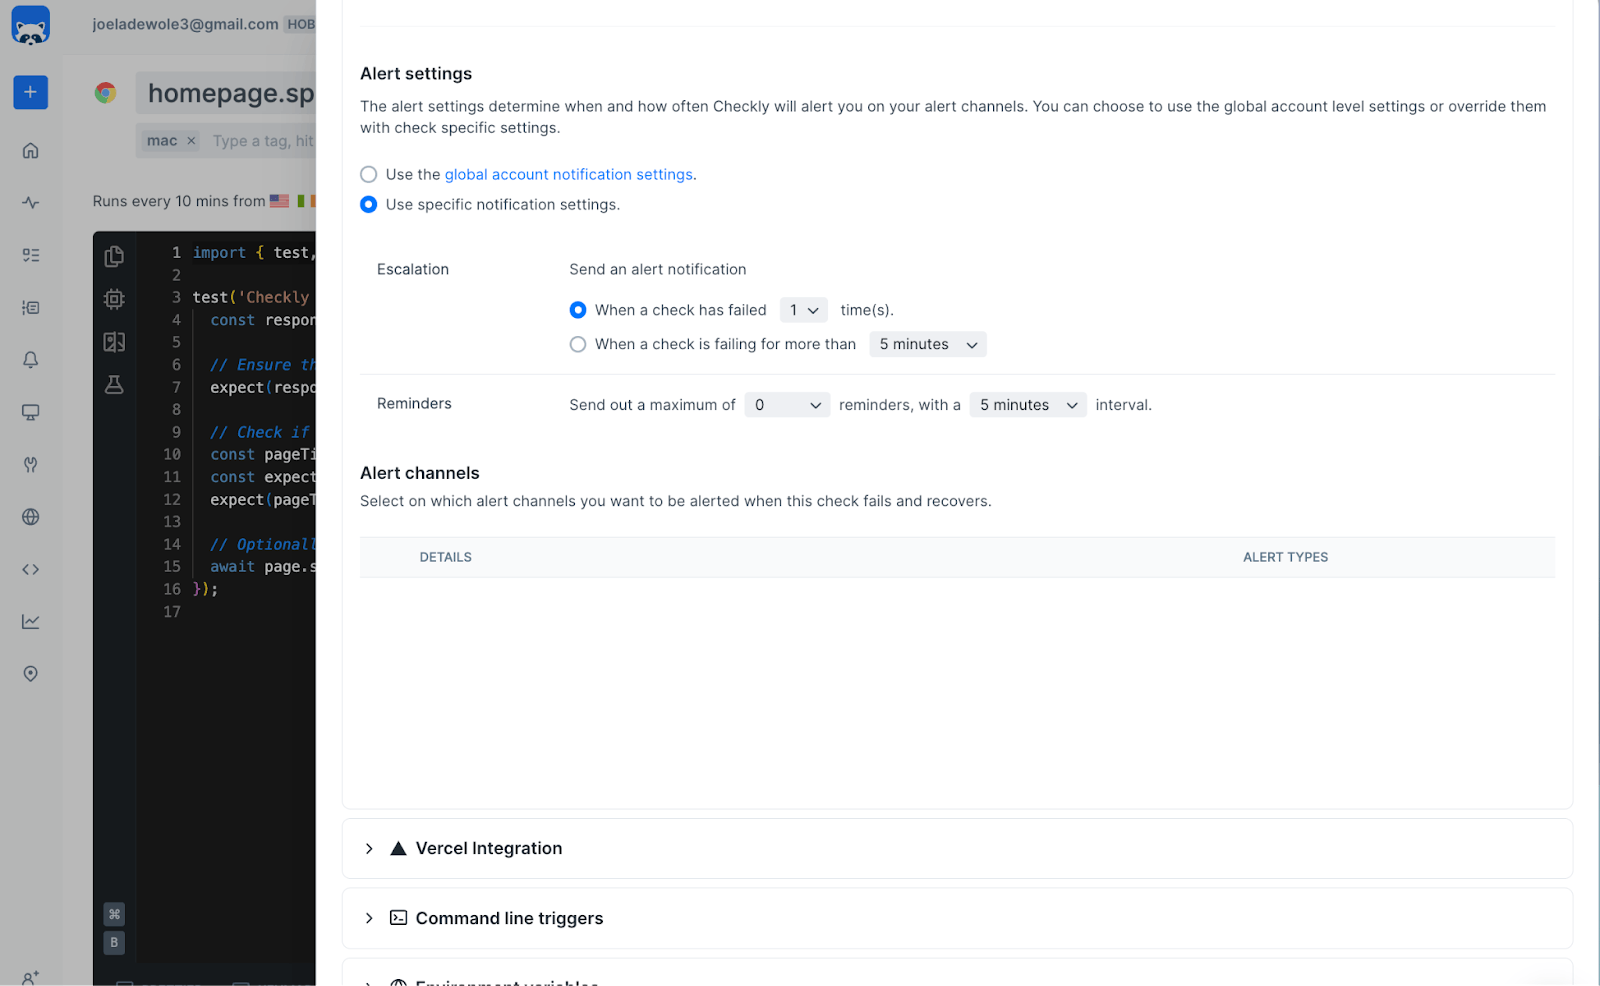
Here, configure monitoring parameters according to your needs, including check frequency, locations, retries and alerting. You can also set up your preferred alert channel using the Checkly CLI. Learn more about the alert channel from the official documentation.
With the appropriate alert channels set up, there is no need for customers to regularly visit the dashboard. Instead, they will be promptly notified, allowing them to react immediately upon receiving alerts.
Conclusion
Browser Synthetic Monitoring emerges as an indispensable solution for optimizing application performance and ensuring user satisfaction. By establishing a collaborative bridge between testing and monitoring, the synergy of synthetic monitoring tools and Monitoring as Code not only provides a safety net for development teams but also acts as a proactive force in anticipating and resolving issues before users are impacted. This approach fosters confidence and significantly enhances software quality and delivery speed.
Leveraging Checkly's Monitoring as Code (MaC) workflow can dramatically improve testing and monitoring efficiency. Checkly's MaC serves as a bridge between development, operations, and QA, offering familiar and effective TypeScript and JavaScript testing methodologies. The platform provides accessible plans for developers seeking comprehensive monitoring solutions, making it available to a wide audience. Checkly, therefore, acts as an appropriate entry point, offering additional capabilities and enhancing project monitoring.