

Table of contents
Update 29-06-2020
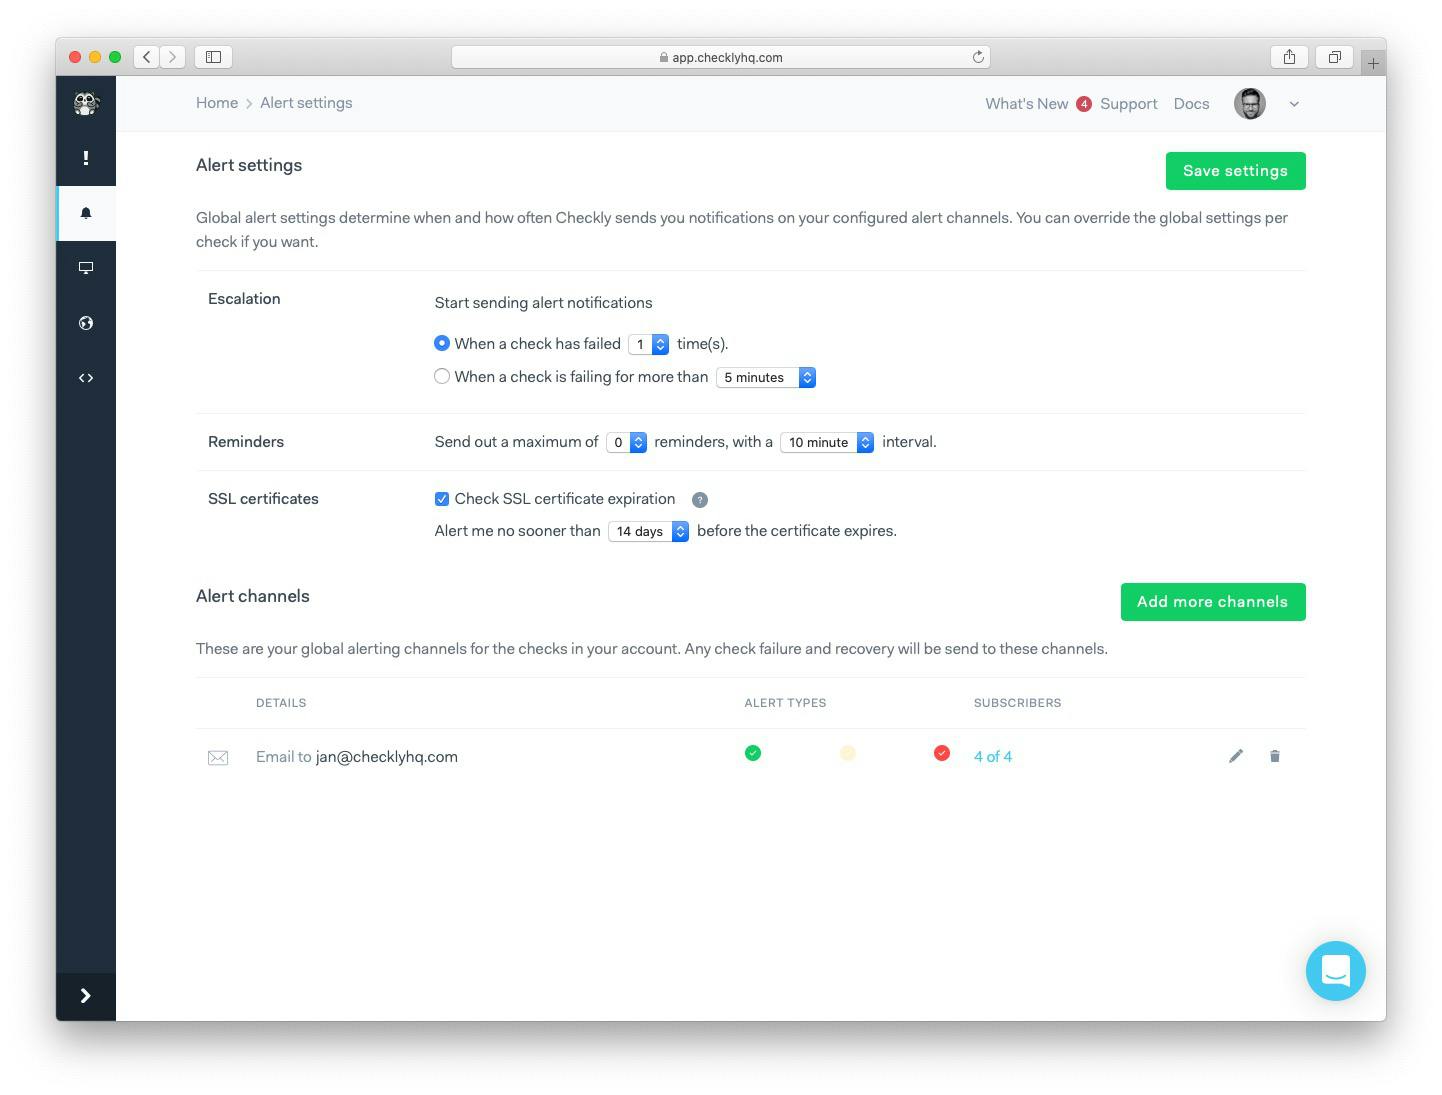
Opsgenie Integration
Last week we released the first version of our OpsGenie integration, making it easier for ourselves and our users to leverage Checkly together with the popular alerting and incident management platform. Here is how it looks like:
Our plan is to put additional work into our integration to enable additional use cases and enrich the Checkly+Opsgenie experience, so stay tuned for more!
If you follow our very own @HLENKE, you might have seen his recent tweet:
We @checklyHQ just had a 6-minute API-outage. That's not good.
— Hannes Lenke (@HLENKE) June 12, 2020
The amazing thing though, is that we found out about this outage b/c from Checkly itself. We do monitor our stack with Checkly. #recursiveMonitoring pic.twitter.com/VklZBVpgEN
Availability and responsiveness are key topics for every SaaS platform. They also happen to be multi-level, complex topics that often span different technology stacks and can be tackled with a variety of approaches. Hannes' tweet actually gives us the perfect segue into a blog post about how our engineering team currently monitors Checkly.
Monitoring Checkly... with Checkly
"Do you dogfood?" If you work in software, especially the B2B segment, you are probably getting asked quite frequently if you use your own product. Do you sell helpdesk software? Would you use the tool you are selling to handle support requests coming for your users?
This loaded question presents us with an important truth: companies that use the software they build are seen as more invested in its development and trusting in its future potential. The opposite is also true, by the way. Somewhere there was a joke about company A using company B's software to build a competing product...
At Checkly, we recognise the importance of using the platform we build ourselves in order to get precious insights into how to improve it. Everybody in our team, no matter how technical, has set up checks on the platform and developed some sort of opinion on the experience.
We place a lot of value in this approach, which extends into how we actually monitor our product. If you have ever navigated to the bottom of www.checklyhq.com, you may have seen a link to our public production dashboard. This shows you Checkly checks running against app.checklyhq.com.
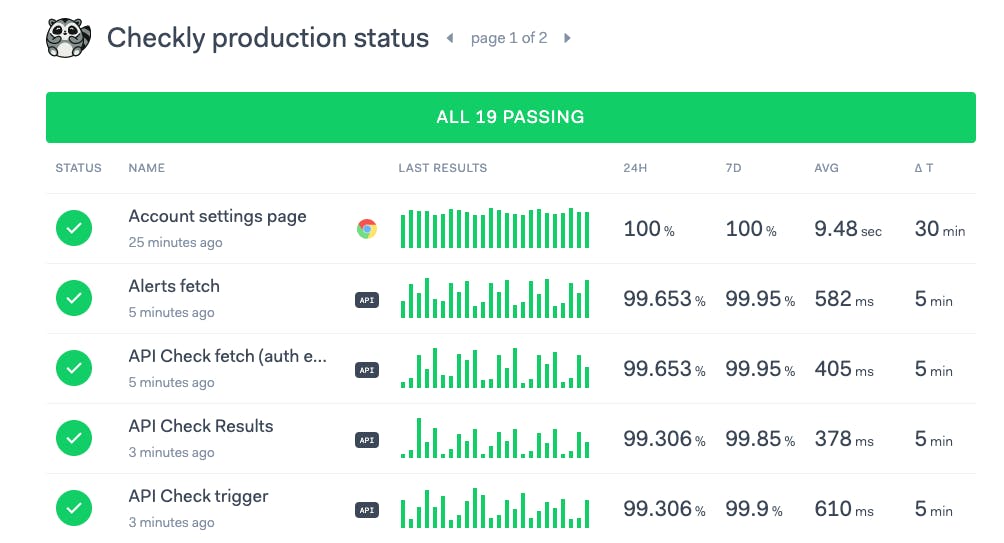
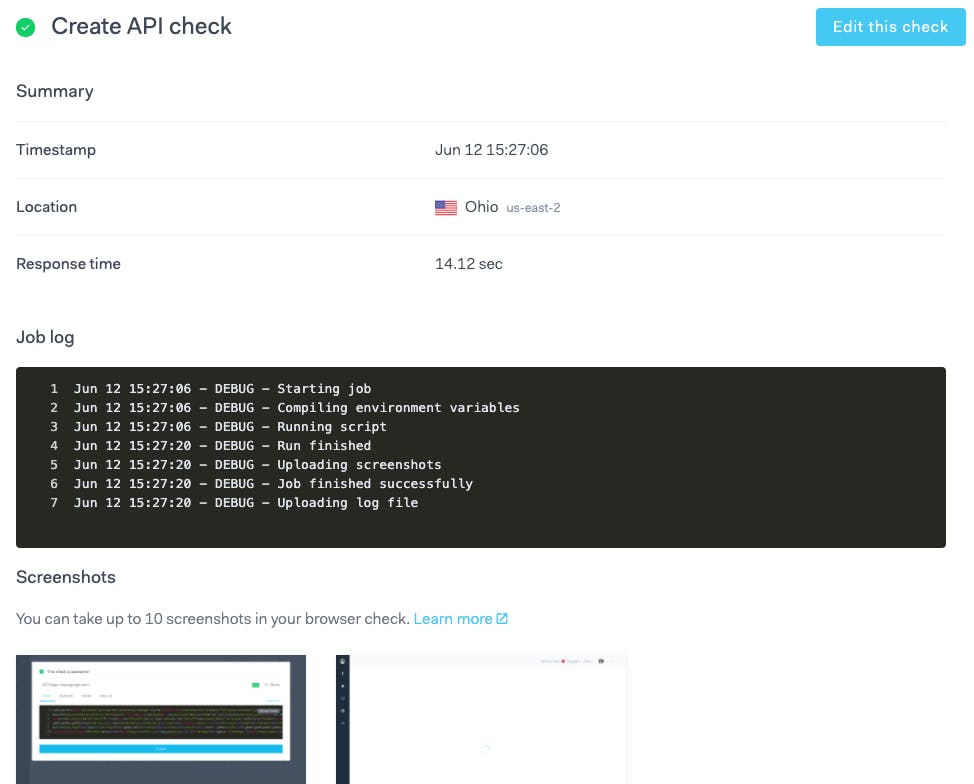
These are a mixture of API and synthetic-browser checks we use to verify the status of key API endpoints and site transactions. Think 'login', 'navigation to settings page', 'create check' etc.
Public dashboards on Checkly show checks belonging to a set of tags. The checks shown here are a subset of the checks running against production. Among the checks you do not see are, for example, the ones for reported security vulnerabilities. There is also a similar set of checks running against our staging environment.
Both the staging and production checks are set to alert our engineers via email, Slack and OpsGenie, depending on check priority. E-Mail and Slack are available as native integrations on Checkly. For OpsGenie, we currently use our webhooks to create and remove alerts. If you have been following our public roadmap, though, you already know we are working on a full-blown integration right now!
Integrating OpsGenie using webhooks
If you don't want to wait you can set up OpsGenie with Checkly today in a few minutes. You will most likely want to automatically create an alert on failure, and automatically close it when the check recovers. For that, you will need to leverage the OpsGenie Alert API.
Here is how our webhook for alert creation could look like:
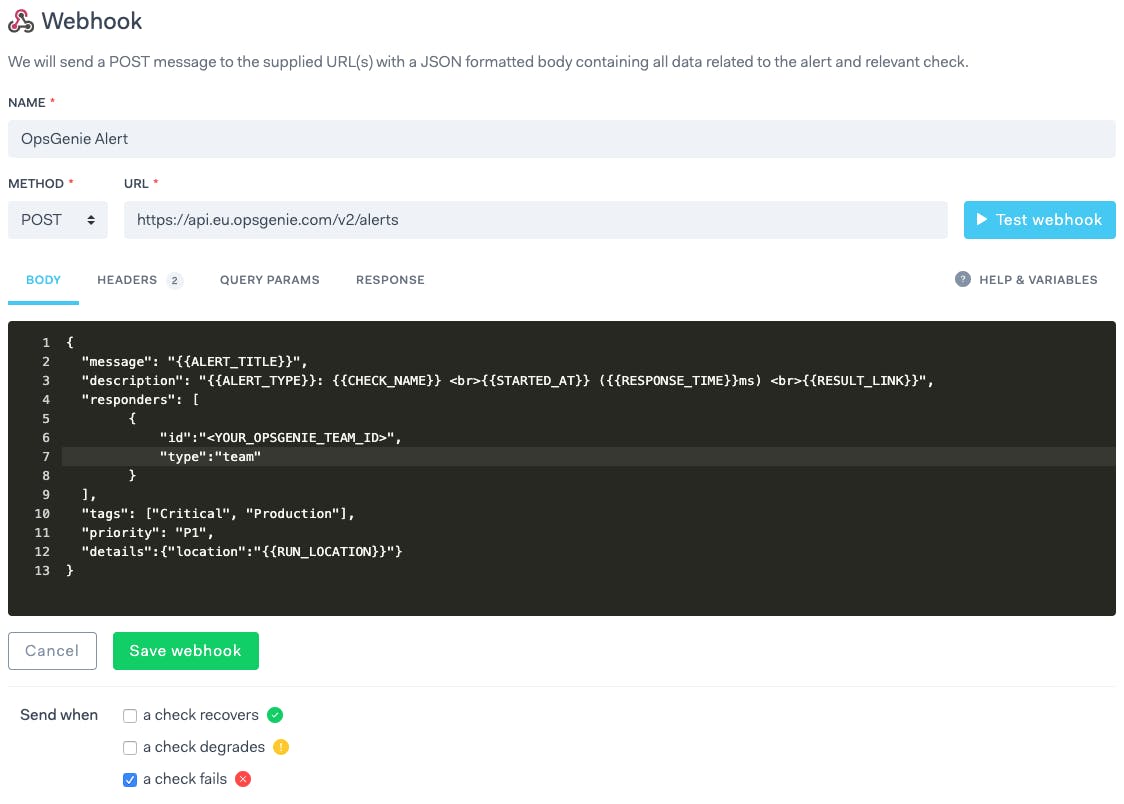
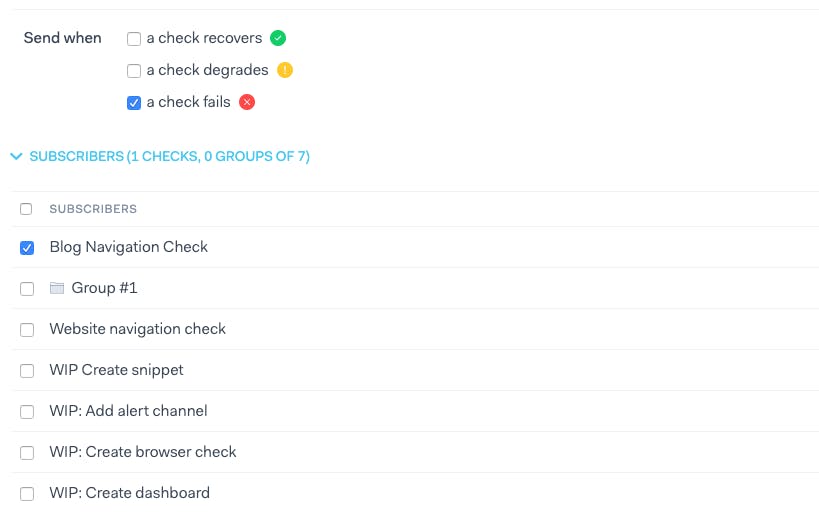
You will also want to switch to the 'Headers' tab and set the Authorization header to GenieKey <YOUR_OPSGENIE_API_KEY>. Note the bottom checklist selection: we only want the alert to be created when the check starts failing. Conversely, the next check will close the alert once the check recovers:
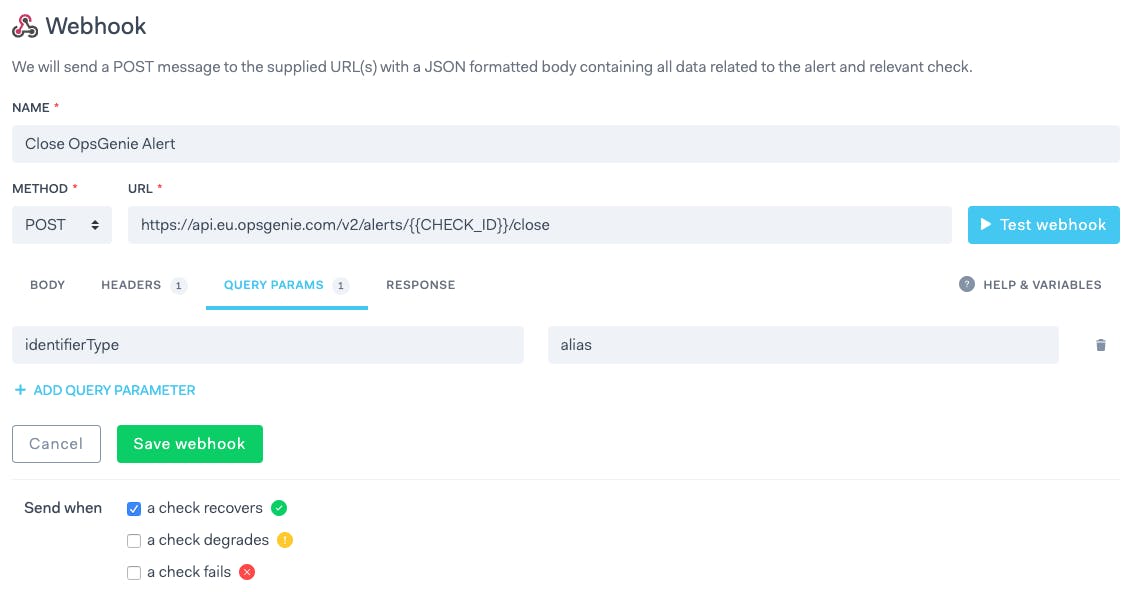
Setting the identifierType query parameter to alias allows us to point to the previous alert we created. Note how the CHECK_ID is specified in the URL.
Reminder: you need to select which checks subscribe to which alert channel among the ones you set up. Make sure your webhooks are turned on for the right checks!
You are all set! Once your check start failing, a new alert will be created on OpsGenie. Once the recovery happens, the alert will be automatically closed.
But what if it stops working?
You have seen how we monitor Checkly using Checkly. But this begs the question: what happens if Checkly goes down? Then no checks would run at all, including the ones targeting production. We cannot afford that, of course. For this reason, we are constantly monitoring the state of some lower-level components our platform heavily depends on.
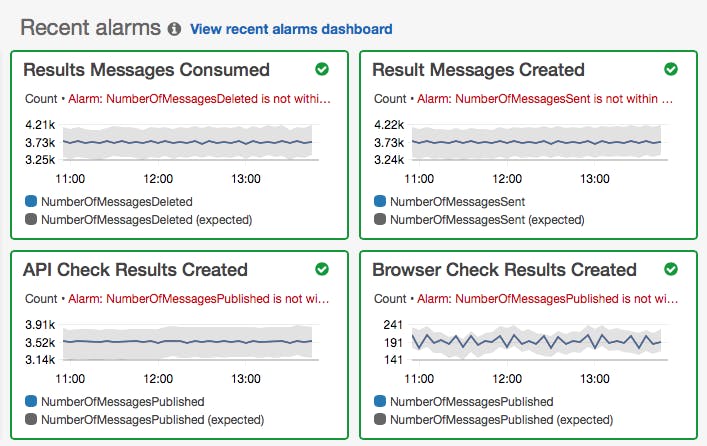
Two of these are our queue and notification services. We are power users of Amazon's Simple Notification Service (SNS) and Simple Queue Service (SQS), which we use to schedule check runs and for storing API and browser check results before they get picked up by our results daemon. Here, the throughput and volume of messages in the queue is a key indicator of how our platform is performing.
Spikes in the number of incoming messages do happen, sometimes due to abuse, sometimes due to misconfiguration. We handle that using Amazon CloudWatch alerts, together with anomaly detection to notify us when key parameters get out of the expected boundaries. Traffic from normal user growth is well within the boundaries and won't trigger any false positives.
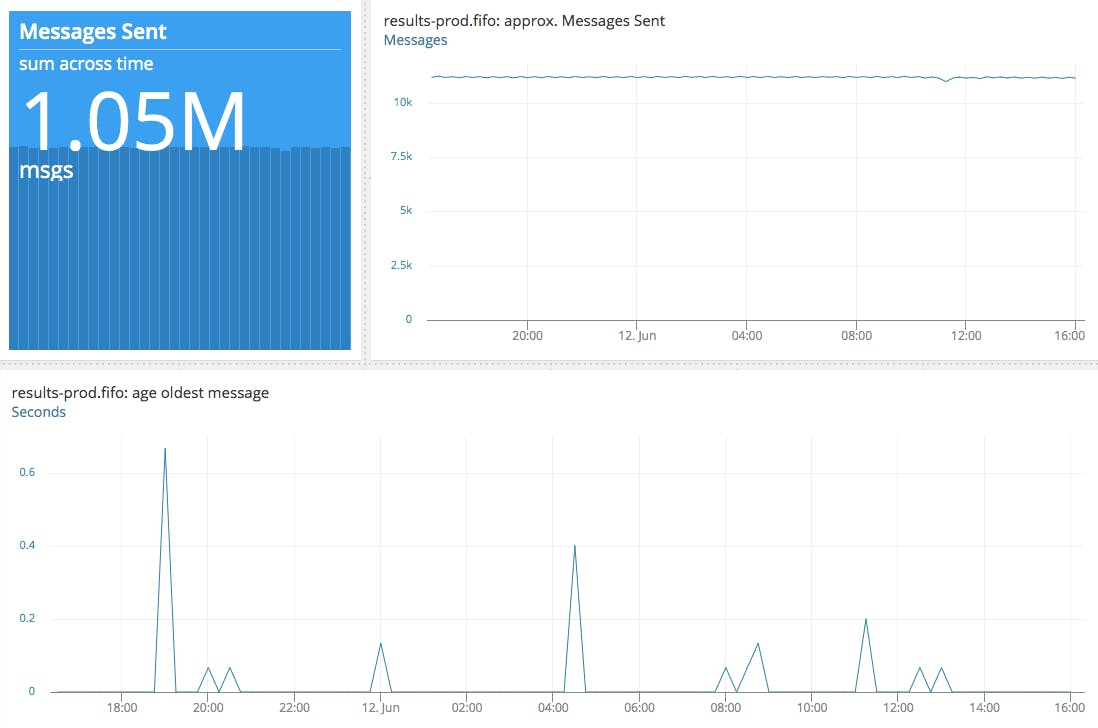
If a check ends up spending more than 60 seconds in our queue, it becomes useless as that is the amount of time that occurs between one check and the next when the user is running at the maximum frequency.
We need to be constantly aware of the state of the average queued message age, and want to keep that as close to zero as possible. Our tool of choice for that has so far been AppOptics.
For the curious: how is Checkly structured under the hood?
Our backend systems are separated into multiple services, that are independently deployed, operated and functionally decoupled. While our architecture is not entirely microservices-based, we are leveraging some patterns promoted by microservices like separation of concerns and services active as fault boundaries.
The result is that, in cases such as the API outage mentioned above, our check runners and alerting systems remain unaffected. Isn't that neat?
Conclusion - Monitoring with Checkly
This post gave you some insight into how we do monitoring at Checkly, including:
- how we use our own monitoring capabilities to check APIs and key user flows
- how we work with alerting to stay on top of issues
- how we monitor lower-level components our service relies on
We hope we have satisfied your curiosity! If you have any more questions, you can ask us anytime at @ChecklyHQ.
banner image: "Lake Suwa in Shinano Province". Katsushika Hokusai, 1930, Japan. Source