
Table of contents
Teams today rely on several different practices in the software world to achieve high-quality, performant applications and services. From automated testing to observability, teams today are investing in automated approaches that help them ship faster while reducing the overall risk of regressions being introduced in their applications.
One of the most effective ways to help teams ship faster and continuously check for quality is to adopt synthetic monitoring. Synthetic monitoring is an approach to monitoring websites and applications that simulates the actions of real users via automation. It mirrors the actions that a visitor may take on your website, say browsing an online shop, adding items to a shopping cart, and then checking out. Monitoring these flows allows us to quickly identify errors in production and measures the performance of complex applications over time.
To help power these end-to-end monitors and achieve true continuous quality, we can use Playwright and combine them with the Checkly programmable monitoring platform.
Playwright for Synthetic Monitoring
Backed by Microsoft, Playwright is an open-source, cross-platform automation framework most commonly used for end-to-end web application testing. It was designed to be fast, reliable, and robust, and its API supports modern rendering engines that include Chromium, Firefox, and WebKit. Playwright:
- can run on Windows, Linux, or MacOS
- can be executed headlessly or in a browser
- supports languages such as TypeScript, JavaScript, Python, .NET, and Java
- has a built in assertion library
- Related: Playwright Explained
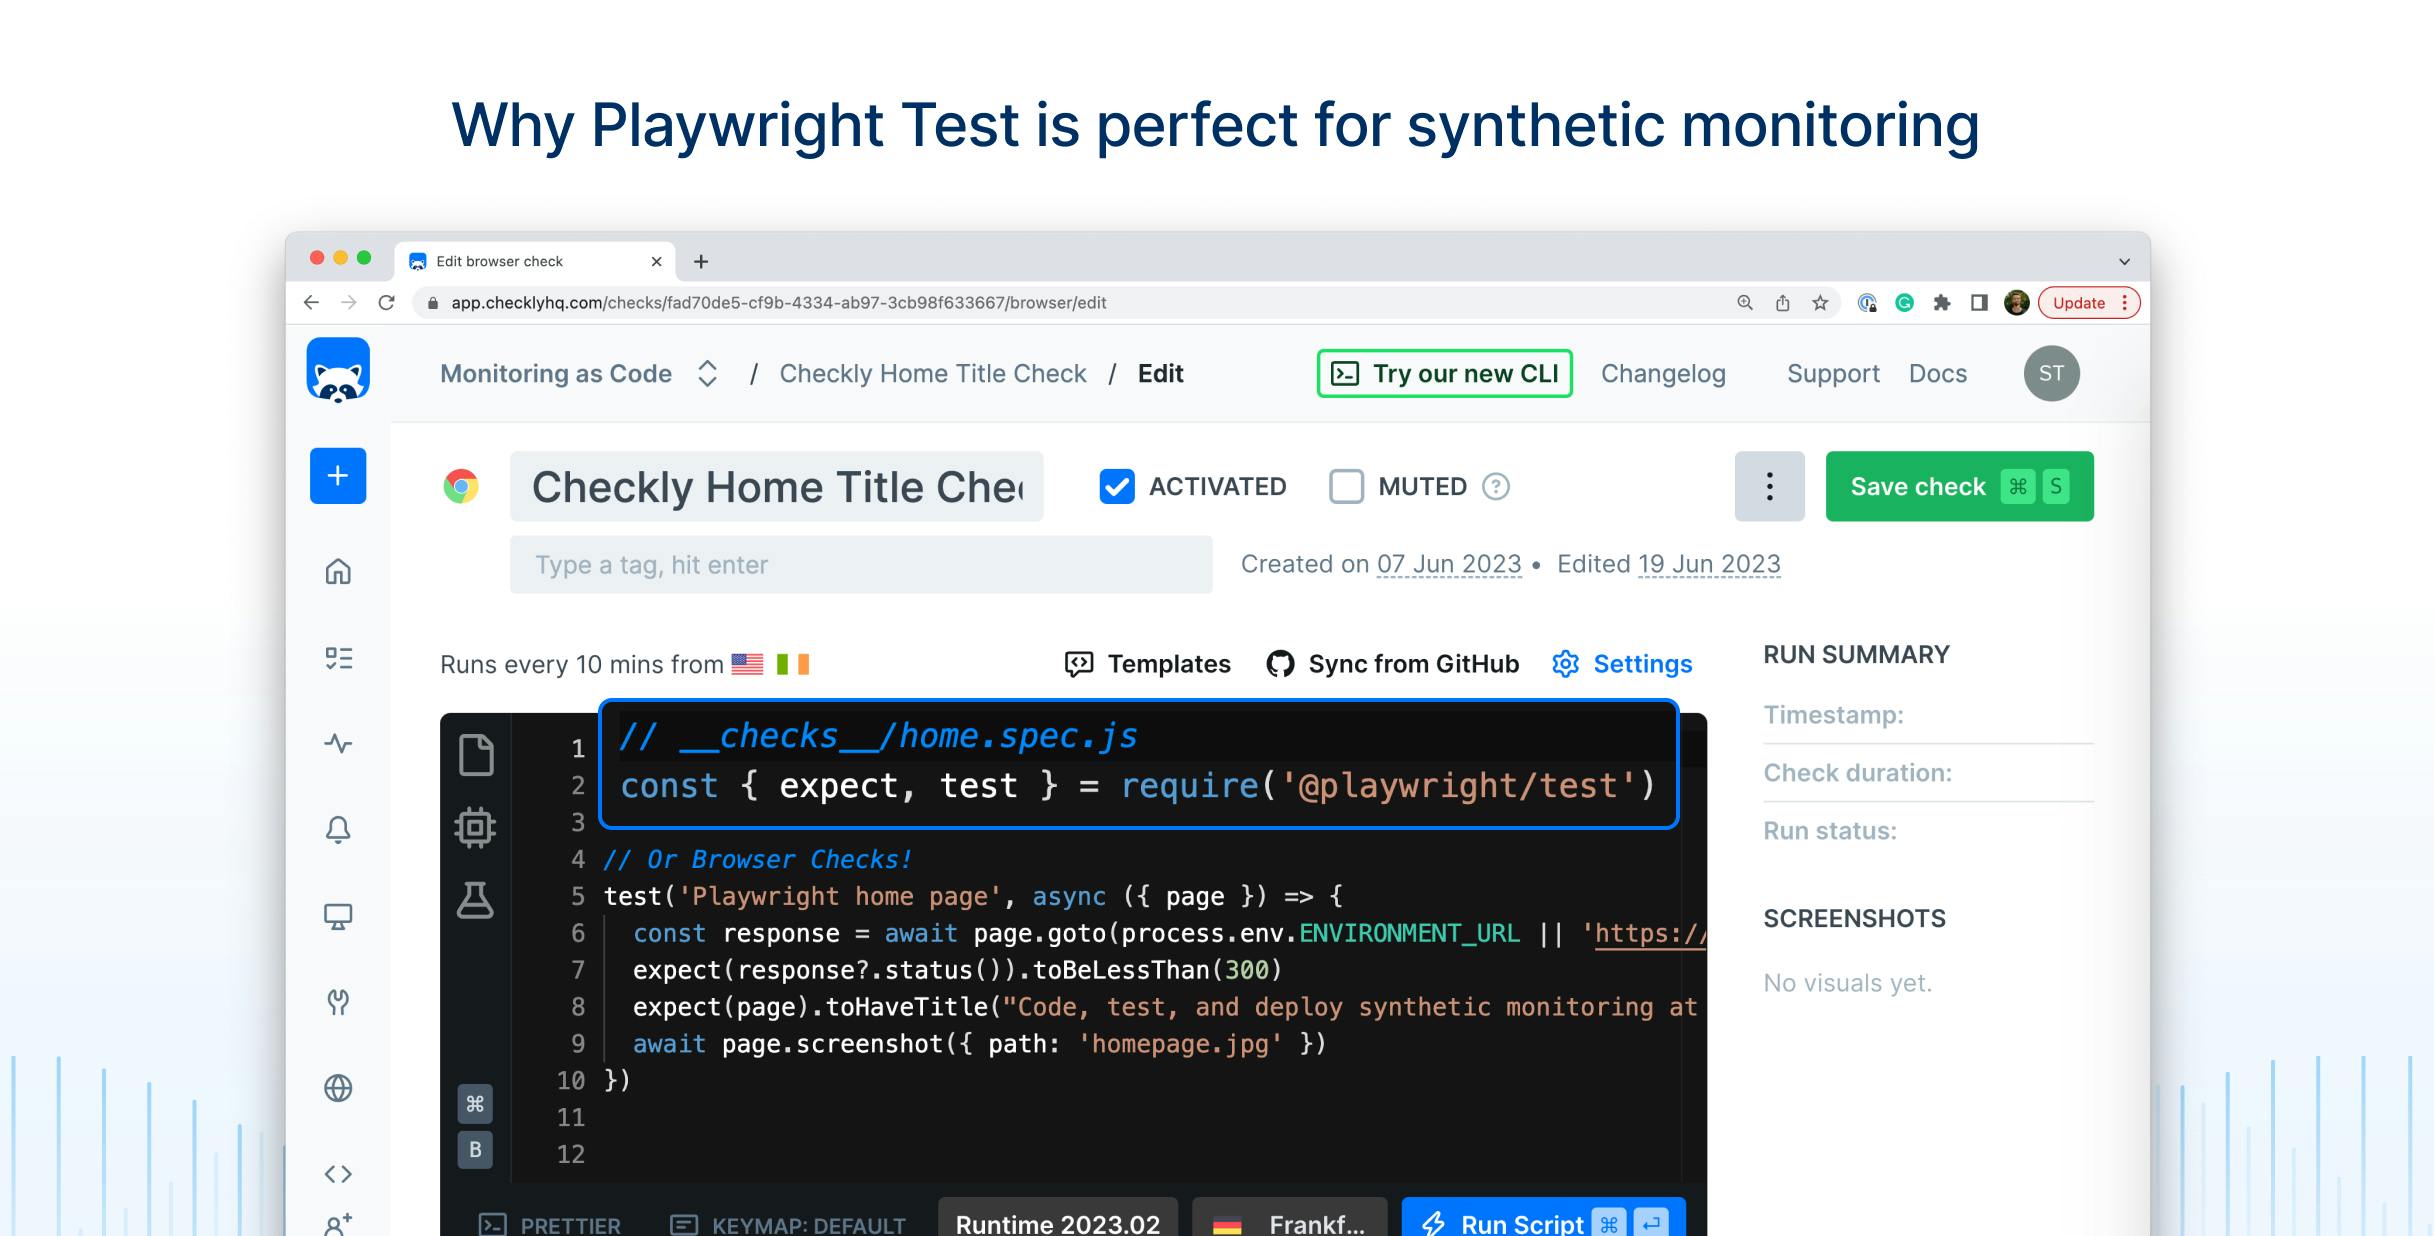
// example of a Playwright Test spec file
const { expect, test } = require('@playwright/test')

test('Playwright home page', async ({ page }) => {
  const response = await page.goto(process.env.ENVIRONMENT_URL || 'https://checklyhq.com/')
  expect(response?.status()).toBeLessThan(300)
  expect(page).toHaveTitle('Code, test, and deploy synthetic monitoring at scale.')
  await page.screenshot({ path: 'homepage.jpg' })
})
This makes automating with Playwright the best choice for engineers working in fast-paced environments. It also makes it a perfect choice when thinking about running continuous, end-to-end monitors against production.
Why use Playwright for Synthetic Monitoring?
So why should you combine Playwright and synthetic monitoring?
For starters, running end-to-end tests during CI/CD isn't enough. Applications today are complex, and rely on services that are often outside of our control. Running your testing suite while in production at high-frequency intervals can help you catch bugs that directly affect users.
Secondly, combining the two provides a delightful developer experience. Writing end-to-end monitoring code with Playwright looks very similar to application code, and you can readily use languages you already know and love, like JavaScript and TypeScript.
Playwright also offers a useful high-level API, as well as powerful locators aiming to be as close to the end-user experience as possible rather than relying on test ids.
// Use Playwright’s user-first locators to interact with your application
await page.getByLabel('User Name').fill('John');
await page.getByLabel('Password').fill('secret-password');
await page.getByRole('button', { name: 'Sign in' }).click();
await expect(page.getByText('Welcome, John!')).toBeVisible();
Playwright end-to-end tests are also resilient, thanks to auto-waiting and web-first assertions with automatic retries. Drop all these waitFor statements and let Playwright figure out when a UI element reaches its desired state.
This helps reduce flakiness and provide a reliable automation experience.
// wait for the element with the text “Welcome” to be visible or time out
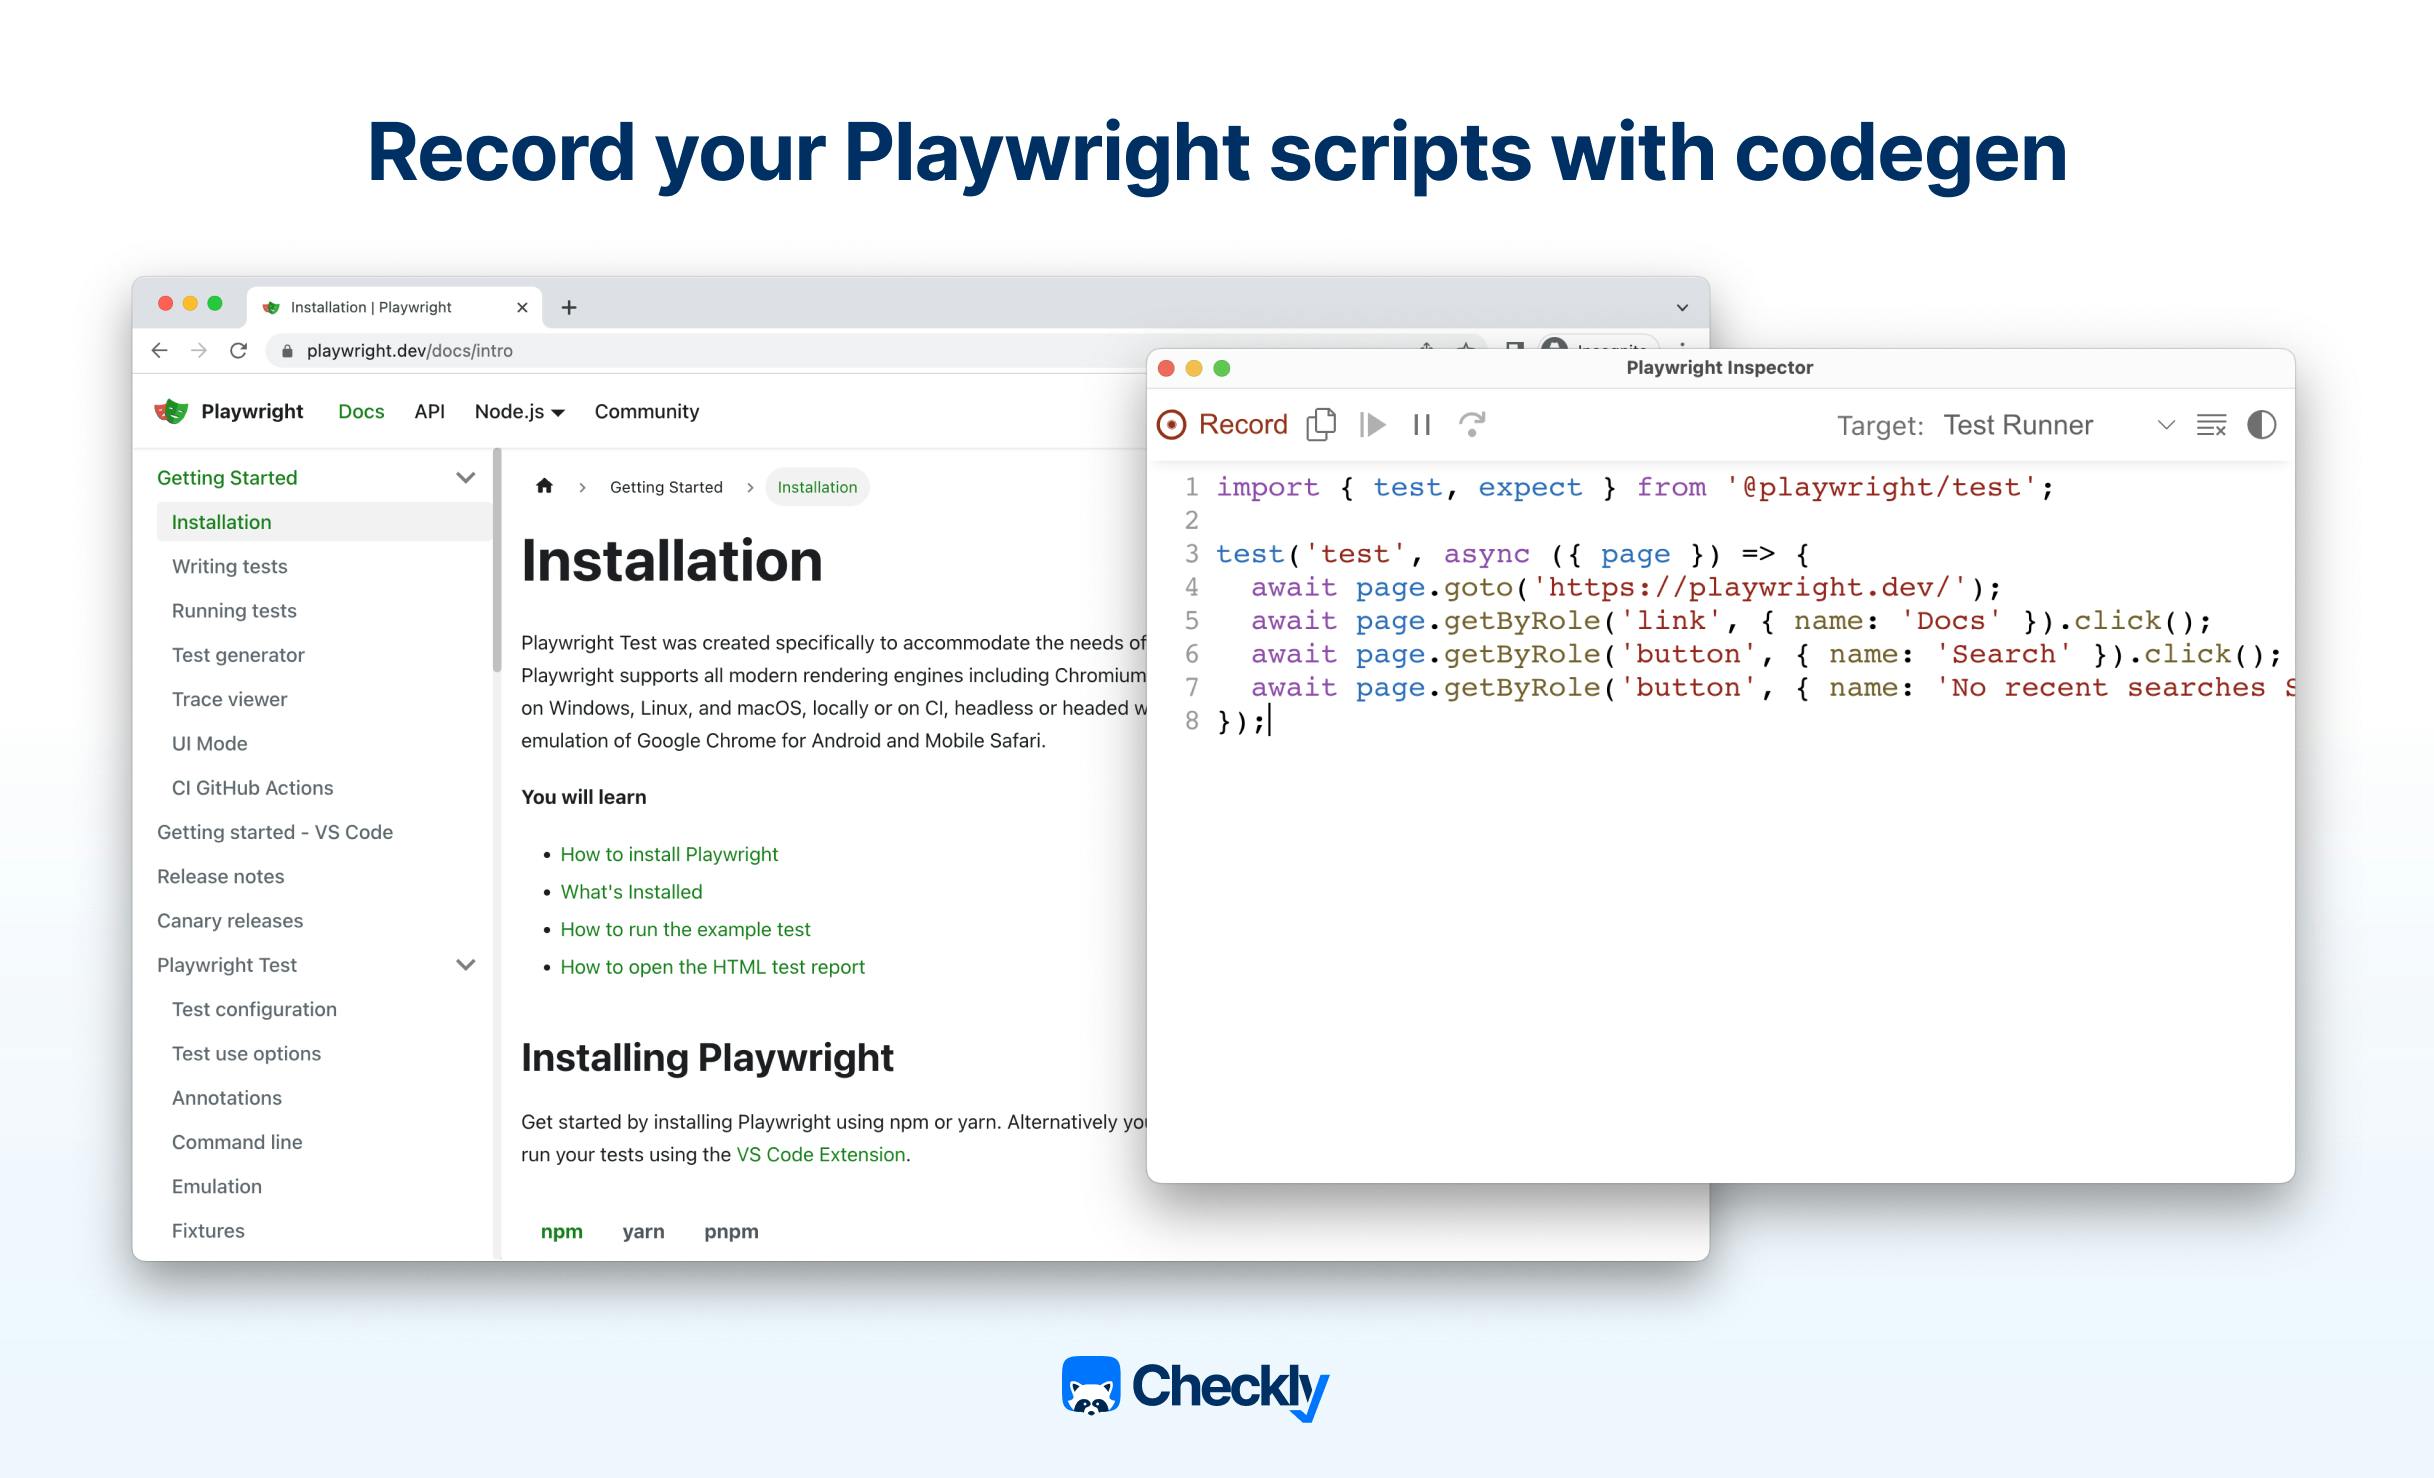
await expect(page.getByText('Welcome')).toBeVisible();Playwright even offers a code-generation tool—Playwright Codegen—that generates test code from your onscreen demo test activity, like going through the steps of adding an item to an online shopping cart and then checking out.
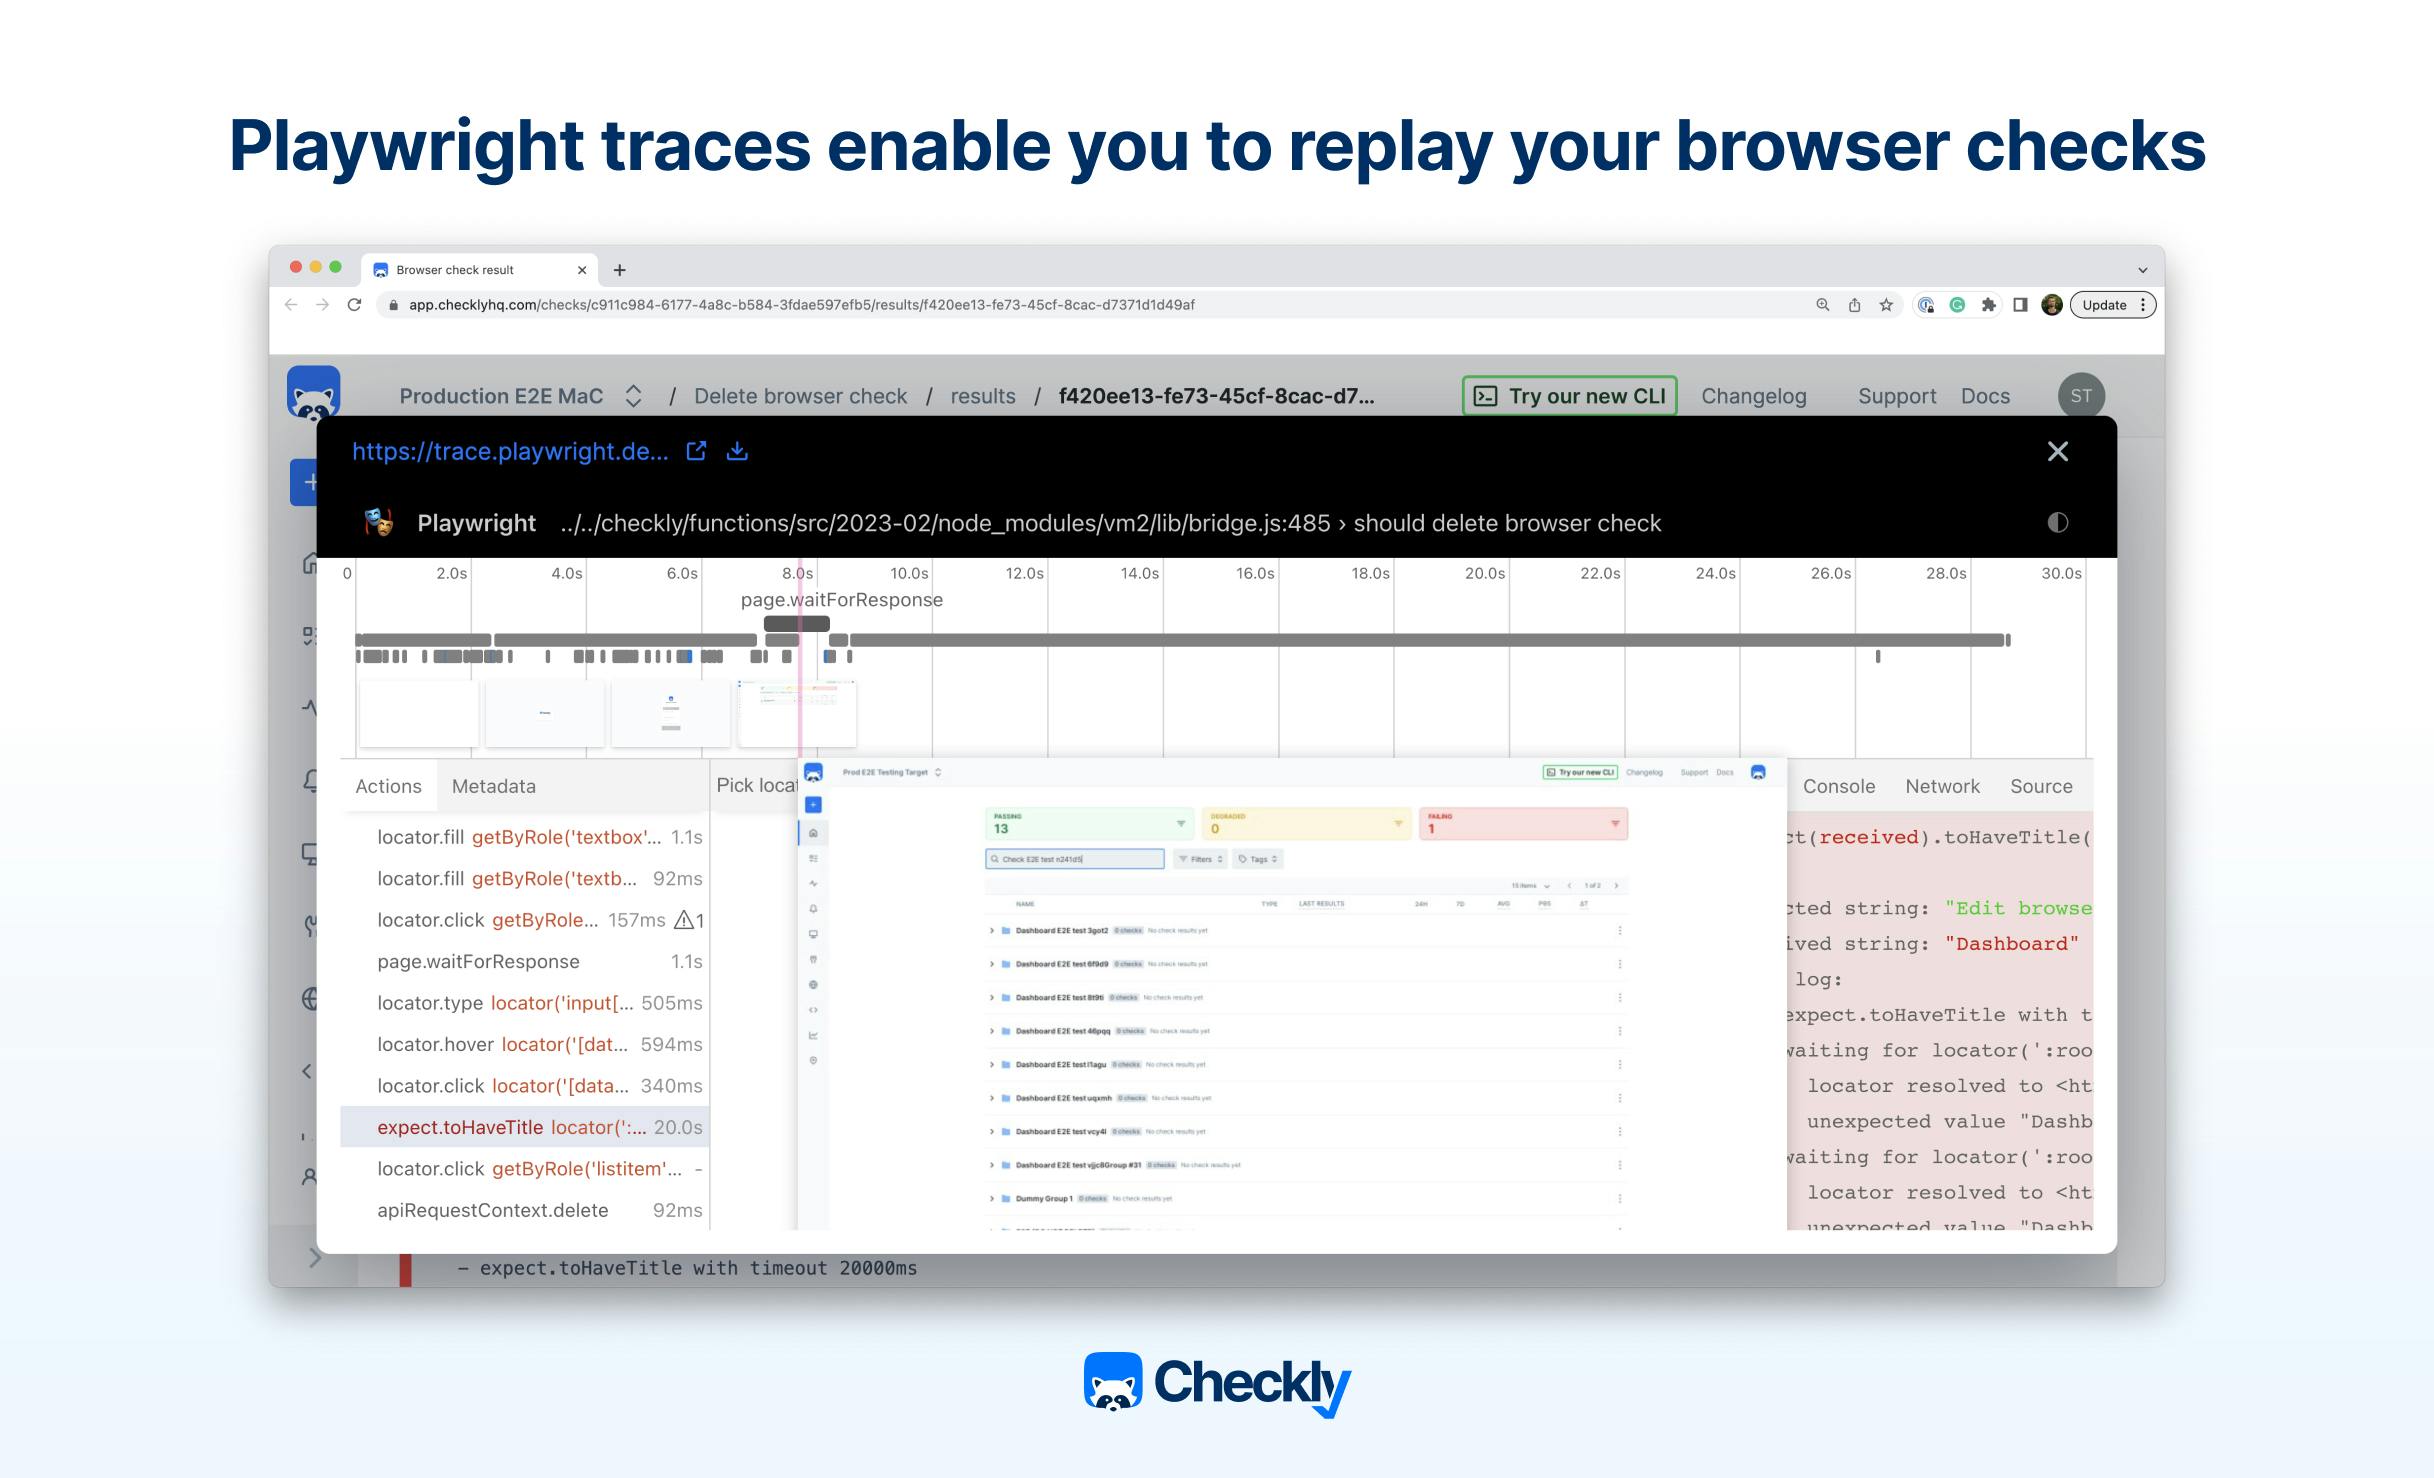
And Playwright’s last selling point is the advanced debugging capabilities, including the creation of videos and traces that help you visually track down how and why checks fail. Traces are like “time travel debugging” including screenshot snapshots of failed checks, and network request logs, and they help you find performance bottlenecks and reasons for test failures.
After evaluating carefully, we decided that PWT is the perfect tool for Checkly’s browser checks and synthetic monitoring and helps thousands of Checkly users detect application issues early and often.
Best practices for using Playwright for Synthetic Monitoring
Keep your end-to-end tests small and focused
Separate checks can test different parts of your web application; they’re easier to debug and understand. Plus, having smaller checks also reduces the risk of breaking them when introducing changes.
Avoid hard coded selectors
It’s wise to avoid hard-coded DOM or CSS class selectors. Relying on a CSS class will most likely break with CSS updates, and higher-level locators such page.getByPlaceholder() as are a better option to mimic user experience.
You also should avoid arbitrary timeouts to wait for elements and rely on PWT’s auto-awaiting and retries.
// Playwright click when this button is:
//
// - attached to the DOM
// - visible
// - stable (not animated)
// - receives events (not obscured by another element)
// - enabled
await page.getByRole('button').click();
Use page object models (POMs)
We suggest that you use POMs, as that can reduce duplication, and a single POM can be used in many checks. Taking that approach also helps you maintain more readable, maintainable code, and also provides a high-level API for interfacing with changes.
// playwright-dev-page.js
const { expect } = require('@playwright/test');

exports.PlaywrightDevPage = class PlaywrightDevPage {
  constructor(page) {
    this.page = page;
    this.getStartedLink = page.locator('a', { hasText: 'Get started' });
    this.gettingStartedHeader = page.locator('h1', { hasText: 'Installation' });
  }

  async goto() {
    await this.page.goto('https://playwright.dev');
  }

  async getStarted() {
    await this.getStartedLink.first().click();
    await expect(this.gettingStartedHeader).toBeVisible();
  }
}


// example.spec.js
const { test } = require("@playwright/test");
const { PlaywrightDevPage } = require("./playwright-dev-page");

test("getting started should contain table of contents", async ({ page }) => {
  const playwrightDev = new PlaywrightDevPage(page);
  await playwrightDev.goto();
  await playwrightDev.getStarted();
});
Keep your monitors next to your code
It’s a good idea to keep your check code in the same repository as your application code and leverage the monitoring as code workflow. This allows you to deploy your application and its monitoring at the same time.
Summary
We believe that making Playwright—and PWT—vital parts of your synthetic monitoring efforts is the best option for developers.
Playwright provides a great developers experience with high-level APIs and a coding approach that provides familiar, well-known patterns for TypeScript and JavaScript. Maintainable tests can be written and debugged easily, making your testing and monitoring efforts much more efficient.
And finally, using Playwright and PWT with the Checkly monitoring as code (MaC) workflow and Checkly CLI allows your monitoring code to live right next to your application code, which helps blur the lines between development, operations, and QA.