Monitor every complex workflow like your business depends on it
Uptime monitoring tells you a server responded. Synthetic monitoring tells you the login button worked, checkout completed, and the API returned the right data. Replicate real user flows across browser and API, continuously, from 22+ global locations.

Trusted to monitor checkout, login, and critical APIs at scale








Go Beyond Simple Uptime
Uptime monitoring tells you a server responded. Synthetic monitoring tells you the login button worked, checkout completed, and the API returned the right data. That gap is where users get stuck.
Monitor UIs or APIs End-to-End
Playwright-powered Browser Checks and API Checks run side by side. Monitor the UI flow and the API it depends on with a single deployment. No separate tools, no duplicated configuration.
Catch and Debug Issues in Seconds
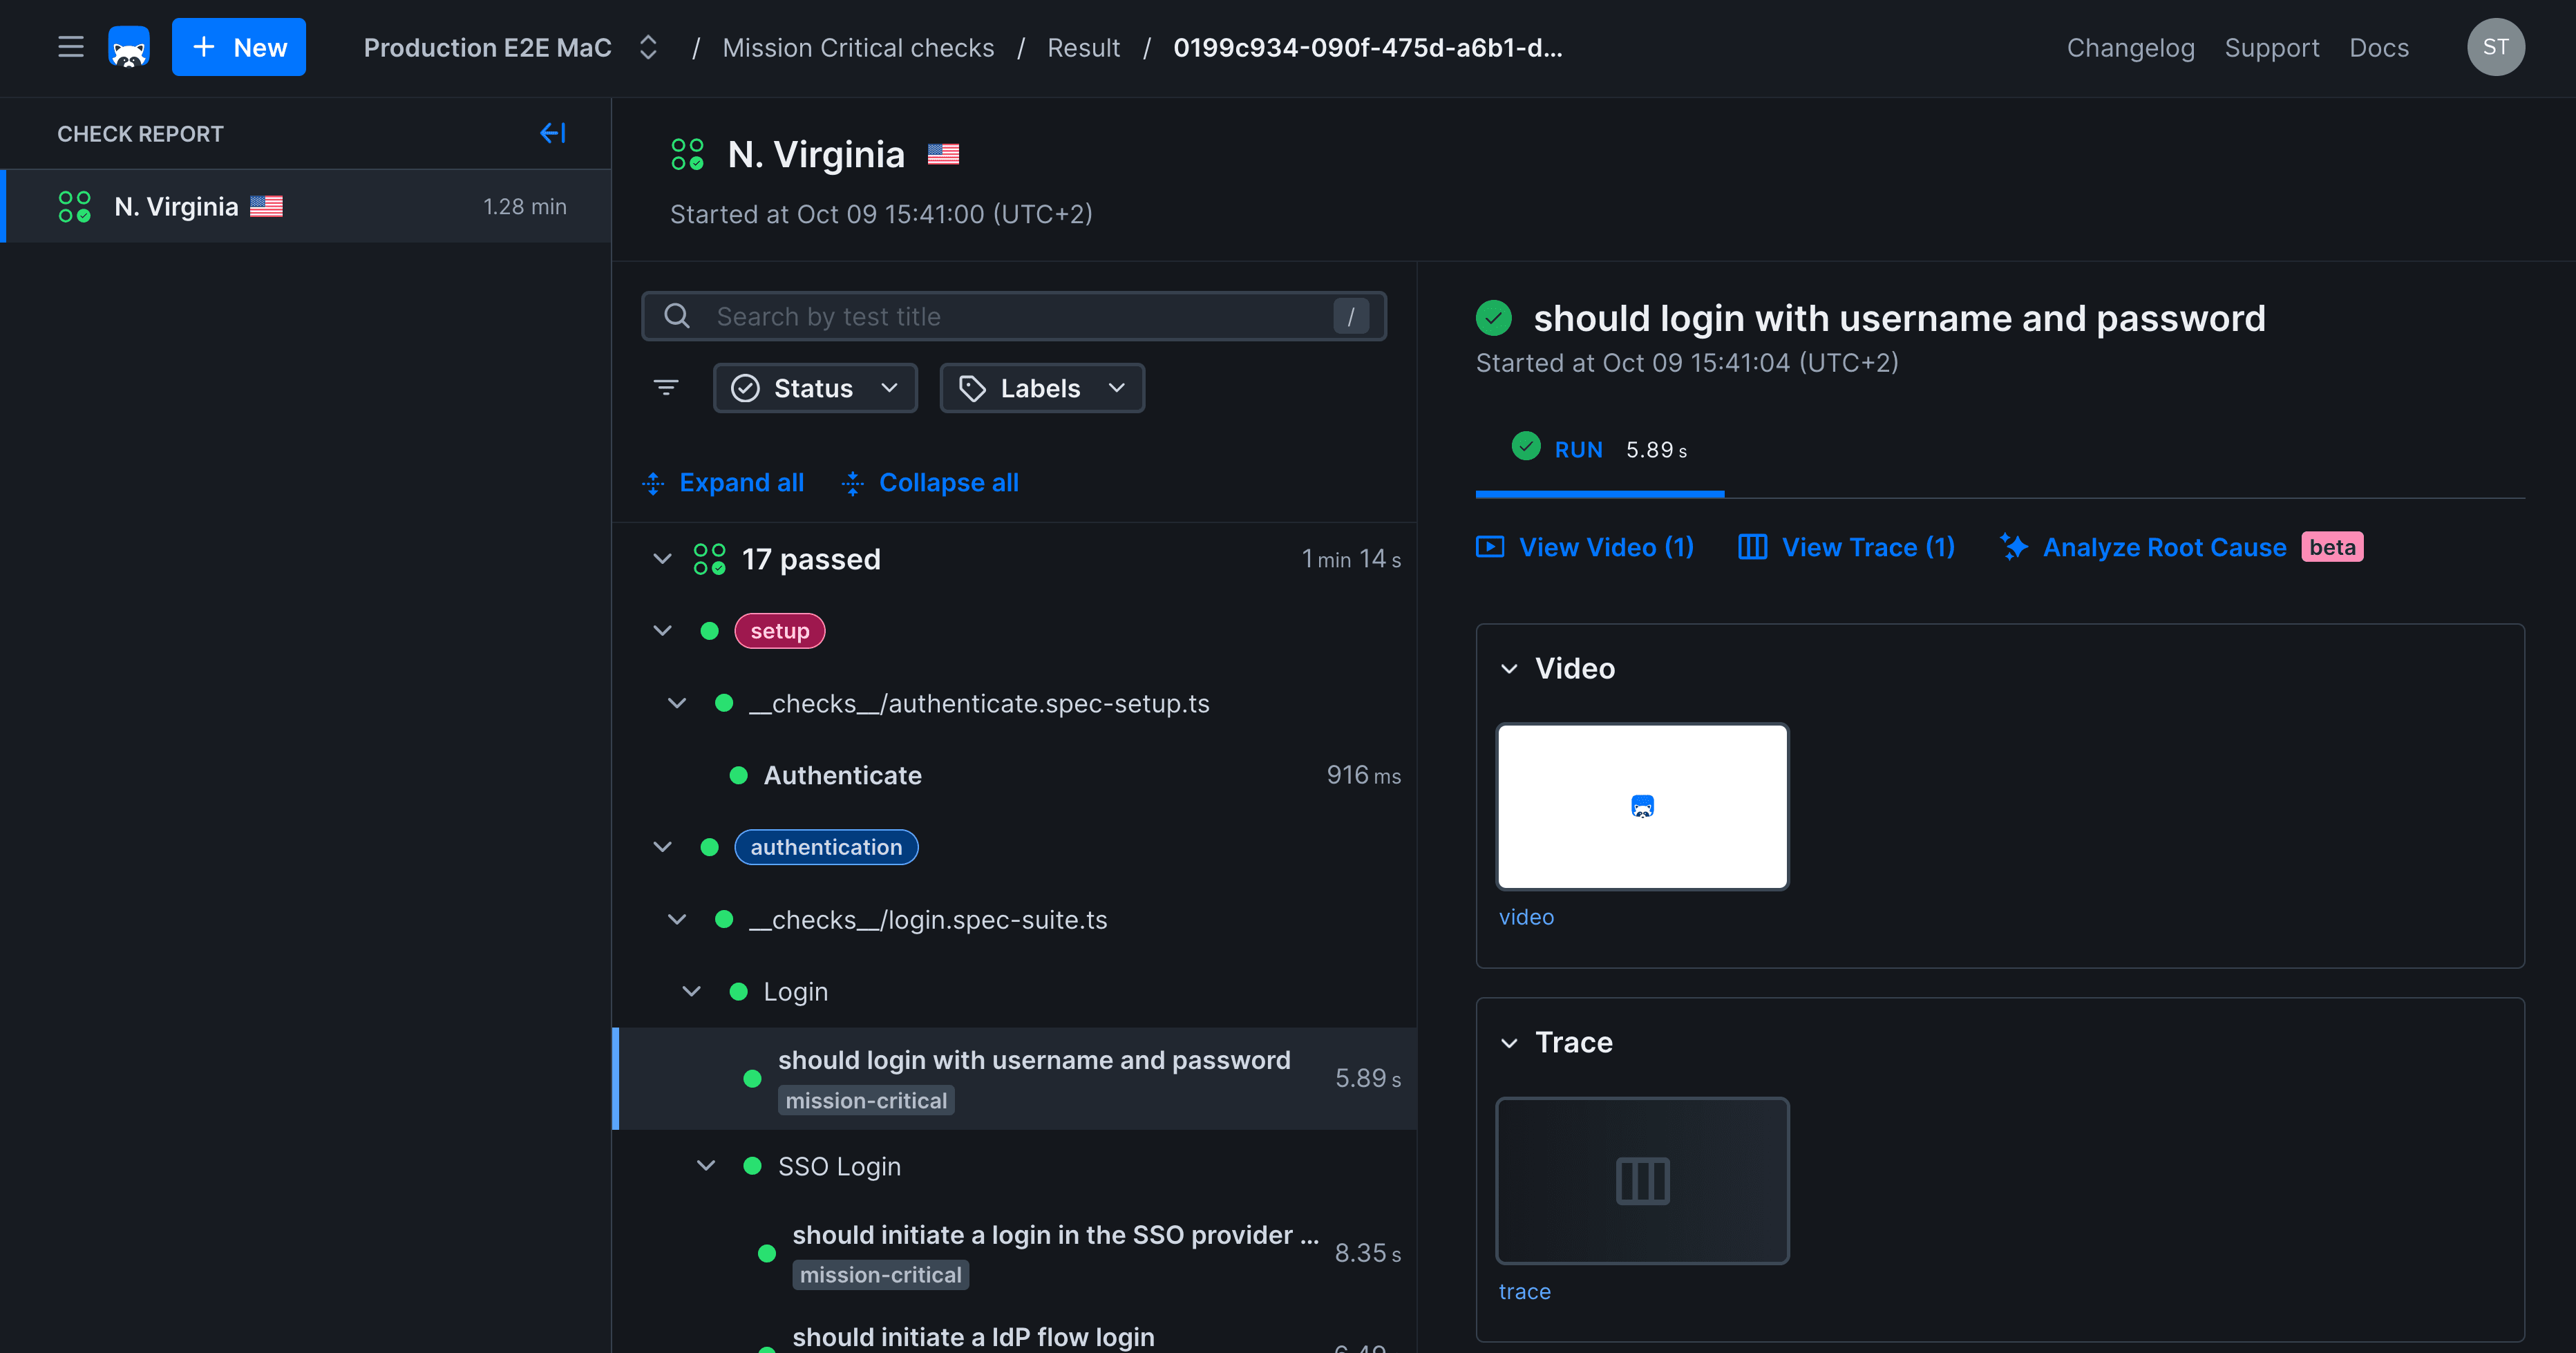
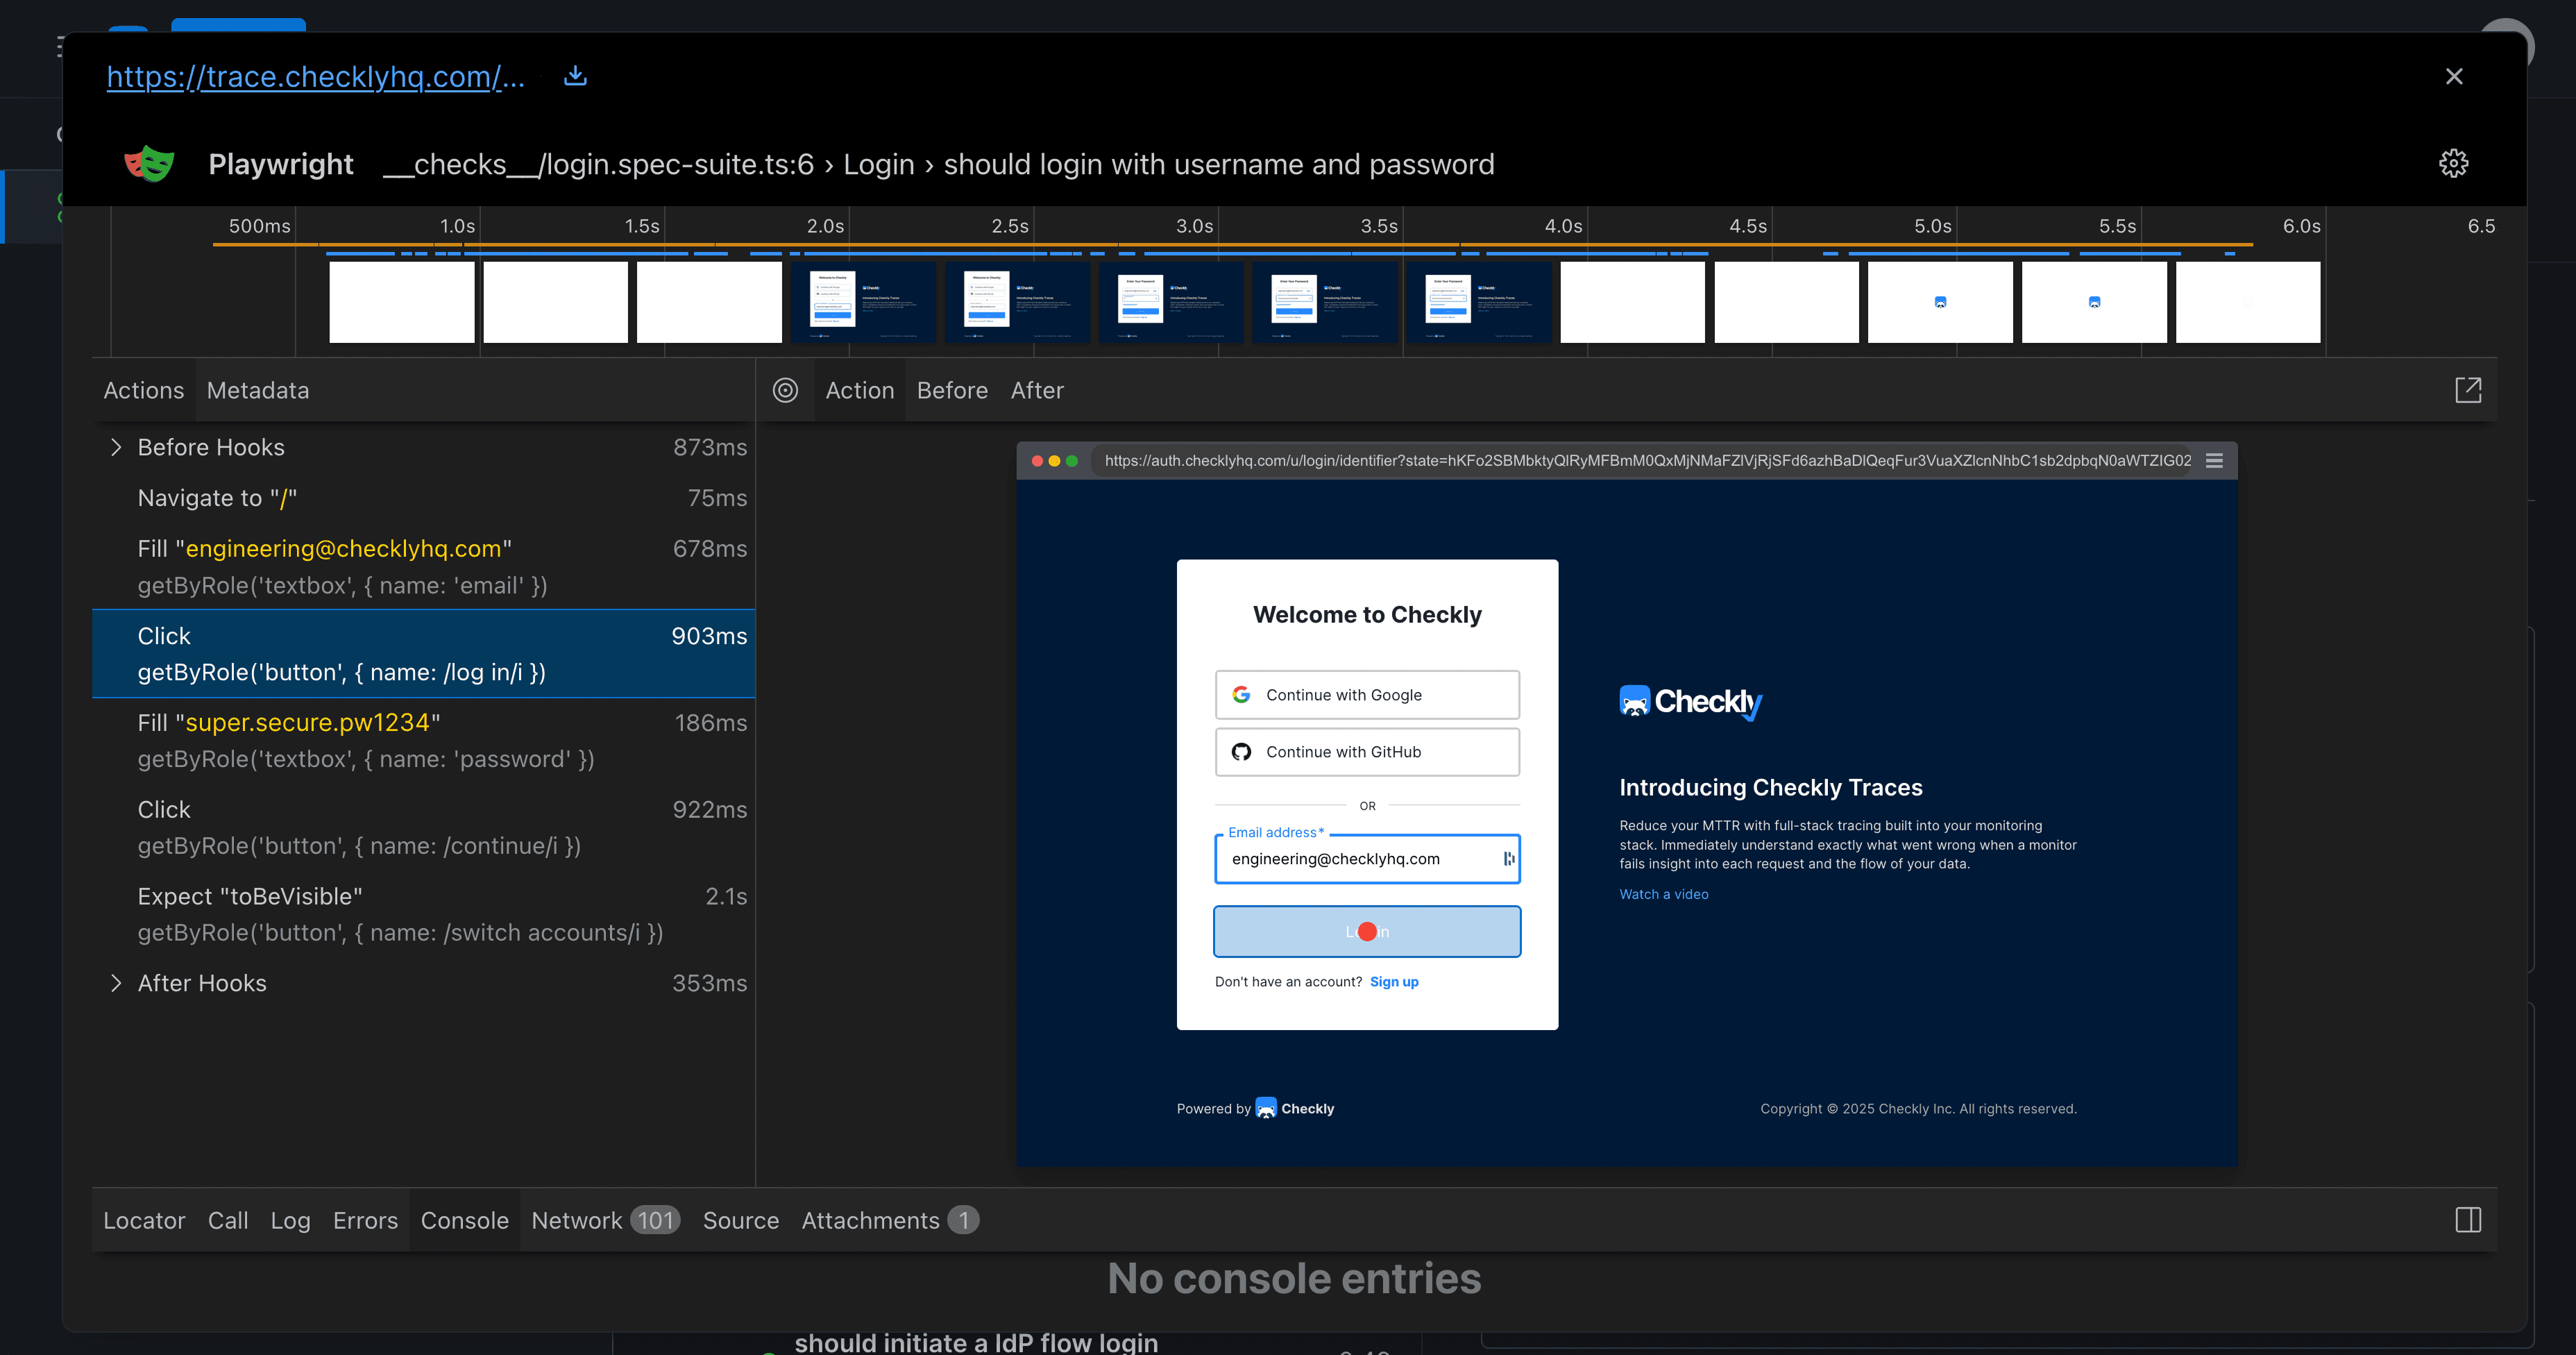
Run checks as often as every minute from 22+ global locations. Get a full screenshot, video replay, trace, and AI root cause analysis the moment something breaks, before a customer notices.
Full Coverage
End-to-end monitoring for your entire stack. One platform.
Monitor the UI your users touch and the APIs that power it all from a single tool, with a single config, in a single dashboard.
Monitor your frontend end-to-end.
Run real browser tests against your production UI. Click buttons, fill forms, and complete checkout flows. Catch broken UI flows and regressions in production. Works with your existing test project: no rewrites, no adapters.
Learn moreValidate every layer of your backend.
Assert on status codes, response payloads, headers, and timing. Chain API calls to test complete workflows: authenticate, create, verify, clean up. Catch the failures that a 200 OK hides.
Learn moreThe same tests your developers already write, running in production
Checkly is built on Playwright from the ground up. Browser Checks, Playwright Suites, and Multistep Checks all use the Playwright API your team already knows. No adapter, no DSL, no vendor lock-in.
 Import existing Playwright test suites directly as production monitors
- Multi-browser: Chromium, Firefox, WebKit, and mobile emulation
- Share StorageState, cookies, and auth across steps
- Bring custom npm dependencies and project fixtures
Define monitors in code, deploy them in CI/CD
Use the Checkly CLI to write monitors as TypeScript alongside your application code. Version control them, review them in PRs, and deploy them automatically, so monitoring always reflects what's actually in production.
- Test and deploy monitors in your CI/CD pipeline
- Automate thousands of monitors from a single config file
- Define shared templates and alert channels
- Enable AI agents to create and manage monitors for you
Debug & Resolve
Fix issues before your customers even know it's broken.
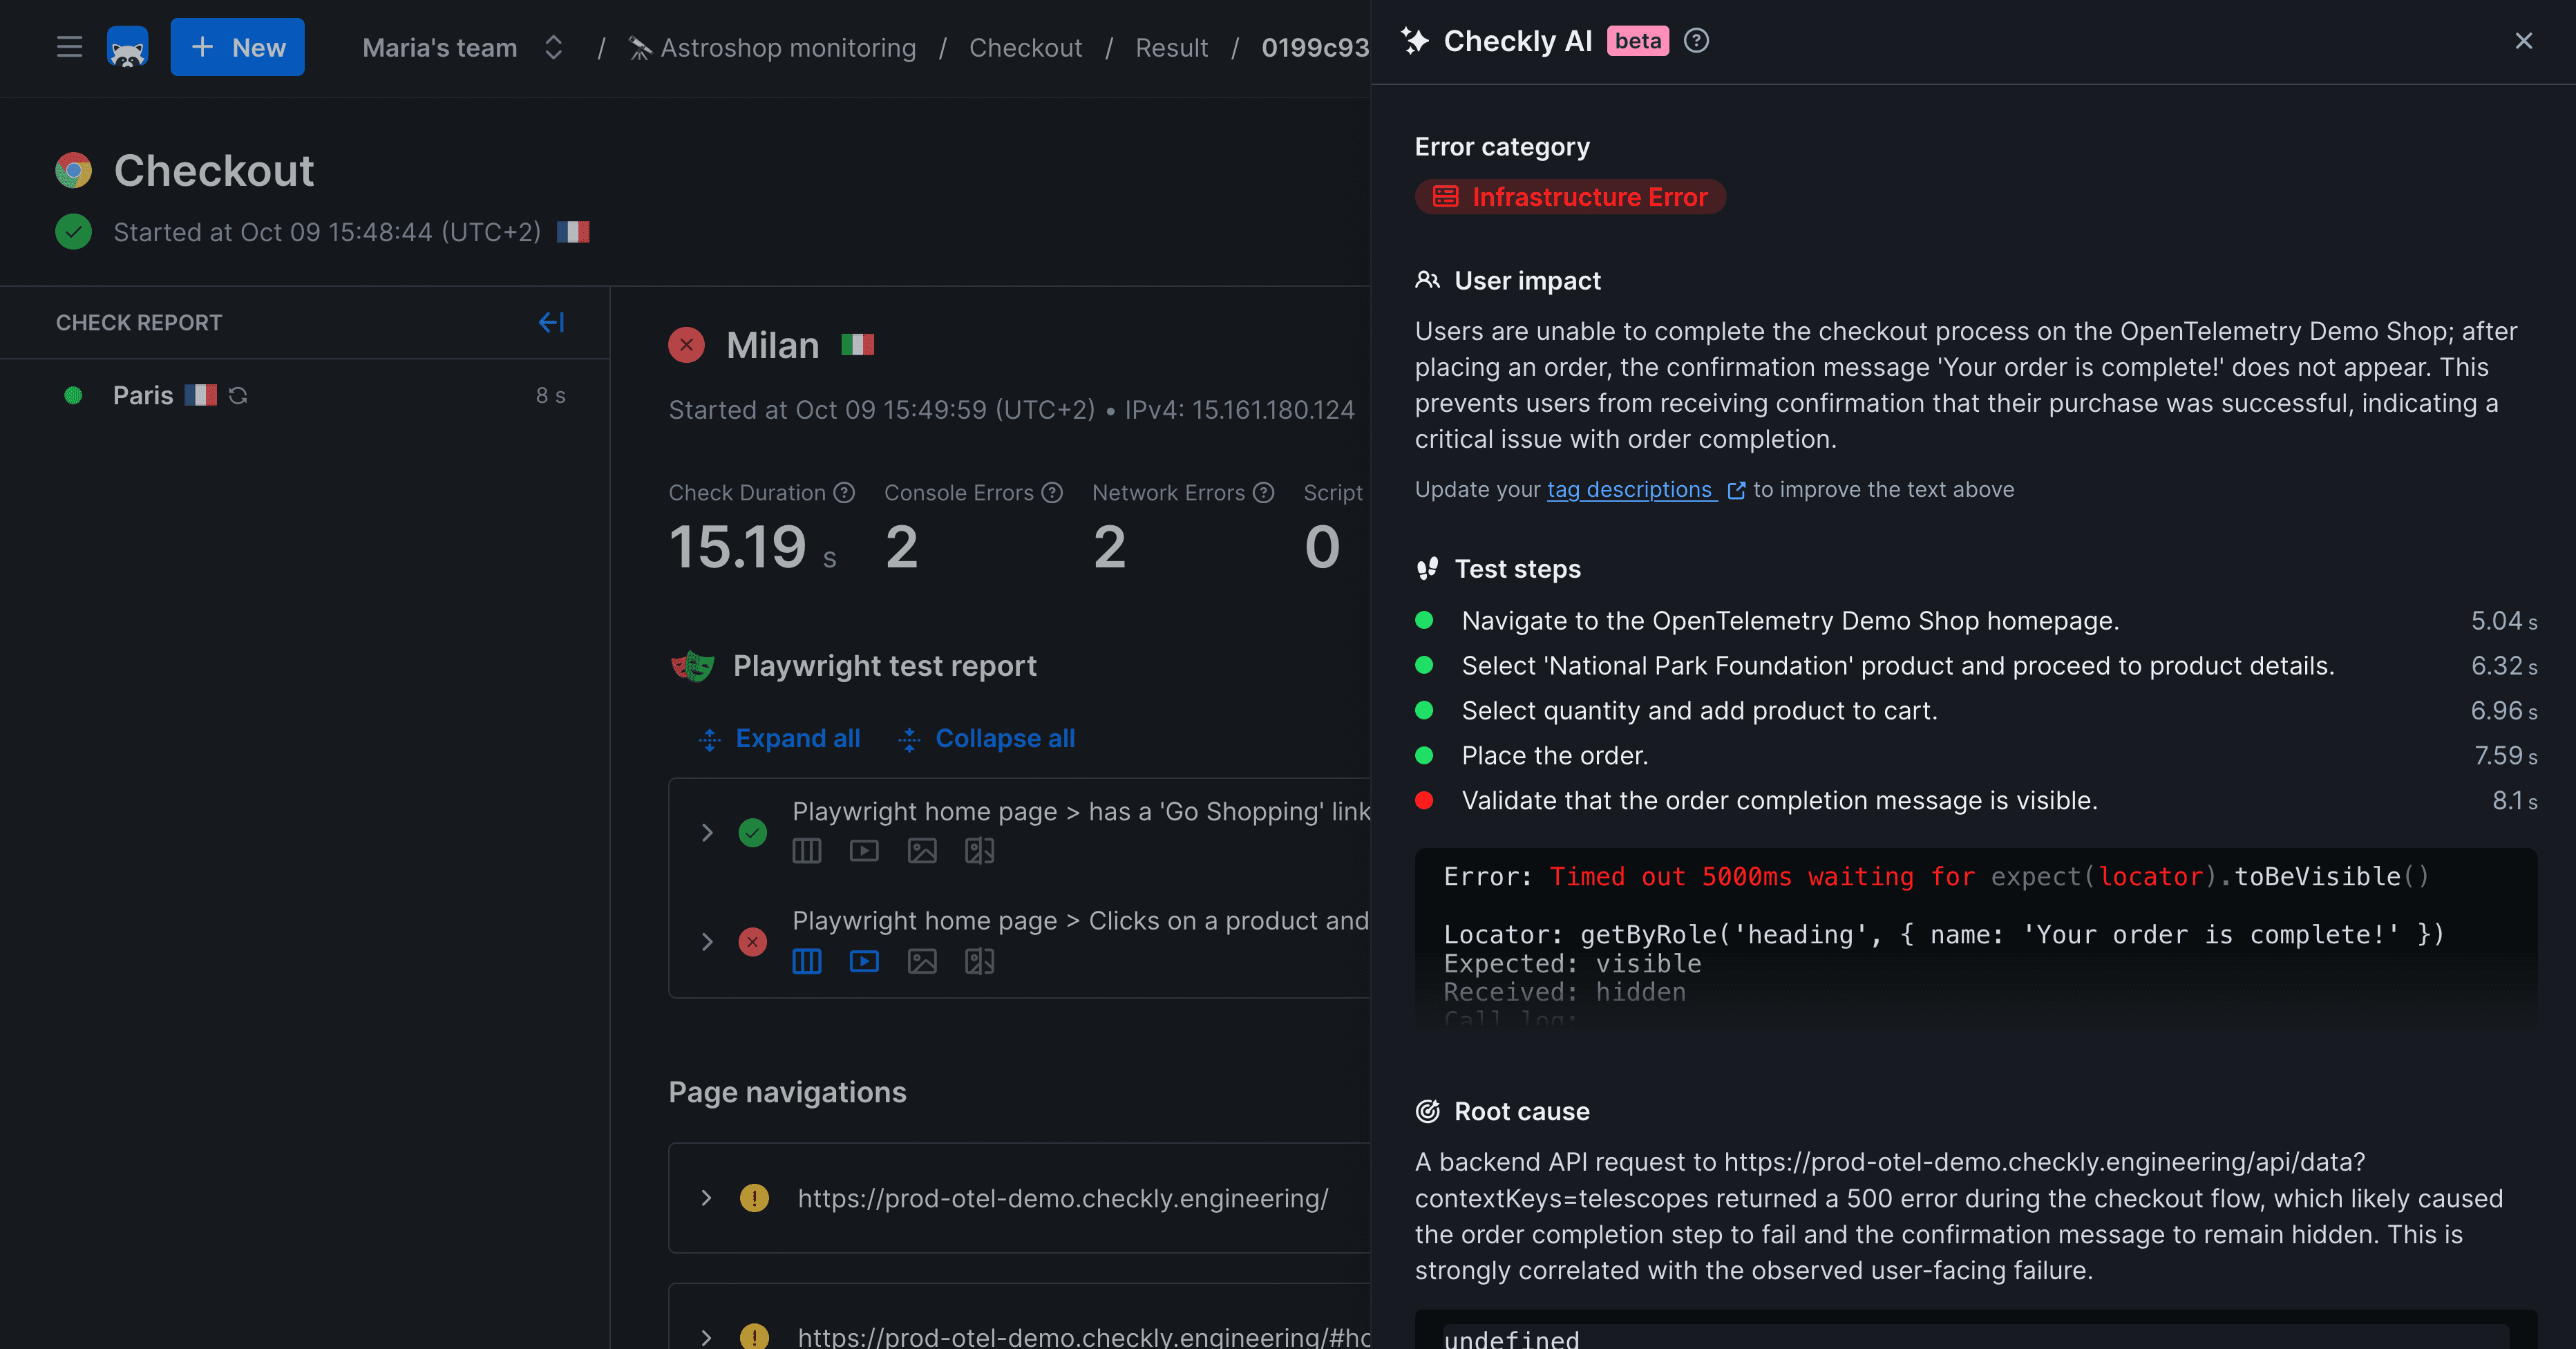
Every failed check captures the full picture: screenshots, video, traces, logs, and AI analysis, so you spend minutes debugging, not hours.
Detect, communicate, and resolve faster.
Synthetic monitoring finds the failure. Checkly's alerting, status pages, and Rocky AI make sure the right people know immediately, customers are informed automatically, and your team resolves it fast.
Alerting that reaches the right people with full context.
Slack, PagerDuty, email, or webhook. Every alert ships with the screenshot, trace, and AI root cause.
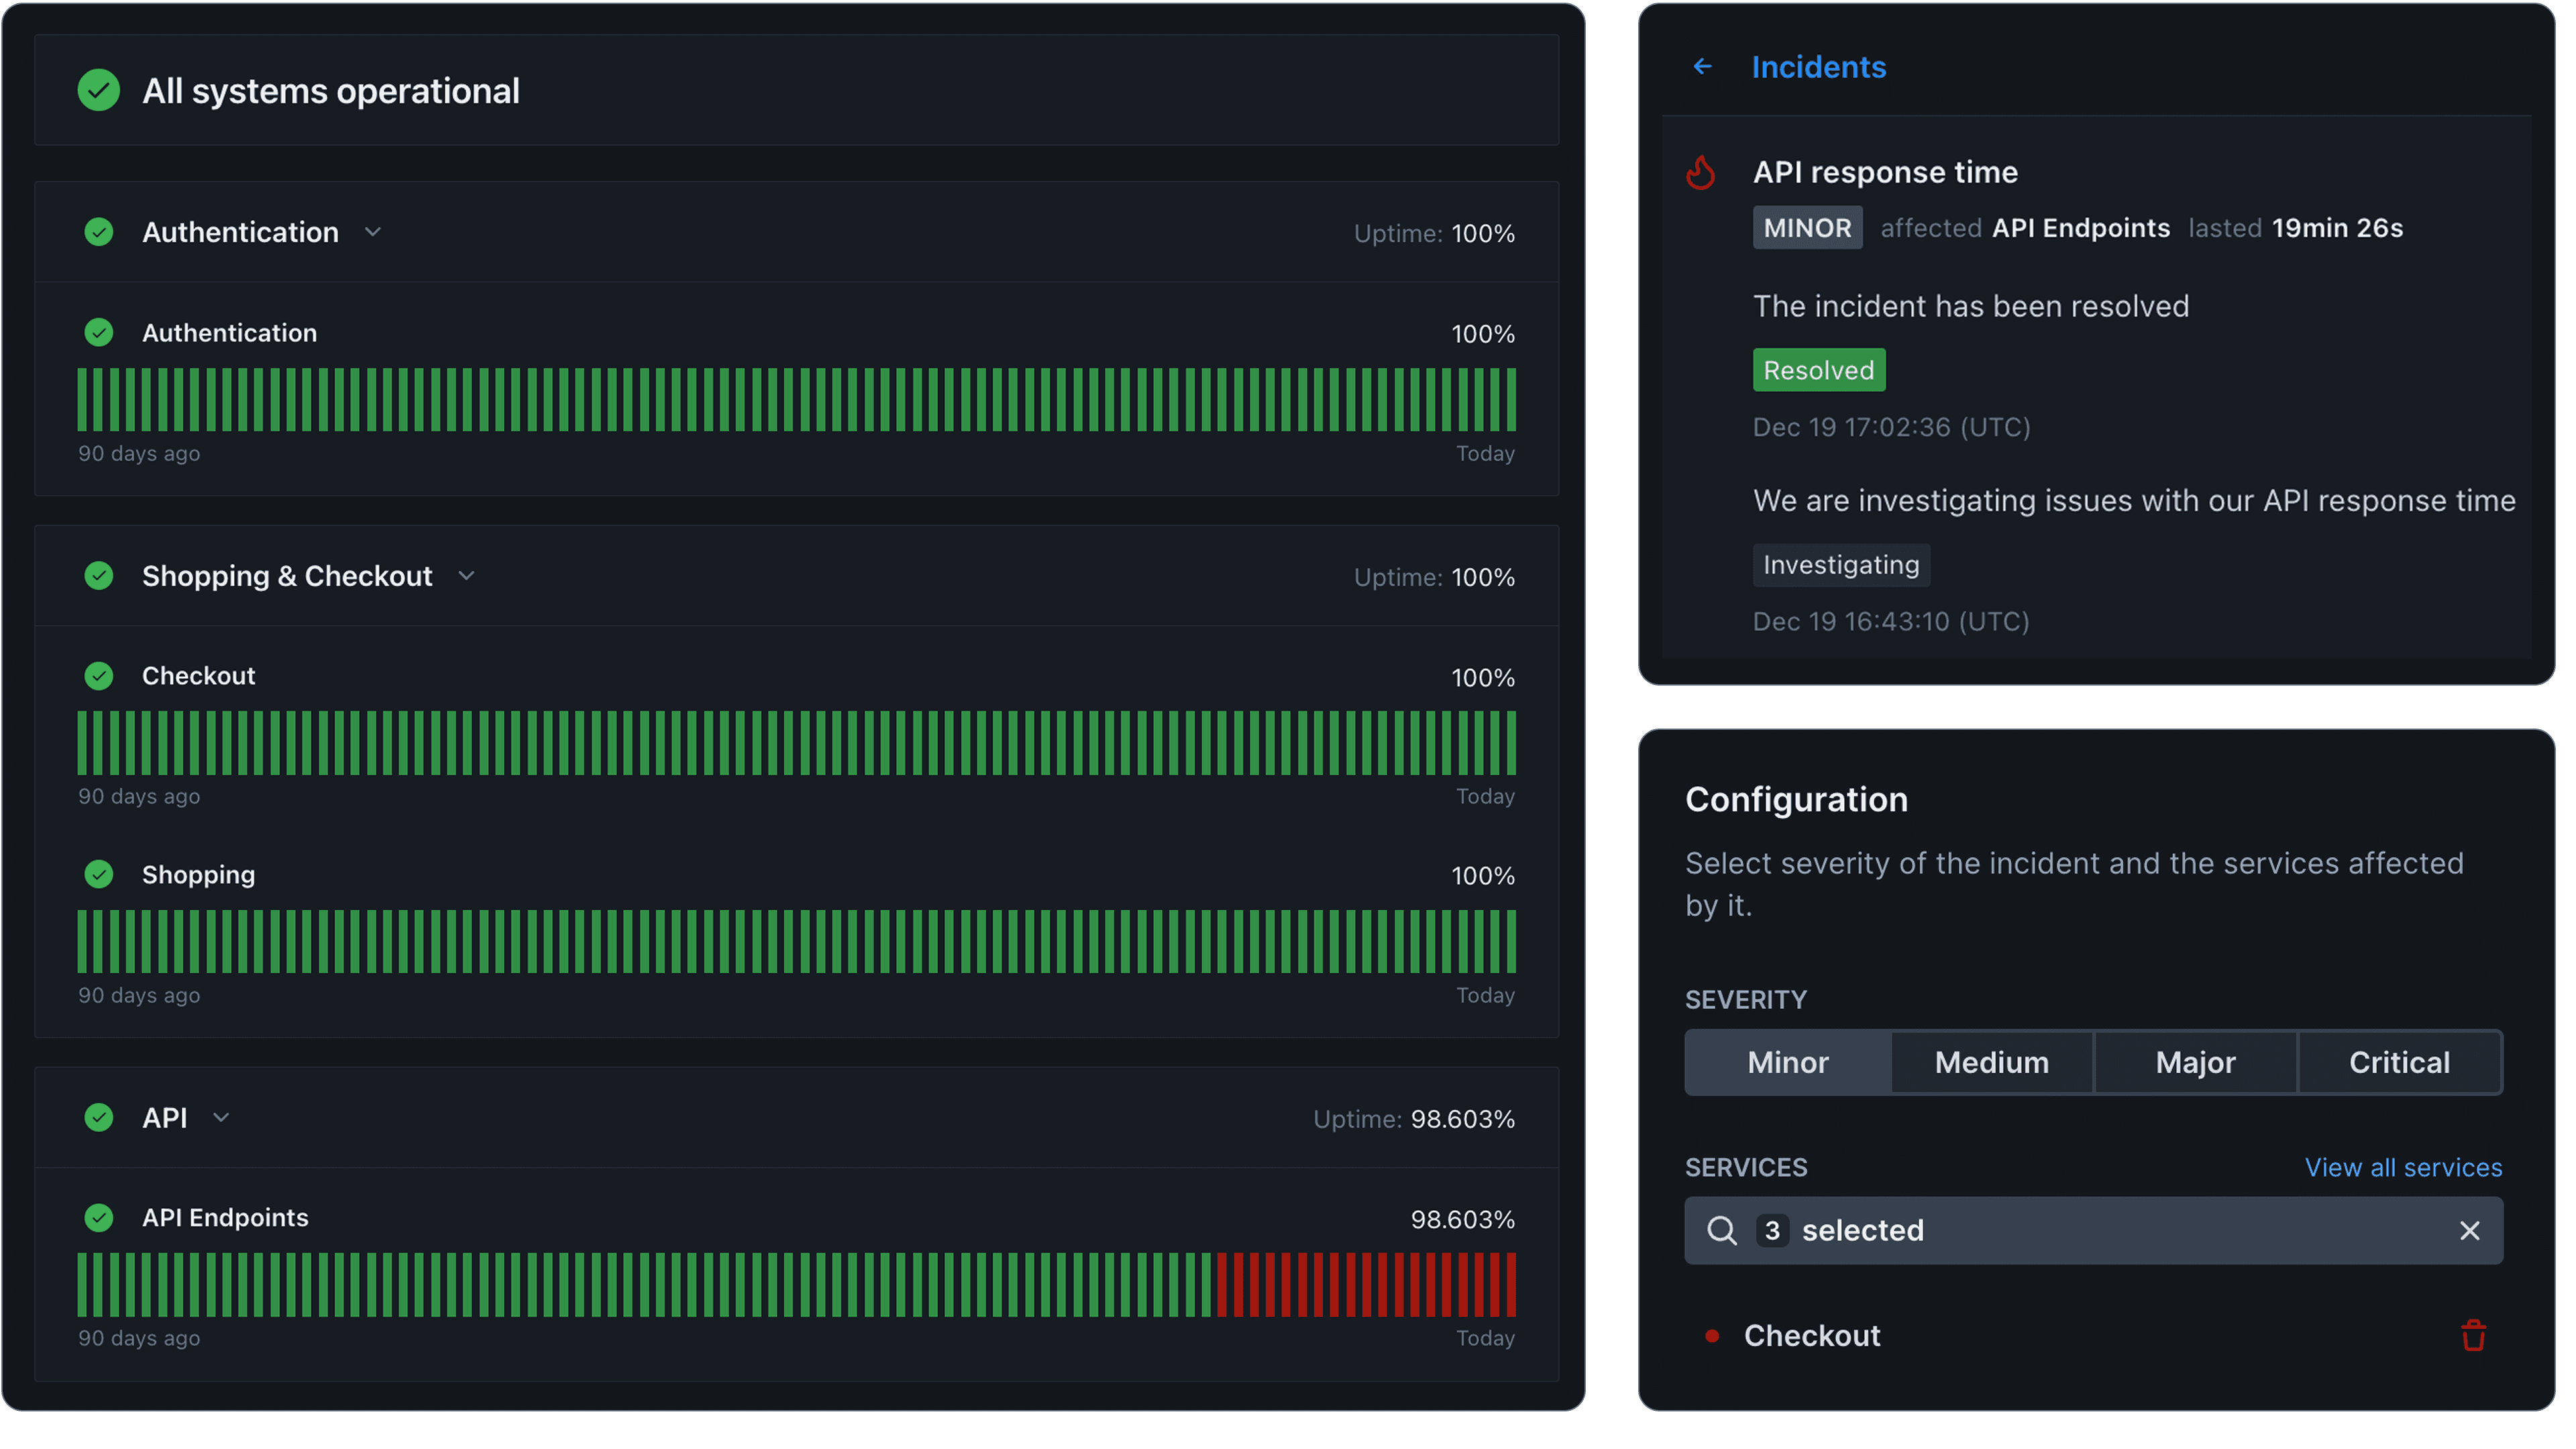
Status Pages that communicate incidents automatically.
Auto-open incidents and notify subscribers the moment a check fails. No manual updates.
Rocky AI tells you what broke before you open a terminal.
Traces, logs, and screenshots analyzed into a plain-language root cause on every failed run.
Alerting that reaches the right people with full context.
Slack, PagerDuty, email, or webhook. Every alert ships with the screenshot, trace, and AI root cause.
Integrations
Integrates with your development and agentic workflow
Connect Checkly to your existing tools. Get alerts where your team already works and manage monitoring through your existing workflows.

Slack
Real-time alerts in your team channels with rich context and actionable details.

PagerDuty
Trigger incidents and manage on-call rotations.

OpsGenie
Route alerts to the right team automatically based on your escalation policies.
Datadog
Forward metrics to your observability platform for unified dashboards.

Grafana
Visualize monitoring data in Grafana dashboards for comprehensive observability.

Discord
Get instant alerts in your Discord servers for real-time team notifications.

Coralogix
Stream monitoring data to Coralogix for advanced log analytics and insights.
Slack
Real-time alerts in your team channels with rich context and actionable details.
PagerDuty
Trigger incidents and manage on-call rotations.
OpsGenie
Route alerts to the right team automatically based on your escalation policies.
Datadog
Forward metrics to your observability platform for unified dashboards.
Grafana
Visualize monitoring data in Grafana dashboards for comprehensive observability.
Discord
Get instant alerts in your Discord servers for real-time team notifications.
Coralogix
Stream monitoring data to Coralogix for advanced log analytics and insights.

Terraform
Manage your monitoring infrastructure as code with our Terraform provider.

Honeycomb
Send monitoring events to Honeycomb for deep observability and debugging.

Pulumi
Define monitors using your favorite programming language with Pulumi.

MS Teams
Receive alerts directly in Microsoft Teams channels.

FireHydrant
Trigger incidents in FireHydrant for streamlined incident management.

Rootly
Connect to Rootly for automated incident response and resolution tracking.

Telegram
Receive instant alerts via Telegram for mobile-first notifications.
Terraform
Manage your monitoring infrastructure as code with our Terraform provider.
Honeycomb
Send monitoring events to Honeycomb for deep observability and debugging.
Pulumi
Define monitors using your favorite programming language with Pulumi.
MS Teams
Receive alerts directly in Microsoft Teams channels.
FireHydrant
Trigger incidents in FireHydrant for streamlined incident management.
Rootly
Connect to Rootly for automated incident response and resolution tracking.
Telegram
Receive instant alerts via Telegram for mobile-first notifications.
Evaluation Guide
What to look for in a synthetic monitoring tool
Synthetic monitoring tools differ widely in scripting model, check depth, and pricing. If you are still working out what synthetic monitoring is and where it fits alongside real user monitoring, start there. Whether you pick Checkly or not, these are the criteria worth weighing when you compare platforms.
An open scripting standard
Proprietary recorders and DSLs lock your checks into one vendor. Tools built on an open standard like Playwright keep your scripts portable, reviewable in PRs, and writable by the AI coding tools your team already uses.
Browser and API checks in one platform
A login flow and the API behind it fail in different ways. Look for a tool that monitors full browser journeys and individual API endpoints side by side, with shared alerting and one dashboard.
Monitoring as code
Click-ops monitors drift out of sync with your application. A CLI-first workflow lets you version control monitors, review them like any other code, and deploy them from CI/CD on every release.
Global locations and check frequency
An outage in one region is invisible from another. Check how many locations a tool runs from, how often checks can run, and whether high frequency is priced within reach.
Debugging artifacts on every failure
A red check without context is just a louder pager. Every failed run should capture screenshots, video, traces, and logs so you can find the root cause in minutes instead of reproducing it by hand.
Predictable pricing
Per-run billing punishes you for monitoring more often, from more locations, with retries. Favor flat, plan-based pricing you can forecast before you scale up your check suite.
Compare
How Checkly compares
Most synthetic monitoring products are either bolted onto a larger observability suite or built on legacy scripting engines. Checkly is Playwright-first, managed as code, and priced to be predictable. Here is how it stacks up against the tools teams most often switch from.
Checkly vs. Datadog
Datadog bills synthetic monitoring per test run, so costs climb with every extra location, retry, and frequency bump. Checkly runs standard Playwright on flat, predictable plans.
Read the comparisonCheckly vs. New Relic
New Relic scripted browser monitors run on a Selenium-based runtime. Checkly runs native Playwright, so your team reuses the same tests it already writes and maintains in CI.
Read the comparisonCheckly vs. Pingdom
Pingdom covers basic uptime and simple transaction checks well. Checkly goes deeper: full Playwright scripts, API checks with assertions, and traces, video, and screenshots on every failure.
Read the comparisonStart monitoring real user flows in minutes
Browser Checks, Playwright Suites, API Checks, Multistep Checks, all from one platform, all managed as code, all running from 22+ global locations.