
Cloud-based database providers often provide great observability out of the box.
But, what if you’re developing a tricky feature locally and need more details about what your local Clickhouse is doing?
There are many options, but if you’re a numbers and graphs person like me, you’ll want to be able to view the inner workings of Clickhouse in something like Grafana.
Today, we’ll walk through how to quickly set up an effective observability pipeline for your local Clickhouse instance.
Prerequisites
First, you must have admin access to an instance of Prometheus and Grafana. If you do not already have access to both of these, I recommend spinning them up locally using Docker. While this is out of scope for this post, don’t give up if this sounds like a lot of work.
You can have both of these up and running locally with one docker-compose.yml. There are tons of great guides out there to get you started, including some docker-compose.yml templates, which I will link below.
💡 Quick Setup Guides / Repositories for local Prometheus / Grafana configuration
Once your Prometheus and Grafana are up and running, we need to ensure your Clickhouse has the Prometheus exporter enabled. I prefer to use the clickhouse/clickhouse-server Docker images because they come with the Prometheus exporter enabled, we just have to make sure to forward port 9363 out of the container.
Fetching Data, aka Grafana Datasources
With all of the puzzle pieces set up and running, we can begin collecting Clickhouse metadata. If you’re familiar with Grafana, you’ll know that there are many kinds of data sources from which it can query information. For Clickhouse, two primary data sources will enable us to immediately use some of the fantastic community dashboards linked toward the bottom of this post.
1. Prometheus Exporter (/metrics)
First is the Prometheus exporter, which comes built-in to most Clickhouse containers. To ensure the data gets from the exporter to Prometheus and finally on to Grafana, make sure port 9363 is accessible from your Clickhouse. Then open your prometheus.yml config file and add your Clickhouse host + port 9363 to the scrape targets list. For example, here’s a snippet from my Prometheus config file:
# A scrape configuration containing exactly one endpoint to scrape:
# Here it's Prometheus itself.
scrape_configs:
  # The job name is added as a label `job=<job_name>` to any timeseries scraped from this config.
  - job_name: "local-clickhouse"
    static_configs:
      - targets: ["10.0.0.10:9363"]
Once updated, restart Prometheus, and it should begin scraping that endpoint. To access this data in Grafana, don’t forget to add Prometheus as a data source in Grafana.
2. Altinity Clickhouse Datasource
The second important data source is maintained by Altinity and is based on querying Clickhouse directly. This will enable us to access a few more advanced metrics inside Clickhouse and is required for the (arguably) most useful Dashboards for an application developer. Before adding the data source in Grafana, however, let’s first open a session to Clickhouse via the clickhouse-client CLI, or whichever DB client you prefer, and use the following commands to create a new user for Grafana to connect via.
create user grafana identified by 'PASSWORD';
grant all on *.* to grafana with grant option;
Next, you’ll need to manually install this data source plugin. This can be done with the grafana-cli application. Open a shell in your Grafana container, or wherever the CLI is accessible, and run the following command: grafana-cli plugins install vertamedia-clickhouse-datasource.
Finally, now that we’ve prepared Clickhouse and installed the data source plugin, we can continue in Grafana. There, go to “Connections → Add a new Connection” and select the “Altinity Clickhouse” option. You will then be taken to a form where you can enter the Clickhouse instance hostname, port, credentials, etc. In this case, you can use the http connection type and http://localhost:8123 as your host and port. Finally, use the credentials of the user you just added to Clickhouse previously. Once you’ve entered everything, click “Test & Save” at the bottom of the form. If everything has gone well, you will receive a green success message and banner.
Displaying Data, aka Grafana Dashboards
Finally, we’ve got all of the critical data sources installed, configured, and pointing at our Clickhouse instance. Now we can begin adding Dashboards to Grafana. You can import these by copying/pasting their dashboardId into the “Import Dashboard” wizard (click here if you’re not familiar with the process).
The community dashboards linked below are organized by the type of data source they require. The group requiring the Altinity Clickhouse Datasource is the most useful in my experience.
- Prometheus
https://grafana.com/grafana/dashboards/14192
https://grafana.com/grafana/dashboards/13500
https://grafana.com/grafana/dashboards/882-clickhouse/
- ClickHouse Query (Altinity/Vertamedia)
https://grafana.com/grafana/dashboards/13606-clickhouse-performance-monitor-xm-uat/
https://grafana.com/grafana/dashboards/2515-clickhouse-queries/
The first Altinity Dashboard includes tables that give you metrics on every query executed, like how much memory they consumed, how many rows were read or written, etc.

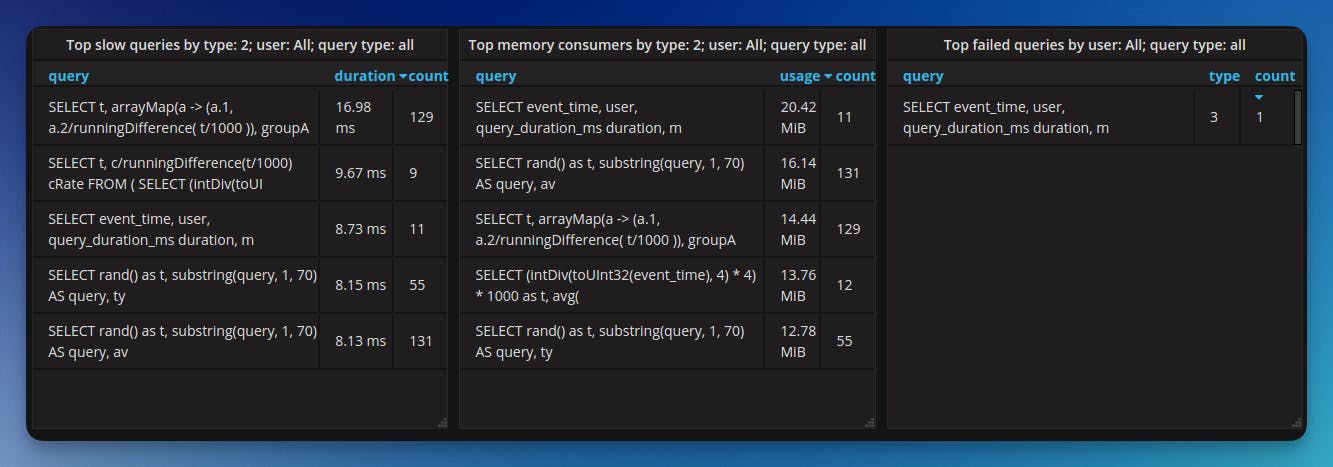
The second dashboard includes panels like top slow queries and top memory consuming queries which are particularly helpful to application developers during the development and debugging processes!
Summary
To enable better development observability into Clickhouse, we’ve had to ensure access to an instance of Prometheus and Grafana. We’ve had to modify those programs and add additional users to Clickhouse for them to use.
We’ve had to add custom data sources to Grafana and finally make use of the community dashboards shared by the observability fans who have been here before us!
That begs the final question: Was it all worth it? Let me know in the Checkly Slack how much time it has saved you next time you’re stuck on optimizing one last database query before your PR can go out!