
If you’re into monitoring, Prometheus is probably an essential part of your stack. Thanks to its expressive query language (PromQL), scalability, and configurable data format, it remains one of the most popular tools for data collection.
Paired with Prometheus exporters, the tool can adapt to a variety of surroundings, which is one of its strongest points. With the help of exporters, Prometheus can provide insightful data and effectively monitor a variety of services, including databases, web servers, and custom-made applications.
Prometheus' sophisticated alerting system, lively community, and easy integration make it the go-to option for monitoring intricate and dynamic systems.
In this article, we’ll take a look at the use of Prometheus exporters, some Prometheus exporter examples, and their use in action. Finally, we’ll see how Checkly’s Prometheus V2 exporter works.
What is a Prometheus Exporter?
By acting as go-betweens for Prometheus and other services, exporters make it easier to keep an eye on many different applications and infrastructure parts. These exporters collect particular metrics from the target systems and deliver them in a Prometheus-readable way. A variety of metrics, including CPU, memory, disk I/O, network statistics, and custom application-specific metrics, can be included.
Prometheus exporters can be community-made third-party integrations or custom creations for particular services or applications. Prometheus will monitor several system components with the use of exporters, giving important information on the functionality and health of the system.
Prometheus gathers time-series data points from exporters' data scrapes, which results in dashboards, alerts, and graphs. This data-driven approach to monitoring facilitates more effective troubleshooting and improved decision-making by providing insight into the behavior of infrastructure and applications.
For instance, when Prometheus gathers time-series data points from a custom collector monitoring a microservices architecture, it can track metrics such as individual service response times, error rates, and resource utilization. These metrics, once collected and visualized on dashboards, provide a detailed overview of each service's performance. This data-driven approach enables teams to quickly identify bottlenecks, troubleshoot issues, and make informed decisions, ensuring the smooth operation of the entire microservices ecosystem.
How to Use Prometheus Exporters for Monitoring?
In order to use Prometheus exporters for efficient monitoring, these exporters must be configured, deployed, and integrated with Prometheus. Here's a detailed how-to:
Identify Metrics to Monitor
Choose the precise system or application metrics that you wish to keep an eye on. These might be application-specific metrics or conventional metrics like CPU and memory consumption
Choose an Exporter
Choose between building a customized exporter based on the metrics of your application or using one of the pre-built exporters already available in-app or in the community.
Note that some third-party software export metrics in the Prometheus format, so you don't need any separate exporters.
Deploy
The deployment is different based on the exporter you choose.
- Pre-Built Exporters
- Download or install the pre-built exporter relevant to your application.
- Configure the exporter, specifying which metrics to collect and the HTTP endpoint to expose them.
- Deploy the exporter alongside your application or on a server accessible to Prometheus
- Custom Exporters
- Develop a custom application or script that collects the desired metrics.
- Expose an HTTP endpoint in the exporter application for Prometheus to scrape.
- Ensure the metrics are formatted correctly, either as key-value pairs or in Prometheus exposition format.
Prometheus Configuration
Modify the Prometheus configuration to include the endpoint details of the exporter.
- Add a new job configuration in the Prometheus configuration file (usually prometheus.yml).
- Define the target endpoints (exporter's HTTP endpoints) under the appropriate job in the configuration file.
- The scheme defaults to ‘http’ and the metrics_path defaults to '/metrics' change those accordingly
Here’s an example of a Prometheus configuration snippet:
scrape_configs:
  - job_name: 'example-job'
    static_configs:
      - targets: ['exporter-endpoint:port']

    # Default to scraping over https. If required, just disable this or change to
    # `http`.
    scheme: https
    metrics_path: /metrics
Restart Prometheus
Restart the Prometheus server to apply the updated configuration.
Verify and Explore
Access Prometheus web interface and verify that the newly added job and targets are visible in the "Targets" or "Service Discovery" section.
Then, you can explore the collected metrics using Prometheus' query language (PromQL) through the web interface.
Finally, use the data to create custom dashboards, graphs, and alerts based on the collected metrics through Prometheus or visualization tools like Grafana.
Monitoring and Alerting
Set up alerting rules in Prometheus based on the exported metrics to receive notifications when certain conditions are met.
Continuously monitor the metrics and adjust alerting thresholds as necessary to maintain an effective monitoring system.

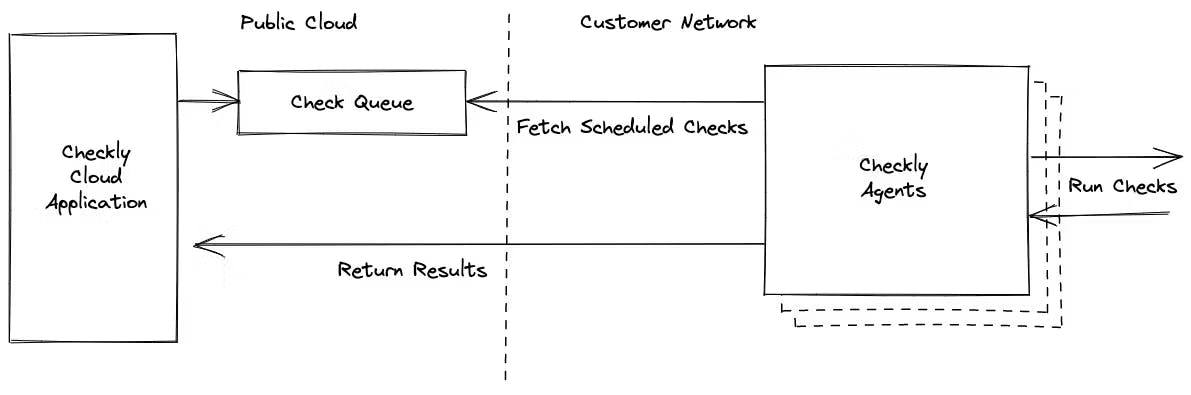
By following these steps, you can successfully integrate Prometheus exporters into your monitoring infrastructure, allowing you to gather valuable insights into your applications and systems, like this:
Examples of Prometheus Exporters
Prometheus exporters are available for a wide range of applications and systems, allowing you to monitor various metrics. Here are some examples of popular Prometheus exporters:
- Node Exporter: Collects various system-level metrics such as CPU usage, memory utilization, disk I/O, and network statistics from Linux and Unix-like systems.
- Blackbox Exporter: Performs HTTP, HTTPS, DNS, TCP, and ICMP probes to collect data about the availability and responsiveness of network endpoints.
- Exporter for Docker: Monitors Docker containers, collecting metrics about container CPU usage, memory, network activity, and more.
- MySQL Exporter: Gathers metrics from MySQL and MariaDB databases, providing insights into database performance, query execution times, and other database-related statistics.
- PostgreSQL Exporter: Similar to MySQL Exporter but for PostgreSQL databases, offering metrics related to PostgreSQL database server performance.
- Redis Exporter: Monitors Redis key-value store, collecting data on memory usage, commands processed, and other Redis-specific metrics.
Here are some additional Prometheus exporter examples:
- Apache Exporter
- NGINX Exporter
- Prometheus SNMP Exporter
- JMX Exporter
- Kubernetes State Metrics
- RabbitMQ Exporter
These exporters are just a few examples–there are many more available for various databases, messaging systems, cloud services, and custom applications. You can find exporters developed by the community on the Prometheus website and other online repositories.
Prometheus Exporters Best Practices and Techniques
Now, let’s look at some of the things you need to know about when implementing a Prometheus exporter.
Find an existing Prometheus exporter
Choosing to work with an existing Prometheus exporter rather than creating a customized one has benefits and adds to your efficiency. Building a strong exporter from the ground up takes a lot of time, energy, and knowledge. You can prevent the difficulties of developing, testing, and refining by using pre-built exporters, which enables easier integration into your monitoring infrastructure.
Existing exporters also frequently gain from a larger user base and strong community involvement. Together, these activities provide frequent bug fixes, optimizations, and feature additions that guarantee the exporter's dependability and keep it current with changing industry best practices.
In addition to saving money on development resources, using community-supported exporters provides a more feature-rich and reliable way to keep an eye on your systems and applications.
Choose targeted metrics
Make sure you choose your metrics wisely in order to minimize superfluous overhead. Only include the metrics that are essential for tracking and debugging, making sure that the information gathered yields useful information.
Concentrate on the essential performance indicators that are pertinent to the health and performance of your system. Unnecessary metrics may block Prometheus storage and impact query performance.
Understanding Prometheus monitoring includes the crucial domain of service level metrics in addition to standard metrics. These multiple metrics, which include uptime, error rates, and reaction times, provide a thorough understanding of the dependability and performance of the software.
To successfully capture these service level metrics, it becomes imperative to integrate a Prometheus client library within the software. With the help of client libraries, developers can make sure that the specified service level objectives (SLOs) are satisfied, which helps businesses maximize performance, quickly fix problems, and preserve the intended user experience.
By integrating these client libraries, developers can effortlessly export metrics, capturing vital service level data with precision.Optimize your Prometheus exporters
Optimize your Prometheus exporters
Make sure your exporters are optimized for resource efficiency as you develop them. When possible, think about putting caching methodologies in place to reduce the need for duplicate data retrieval.
Furthermore, pay attention to how frequently you scrape; too many scrapes might put stress on the target system and the exporter, thereby affecting both systems' functionality. Aim for a balance that guarantees regular data updates without placing an excessive burden on available resources.
Pay attention to error handling
Strong error handling is essential to your exports' dependability. Set procedures to properly manage temporary errors, including retrying unsuccessful requests after a short wait. Provide the proper alerts and tracking to let administrators know when problems continue. Extensive error handling helps diagnose issues quickly and guarantees the stability of your monitoring.
Secure your exporters
Protect your exporters against unwanted access. Make use of authentication techniques to guarantee that only authorized Prometheus instances are able to scrape data, such as bearer tokens or API keys. Limit exposure to potential security vulnerabilities by using firewalls or VPNs to restrict access to the exporter's endpoints. To keep your monitoring data private and secure, update security parameters often and fix vulnerabilities right away.
Monitor your exporters
Keeping an eye on your exporters is essential to a functioning monitoring environment. Establish internal metrics in the exporters themselves to monitor important performance parameters including the length of the scrape, the mistake rate, and the use of resources.
Use these internal metrics to inform alerting rules so that abnormalities or problems may be found quickly. To improve the overall dependability of your monitoring infrastructure and enable proactive issue resolution, you should also link your exporters with centralized logging and monitoring systems.
Prometheus Metrics Explained
Prometheus retrieves metrics using a straightforward HTTP request. That's why a user could have thousands—possibly many, many thousands—of different Prometheus metric categories.
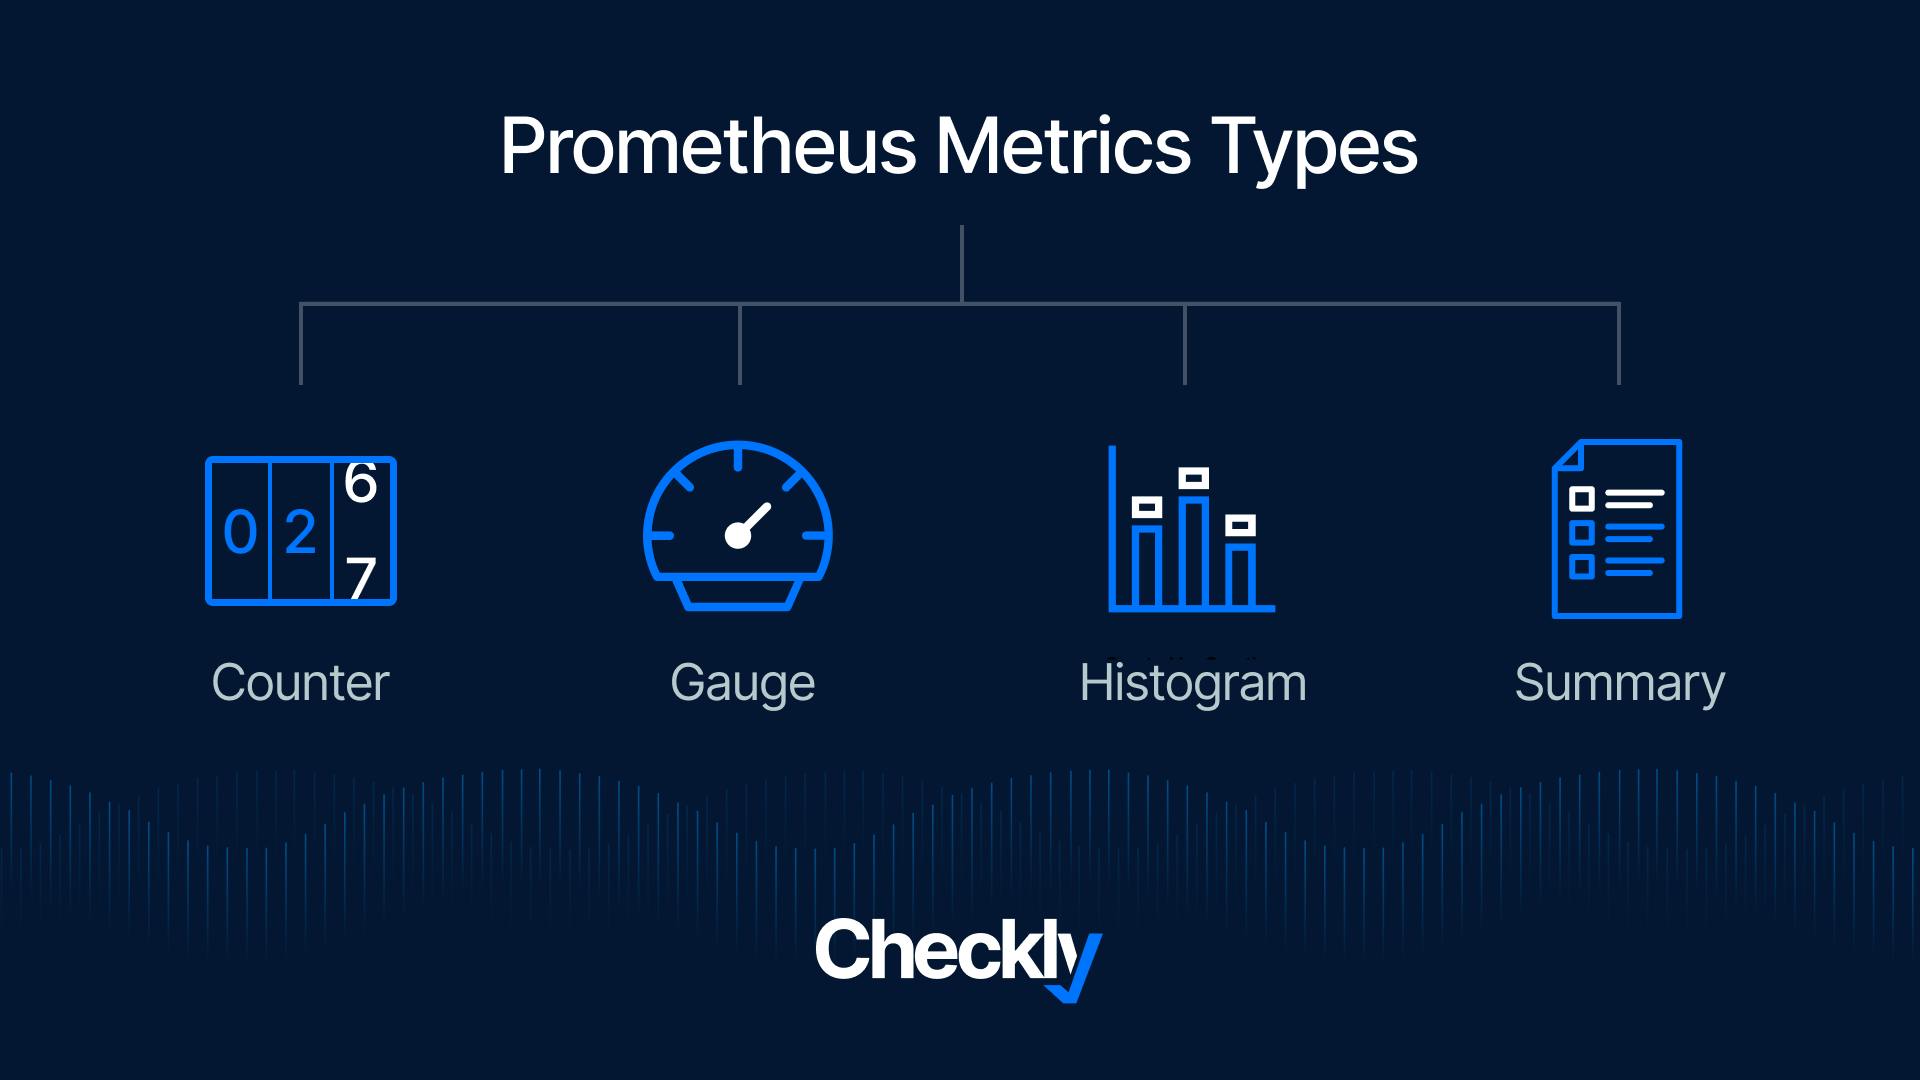
Nonetheless, the four primary categories of Prometheus metrics are counter, gauge, histogram, and summary. Let's examine each of these categories of metrics.
Counter
Counters have values that increase monotonically; they always start at zero and never stop. They stand for values that accrue over time, such as the overall quantity of requests fulfilled or assignments finished.
How do counters behave?
Counters cannot be decreased. The only ways they can reset are when the monitored system restarts or when an external action specifically resets the counter.
What’s their use?
For metrics that show cumulative numbers, counters are perfect since they let you monitor the total number of times a particular event occurs over time.
Gauge
Gauges are numerical numbers with an up/down range. They show numbers that are immediate at a certain moment, such as the system's available RAM or the proportion of the CPU that is currently being used.
How do gauges behave?
Gauges can increase or fall in response to the monitored system's condition. They can have any number value and are appropriate for measures that change over time.
What’s their use?
Gauges are used to record quantities such as temperatures, sizes, or percentages and are useful for metrics that indicate a certain condition at a particular time.
Histogram
The distribution of observed data into programmable buckets is measured using histograms. They also offer an event count and the total of all observed values.
How do histograms behave?
By tracking the value distribution, histograms help you comprehend the variability and dispersion of data points. Under the hood, they automatically generate bucketed counts.
What’s their use?
Histograms are handy when monitoring things like response times or request durations, since they help visualize the distribution of numbers, which is crucial for spotting outliers and bottlenecks.
Summary
Summaries follow the distribution of observed data, much like histograms do. On the other hand, summaries employ quantiles to present a more realistic image of the distribution of the data.
How do summaries behave?
By tracking percentiles (such as the 50th, 90th, and 99th percentile) of the observed values, summaries help you gain a better understanding of the distribution and provide insights into the variability of the data.
What’s their use?
Summaries could be used to measure latency, and in systems that handle a lot of requests, it can be important to understand certain percentiles, such as the 99th percentile, in order to guarantee a positive user experience.
Checkly’s Prometheus V2 Exporter in Action
Checkly's Prometheus Exporter is a specialized tool designed to seamlessly integrate Checkly's synthetic monitoring data with Prometheus.
Our recently released Prometheus Exporter V2 fetches metrics generated by Checkly's synthetic checks—such as response times, status codes, and error rates—and exposes them in a Prometheus format.
By utilizing this exporter, users can consolidate their real-time monitoring and alerting data within the Prometheus ecosystem, enabling comprehensive analysis, visualization, and alerting alongside other metrics collected from various applications and systems.
How to Activate Checkly’s Prometheus Exporter V2?
1. Go to the integrations tab in your Checkly dashboard and click the ‘Create Prometheus endpoint’ button

2. We directly create an endpoint for you and provide its URL and the required Bearer token.
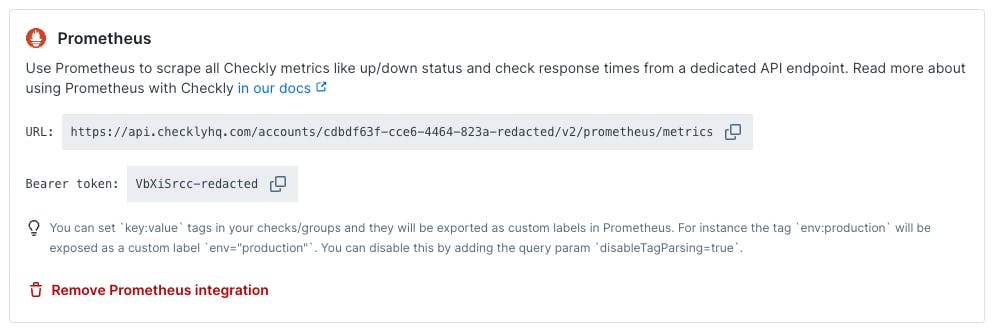
3. Create a new job in your Prometheus prometheus.yml config and set up a scraping interval. The scrape interval should be above 60 seconds. Add the URL (divided into metrics_path, scheme and target) and bearer_token. Here is an example
# prometheus.yml
- job_name: 'checkly'
scrape_interval: 60s
metrics_path: '/accounts/993adb-8ac6-3432-9e80-cb43437bf263/v2/prometheus/metrics'
bearer_token: 'lSAYpOoLtdAa7ajasoNNS234'
scheme: https
static_configs:
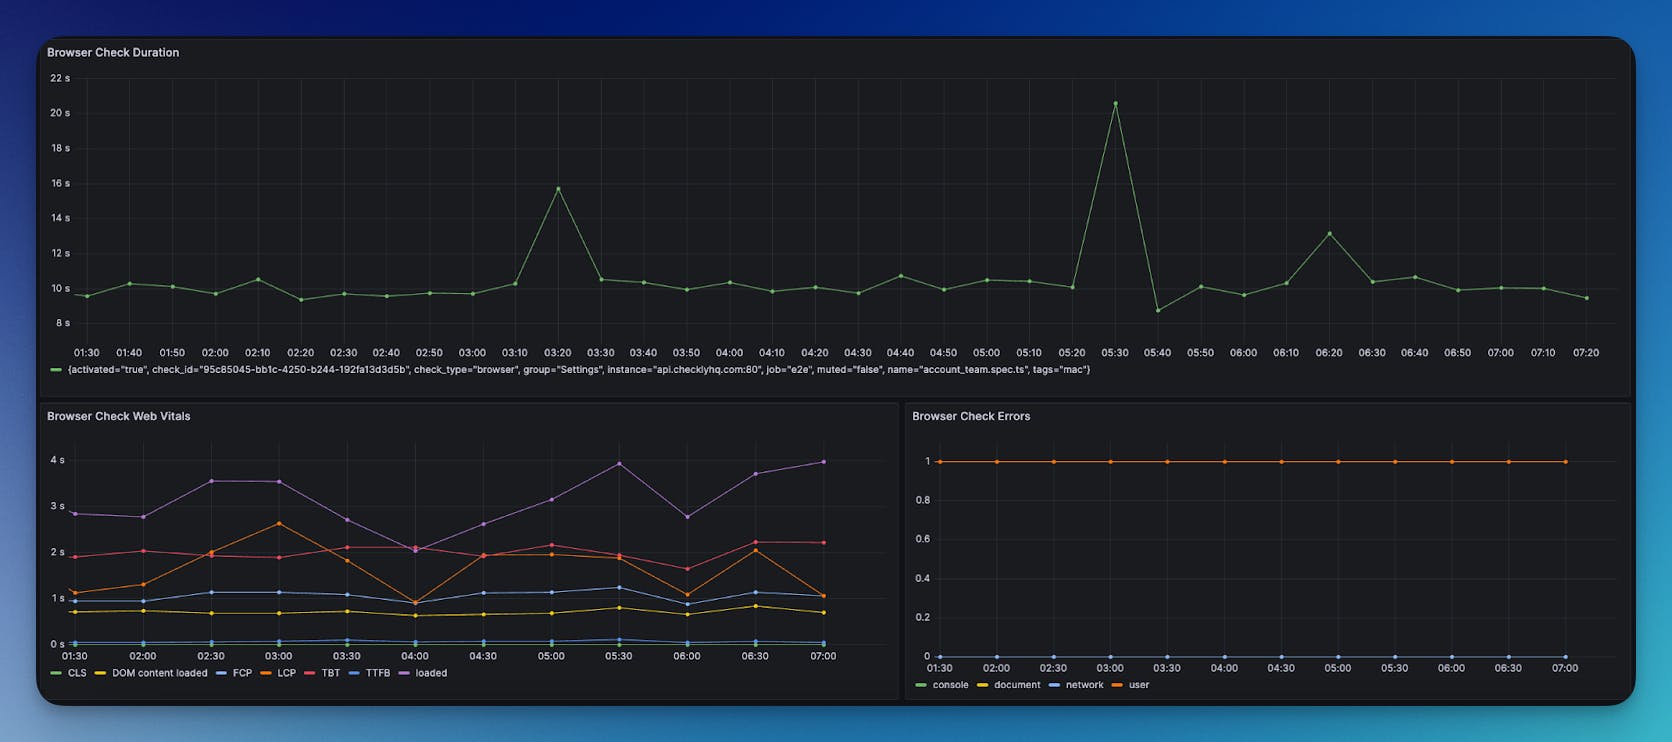
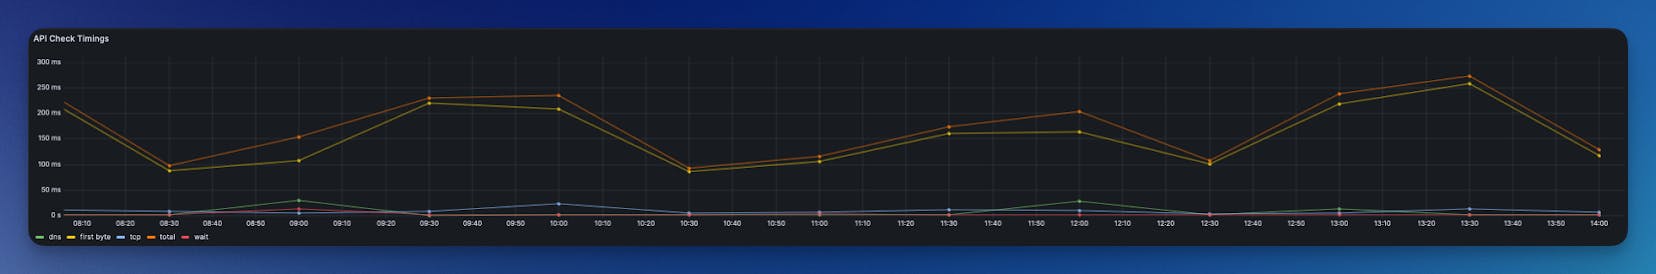
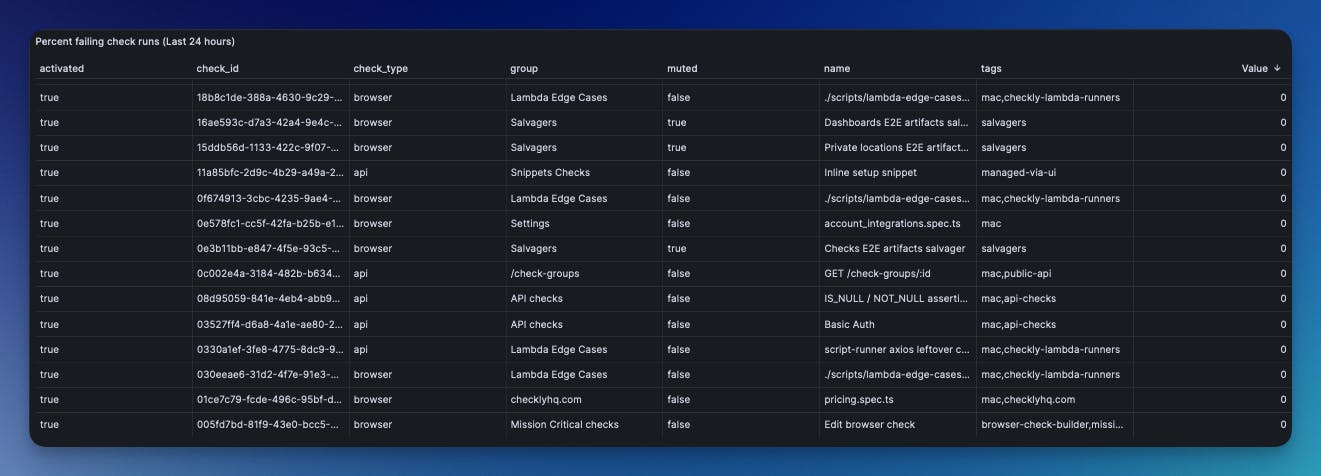
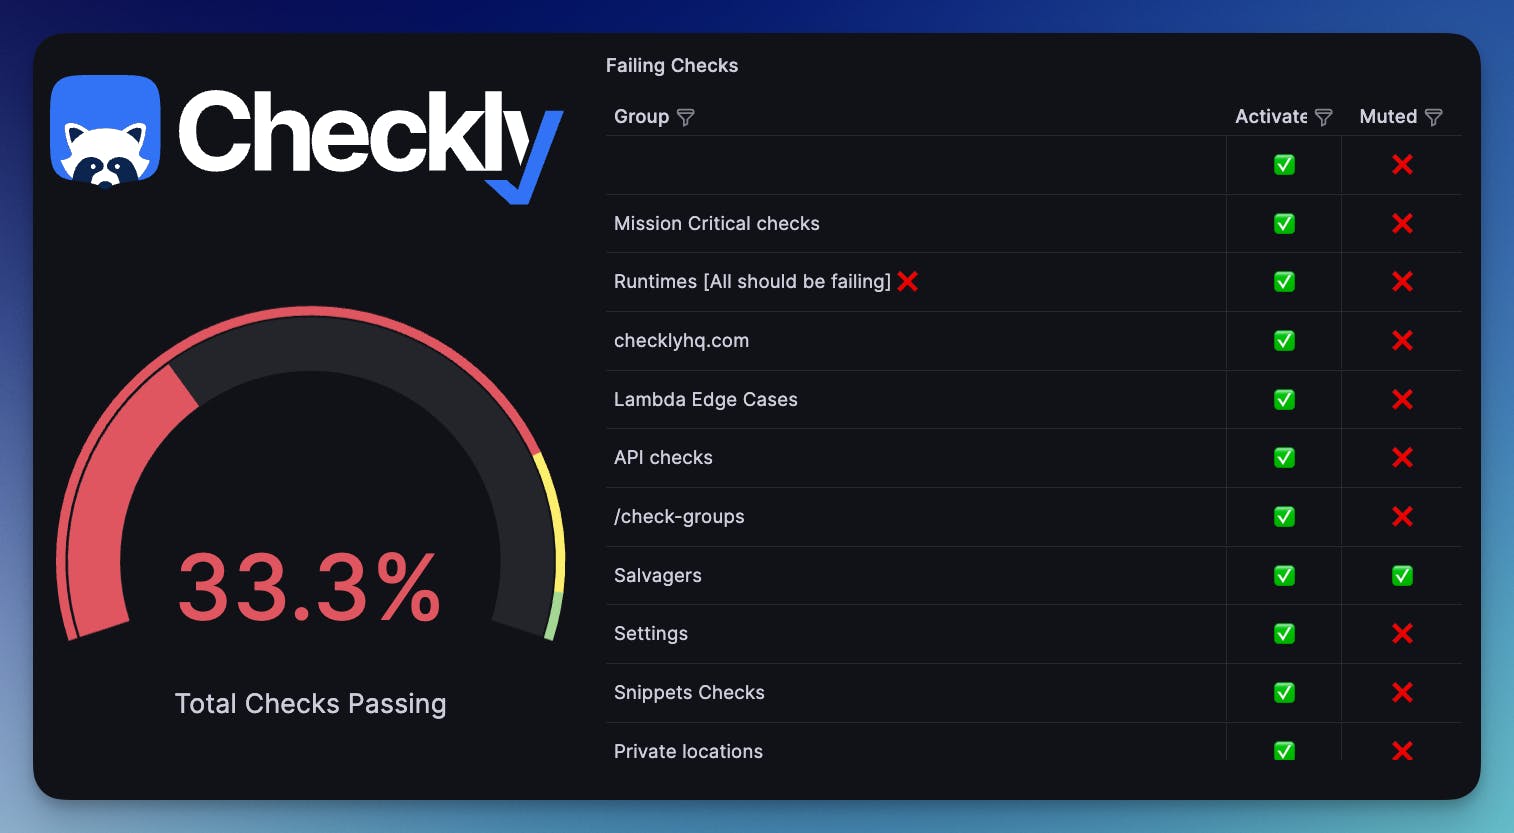
- targets: ['api.checklyhq.com']Now restart Prometheus and you should see metrics coming in. Here are some examples:
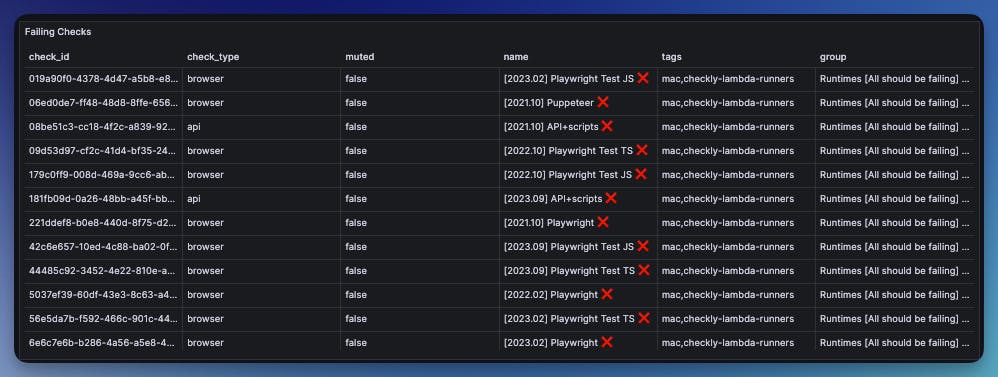
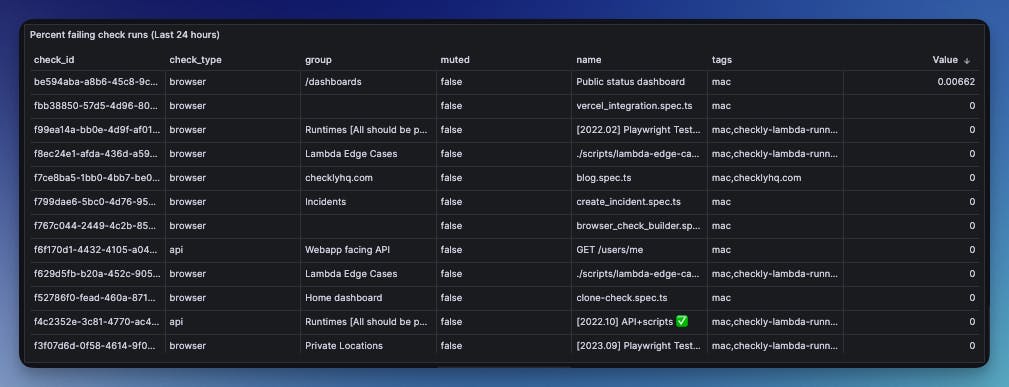
To find out all the metrics we cover, as well as some PromQL examples, check out our documentation.
Key Takeaways
Prometheus Exporters Overview:
- Prometheus is one of the most popular open-source monitoring and alerting toolkit designed for reliability and scalability.
- Prometheus exporters bridge the gap between Prometheus and various applications/systems by translating metrics into Prometheus-compatible formats.
- Exporters collect specific metrics, format them, and expose them through HTTP endpoints for Prometheus to scrape.
- There are four types of Prometheus metrics: counter, gauge, histogram, and summary.
Prometheus Exporter Best Practices:
- Export only essential metrics to avoid unnecessary overhead.
- Optimize exporters for efficiency to minimize resource usage.
- Implement robust error handling to ensure stability.
- Secure exporters to prevent unauthorized access.
- Monitor exporters internally and integrate them with centralized monitoring systems.
Choosing Between Existing and Custom Exporters:
- Existing exporters save development time and benefit from community contributions.
- Custom exporters offer flexibility for highly specific use cases but require significant development effort.
Application of Prometheus Exporters:
- Exporters are available for a wide range of applications, including databases, web servers, messaging systems, and cloud services.
- Integrating exporters with Prometheus allows for comprehensive monitoring, analysis, visualization, and alerting in diverse computing environments.
Checkly’s Prometheus Exporter:
- Integration with Checkly: Checkly's Prometheus Exporter provides a seamless integration between Checkly's synthetic monitoring data and Prometheus.
- Metrics Consolidation: It fetches crucial metrics from Checkly's synthetic checks, such as response times and error rates, and exposes them in Prometheus-compatible formats.
- Comprehensive Monitoring: By incorporating Checkly's data into Prometheus, users can monitor synthetic checks alongside other application and system metrics, facilitating comprehensive, centralized monitoring and analysis.
- Real-time Insights: Checkly's Prometheus Exporter enables users to gain real-time insights from synthetic monitoring, enhancing their ability to identify issues promptly and ensure optimal performance of their web applications and services.

Prometheus exporters empower businesses to achieve unparalleled monitoring precision and efficiency. They can help organizations navigate the complexities of modern IT environments and stay ahead in the ever-evolving landscape of technology.