

Table of contents
Six years ago I wrote about optimizing Checkly’s Lighthouse score in this blog post and now I’m back. Not by popular demand, but by (rightfully) upset customer demand.
This customer pinged me that accessing a critical page in our webapp — the page that we show you when you get an alert from us on your phone — was taking ~8 seconds to load.
Here's how we brought it down to three seconds in about 2 weeks time.
And “no”, we did not introduce Server Side Rendering (SSR).
Our Stack
A super quick intro to our stack should help frame the problem:
- Our webapp is a Single-Page Application (SPA) Vue.js app, hosted on Vercel.
- The backend API and database are in Ireland. This is important!
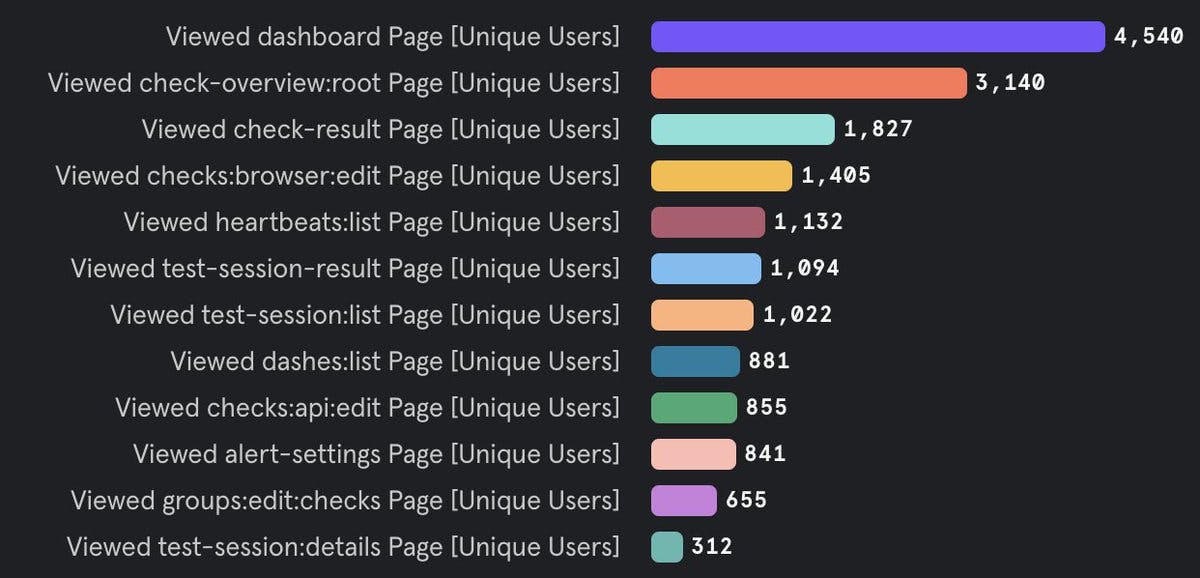
- The page I mentioned earlier, which internally we call the “check result page” is in the top three most viewed pages in our app.
See the Mixpanel screenshot below for receipts. 👇
Understanding the Problem
Let's start with an evergreen:
Solving a problem starts with reproducing the problem in a repeatable fashion.
Remember that one kids, it goes far.
In our investigation, we used DebugBear, setting it up from locations in the Netherlands (that’s where I live) and the US West Coast (that where the customer lives). We added a little script so the DebugBear can log into our app and then request that doomed "check results" page.
Our findings revealed several issues impacting our loading and rendering performance.
- No cache-control headers on a whole bunch of static JS, CSS etc. assets. Yeah...I know...😬
- Pretty long authentication dance with Auth0.
- Significant Largest Contentful Paint (LCP) delays caused by third-party assets like Intercom.
- Too many unnecessary first-party API calls, in some cases fetching things twice for no apparent reason.
Of course, the requests from US West were all slower than the requests from NL because the Netherlands is closer to Ireland than San Francisco is. (*citation needed)
Fixing the Problem
This is how we started fixing the problem, step-by-step.
Cache-Control Headers
We started by fine-tuning our cache-control headers. This optimization made sure that our assets were cached effectively, reducing load times for returning users. It's this tweak in the `vercel.json` file:
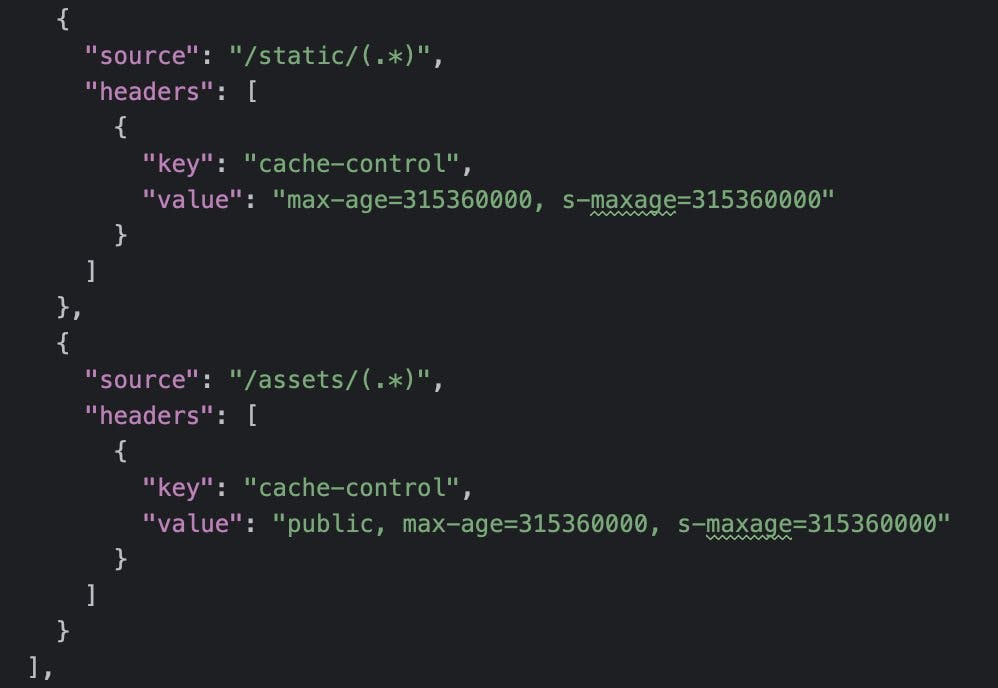
Why didn’t we do this earlier? Good question! Make sure to check out the Addendum.
Streamlining authentication with Auth0
We use Auth0 as our authentication provider and we were not using its built-in caching and revalidation options correctly. This meant we sent way to many validation requests to Auth0, slowing down most navigations. Note that for ANY useful data to be shown we ALWAYS need to authenticate first.
We ripped out a bunch of code and greatly simplified how a user's authenticated session is handled.
Optimizing third-party assets
Third-party assets are always a pain. We knew this, but did not really pay enough attention to it.
- We killed loading Google fonts 3 times and fonts we were not even using anymore.
- For good measure we also added and updated `Content-Security-Policy` headers so we have very explicit control over what gets loaded.
- We delayed loading Intercom, Featurebase, Segment, etc. till the first user interaction. Have a look at the (simplified) code snippet below. It was implemented as a composable in Vue.
import { useUserFirstActivity } from '@checkly/rakun-vue-utils'
import { useScriptTag } from '@vueuse/core'

export function useThirdPartyStuff () {
  const { load } = useScriptTag(
    // inject 3rd party script with configuration options
  )
  useUserFirstActivity(load, { delay: 1000 })
}
Optimizing first-party assets
Not all issues were just with other people's code, it was also our own code.
- We changed around some `if` statements which resulted in not loading the big `monaco.js` (the code editor library) when it is not needed. That's about 2.1MB of JavaScript not crossing the wire!
- We kicked out some XHR calls we did not need and were there for reasons nobody knew. 😐
- We kicked out XHR calls we did twice for no apparent reason.
The effects were pretty awesome. Note the little markers we set to track optimizations over time.
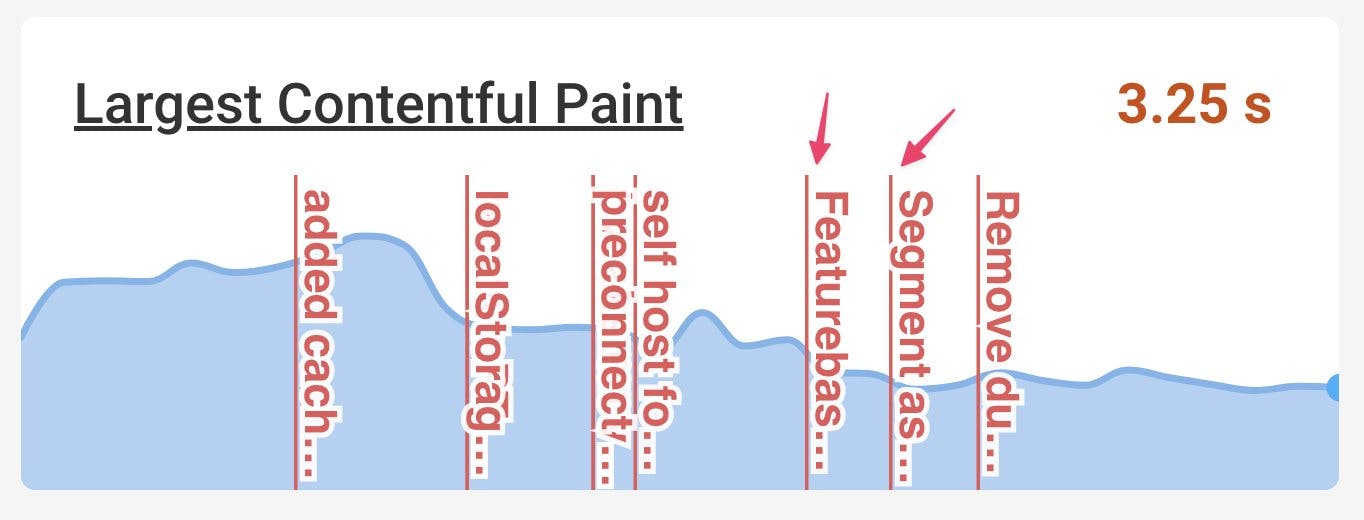
End result
After all of the above, we reduced the LCP in San Francisco from around 8 seconds to approximately 3 seconds — without implementing server-side rendering (SSR) or relocating our whole backend to the United States.
If we had pulled that trigger, the latency would probably be under 2 seconds. But that's a story for another time.
Addendum: Performance is like boiling frogs
The problems discussed above range from "pretty simple" to "slightly tricky". But none of them are rocket science. So why were they there to begin with? And why did it take a customer complaint for us to jump into action?
The only conclusion is that these issues start creeping in by slowly building out a large web app and just adding stuff without taking a step back now and then. You get used to load times. You forget not everyone is in the EU-zone. You forget why you made some decision years ago.
It's like the boiling frog metaphor. If you're in the water all the time and it slowly heats up, you don't notice till your boiled and it's too late. Or, to use a more relevant motto "performance is a feature" and you need to proiritize it just like any other features.