You get an infrastructure alert. Something's off, so you task your agent to investigate, and it ends up grepping through the logs. You both wonder if there's customer impact.
There’s a simple rule: AI agents in the incident loop are only as good as the signal you feed them. And logs alone aren't a great signal.
Synthetic monitoring at least solves the impact question. When a check fails, something user-facing is broken. You know what broke, not why. OpenTelemetry traces have answered that why for a while, and Checkly supports them natively. But there was an unacceptable catch in the agentic world: a human still had to correlate the two by switching tabs, finding the right service, copying a trace ID, and walking the spans. By the time they had an answer, the next check had already run.
"We have a lot of traces collected, but people maybe don't know they exist… I think Checkly is a way to integrate traces into developers' workflow."
— Observability lead, leading public-safety tech company
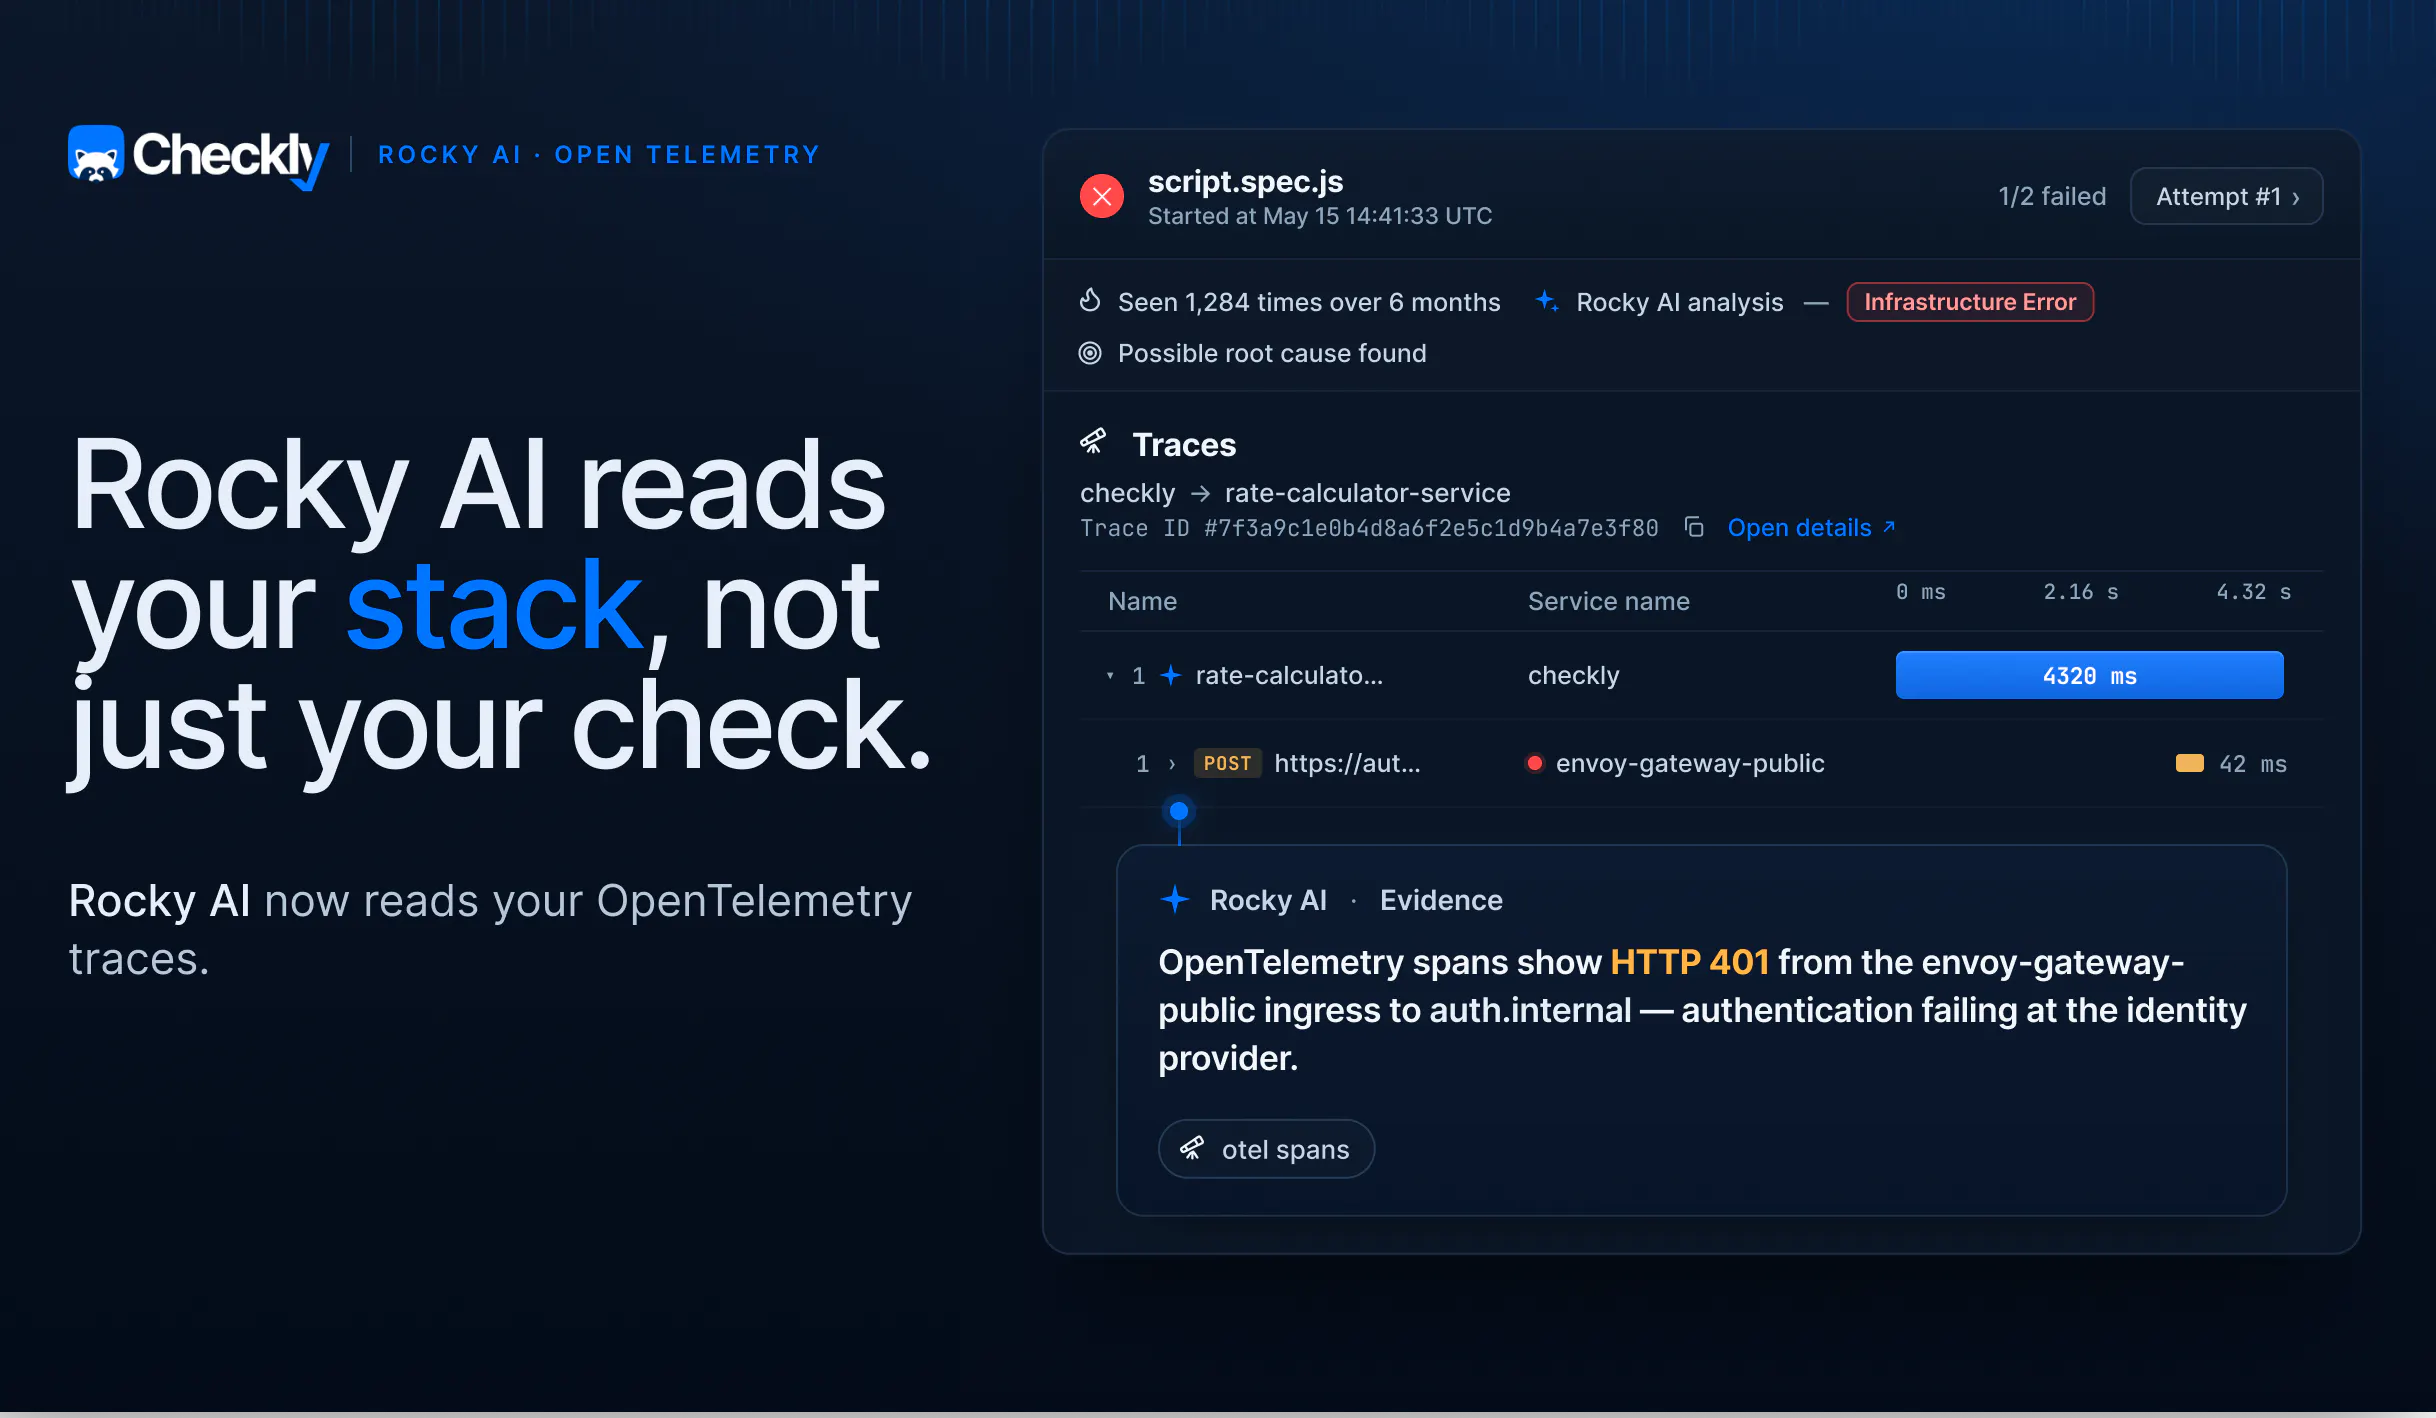
Rocky AI, Checkly's agent, now does that investigation walk for you. If a check fails, Rocky reads your OpenTelemetry traces and walks the spans behind the failure. When you're on call, "Where do I even start looking?" becomes "Let me validate my agent's fix!".
What Rocky AI reads, per check type
Good signal in, good answer out. So Rocky's context comes in three layers:
- The failure itself (whatever the check type produces: request, response, headers, traceroute, assertions, test source, etc.)
- A set of on-demand tools Rocky reaches for when the picture is incomplete (the last passing run, PCAP data for API checks, Playwright trace files for browser failures)
- Context provided by a human (the check description field, the tags, the "add context" box in the RCA UI)
OTEL traces are the newest tool in that on-demand layer.
What Rocky AI does with OTEL traces
Once you set up traces, every check Checkly runs injects a W3C traceparent header (tagged tracestate: checkly=true) on its outgoing requests. Your backend's OpenTelemetry instrumentation continues that same trace, so your spans share the trace ID Checkly generated. When those traces are sent back to Checkly, it stitches them to the originating check run by trace ID. That's what puts your backend traces right alongside a failing check, giving Rocky the evidence to pinpoint the root cause.
A 500 error on an API or Playwright check might trace back to a downstream identity provider returning DNS errors, a Clickhouse server timing out, or a third-party payment API throwing 502s through your load balancer. The same check failure could have countless reasons, different stories in the spans, and multiple teams that own the fix.

Rocky classifies (INFRASTRUCTURE_ERROR, DOWNSTREAM_DEPENDENCY), names the offending service, and writes a root cause, user impact, and suggested fix. It all lands in whatever alert channel you already use, Slack, PagerDuty, a webhook.
There's no separate add-on. If your traces are flowing into Checkly, Rocky reads them.
Remember the agent you tasked at the top of this post? The one grepping logs? It can read this analysis too.
The same root cause analysis, for your coding agent
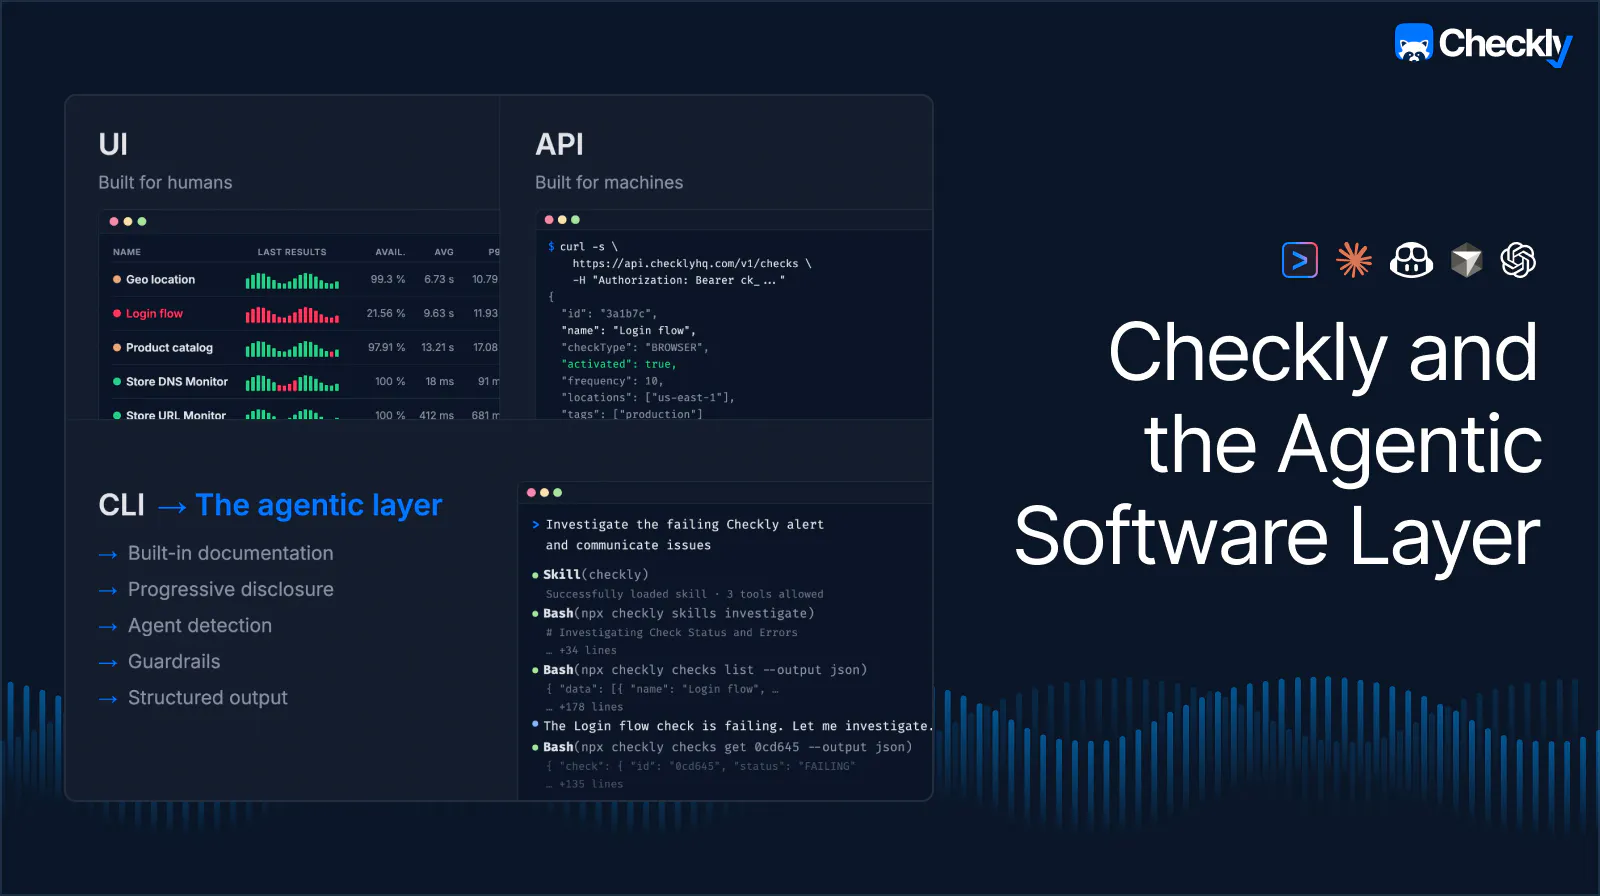
Rocky's analysis is also available via the Checkly CLI, and who loves using CLI tools? Your agent!
Make sure to install the Checkly skills, point your coding agent at a failing check, and ask it to investigate. It picks up the right CLI commands on its own and reads the same classification, root cause, user impact, and suggested fix. Including, when it's available, the OTEL trace Rocky walked.
That's the agentic layer in action. There's no magic. Just CLI commands and agents helping each other out with good signal. And what about you?
You don't need to post screenshots into Slack threads, or investigate by hand. You're only in charge of validating the fix! Welcome to the new world.
Wire up OTEL and inspect the why
If you're already on Checkly with OTEL flowing in, Rocky is already walking those traces. Enjoy! Open a failing check and read the analysis.
If you're not yet sending traces to Checkly, the setup docs get you there.
Without traces, Rocky's intelligence stops at the border of your app. With them, your check failures come with the why attached so you can stop hunting for it. And your agent will happily stop grepping logs. Win-win!