Checkly private locations enable you to run browser and API checks from within your own infrastructure. This requires one or more Checkly agents installed in your environment where they can reach your applications and our Checkly management API. You need to ensure you have enough agents installed in order to run the number of checks configured in the location. We have a guide to planning for redundancy and scaling in our documentation.
Manual performance tuning is a lot of work though, and presents some challenges. Quite often, developers are creating checks for their own applications while operations and DevOps are responsible for infrastructure such as a Checkly agent installation. How can you feel confident that as new checks are created, they’re not going to outpace your infrastructure?
Kubernetes (k8s) has become the de facto standard for container workload orchestration and scheduling and many of our users are using it. The Checkly agent has been designed from the ground up to accommodate k8s and other orchestration tools. The agent runs as a container and is stateless and ephemeral. You can create and destroy as many agent containers as you need to run your checks. All check configurations, details, and results are associated with the private location, not with any particular agent. This allows you to automatically scale the number of agents in your infrastructure as needed to run all of the checks defined by your developers without worrying about the location becoming overloaded.
First, let’s dive into the architecture of a private location and understand how this is made possible.
Private Location Architecture
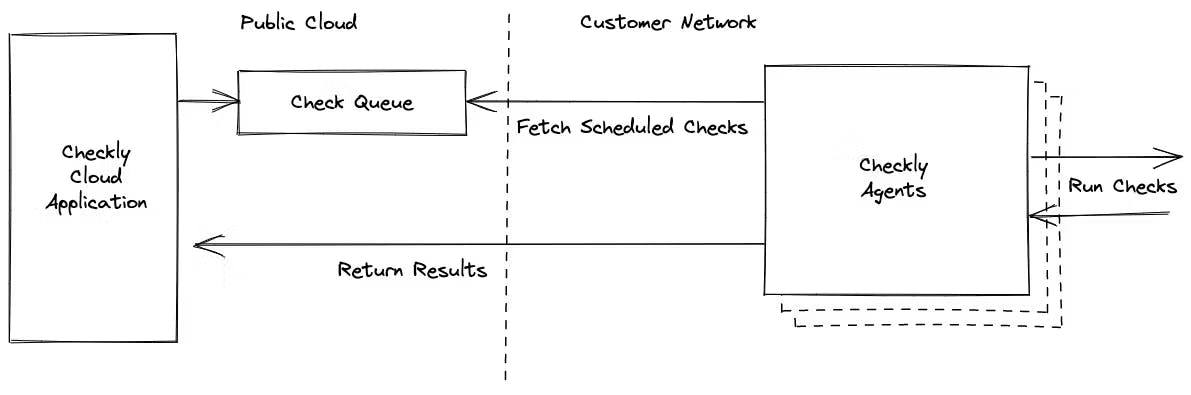
With Checkly, users interact with the public Checkly application which is hosted in the public cloud. All scheduling and management of checks, as well as check result details are stored in our systems. Checkly agents in private locations fetch scheduled checks, run them along with their associated setup and teardown scripts, and return the results to the Checkly application.
Checkly agents are stateless and ephemeral, so you can create and destroy agents as needed. We designed private locations to use a queue-based architecture specifically to enable this kind of flexibility and scalability.
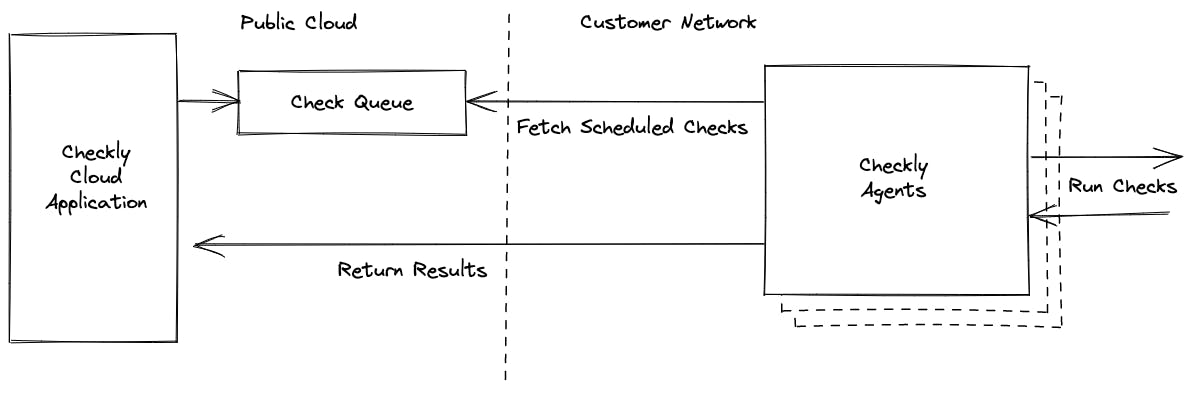
Now, let’s go through how to configure Checkly agent autoscaling in k8s.
Configuring Autoscaling
We recommend running the Checkly agent as a deployment when you install it in a Kubernetes cluster. k8s includes a useful feature called Horizontal Pod Autoscaling (HPA) that allows you to scale the number of running pods in a deployment based on some specified metric.
Checkly provides private location queue health metrics in our Prometheus integration. You can scrape these metrics into Prometheus in your own k8s cluster and use them to control scaling via Horizontal Pod Autoscaling. There are several ways to expose these external metrics to your k8s cluster for scaling, such as prometheus-adapter, but in this article we will use Kubernetes Event-Driven Autoscaling (KEDA). KEDA simplifies a lot of the work we need to do to get autoscaling up and running.
Prerequisites
- You need to have a Checkly private location defined and have an API key for that location handy
- You need the Checkly Prometheus integration enabled and have the URL and token handy
- You need a running Kubernetes cluster, any flavor will do, with a working
kubectl - You need the Helm CLI installed on your management host
We will walk through everything else you need in the rest of this article.
Optional
- You have a Prometheus instance running: we’ll walk through the installation of Prometheus briefly in this article but if you have an existing instance you just need to configure it to scrape the Checkly Prometheus endpoint
Installing Prometheus
For this example we will install kube-prometheus since it’s on of the easiest and fastest ways to get Prometheus up and running in a k8s cluster. If you have Prometheus already installed, just skip to the configuration of the Checkly Prometheus integration.
To get started, clone the kube-prometheus repository and switch to that directory:
git clone https://github.com/prometheus-operator/kube-prometheus
cd kube-prometheus/
Install the prerequisites. This will create a namespace called monitoring and install the CRDs for the monitoring components:
kubectl apply --server-side -f manifests/setup
Now install the remaining components:
kubectl apply -f manifests/
You will see the pods required start up and you should have a working Prometheus environment:
kubectl get pods -n monitoring
NAME                                  READY   STATUS    RESTARTS         AGE
alertmanager-main-0                   2/2     Running   18 (11h ago)     3d22h
alertmanager-main-1                   2/2     Running   25 (3h52m ago)   3d22h
alertmanager-main-2                   2/2     Running   9 (9h ago)       3d22h
blackbox-exporter-746c64fd88-n9lj9    3/3     Running   0                3d22h
grafana-55f8bc6d97-4x2q4              1/1     Running   0                3d22h
kube-state-metrics-6c8846558c-h7xhc   3/3     Running   0                3d22h
node-exporter-8hg9j                   2/2     Running   0                3d22h
prometheus-adapter-6455646bdc-57drk   1/1     Running   17 (15h ago)     3d22h
prometheus-adapter-6455646bdc-8l7xn   1/1     Running   18 (95m ago)     3d22h
prometheus-k8s-0                      2/2     Running   0                3d22h
prometheus-k8s-1                      2/2     Running   0                3d22h
prometheus-operator-f59c8b954-25lst   2/2     Running   0                3d22h
You will need to make the prometheus-k8s service accessible. You can do this by setting a LoadBalancer or NodePort on the service but the simplest temporary way is to use port forwarding:kubectl -n monitoring port-forward svc/prometheus-k8s 9090
You should now be able to access the Prometheus UI at http://localhost:9090.
Configuring Prometheus and Checkly Integration
The first step to configuring the Prometheus integration with Checkly is to enable the integration in the Checkly web app. Navigate to Integrations under account settings. Click the Create Prometheus endpoint button. This will enable the integration and you will see the URL and bearer token required to access the endpoint.
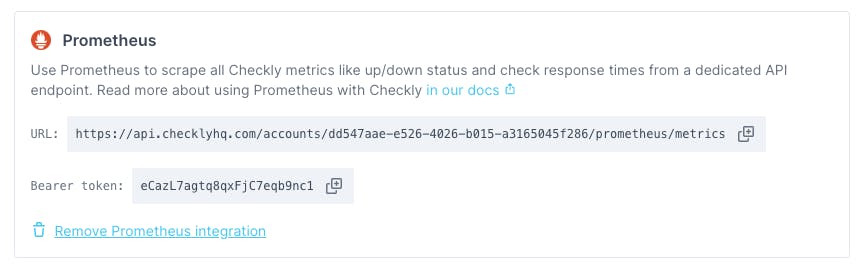
We can now configure a Prometheus job to scrape this endpoint. This is fairly straightforward in our example using kube-prometheus, but may differ for your Prometheus installation. First, create a yaml file called prometheus-additional.yaml with the following layout. Replace metrics_path and bearer_token with the appropriate entries from the Checkly web app above.
- job_name: 'checkly'
  scrape_interval: 30s
  metrics_path: '/accounts/dd547aae-e526-4026-b015-a3165045f286/prometheus/metrics'
  bearer_token: 'eCazL7agtq8qxFjC7eqb9nc1'
  scheme: https
  static_configs:
  - targets: ['api.checklyhq.com']
prometheus-additional.yaml
Transform this yaml file into a k8s secret and apply it to your cluster:
kubectl create secret generic additional-scrape-configs --from-file=prometheus-additional.yaml --dry-run -oyaml > additional-scrape-configs.yaml
kubectl apply -f additional-scrape-configs.yaml -n monitoring
Edit your Prometheus CRD to add the additional scrape configs:
kubectl edit prometheus -n monitoring
Add the three additionalScrapeConfigs lines shown here to the spec section:
apiVersion: monitoring.coreos.com/v1
kind: Prometheus
metadata:
  name: prometheus
  labels:
    prometheus: prometheus
spec:
  replicas: 2
  serviceAccountName: prometheus
  serviceMonitorSelector:
    matchLabels:
      team: frontend
  additionalScrapeConfigs:
    name: additional-scrape-configs
    key: prometheus-additional.yaml
kubectl edit prometheus -n monitoring
Once you save and close the Prometheus configuration, the changes will load automatically. If you navigate to Status -> Targets in your Prometheus UI you will now see the Checkly endpoint being scraped successfully.
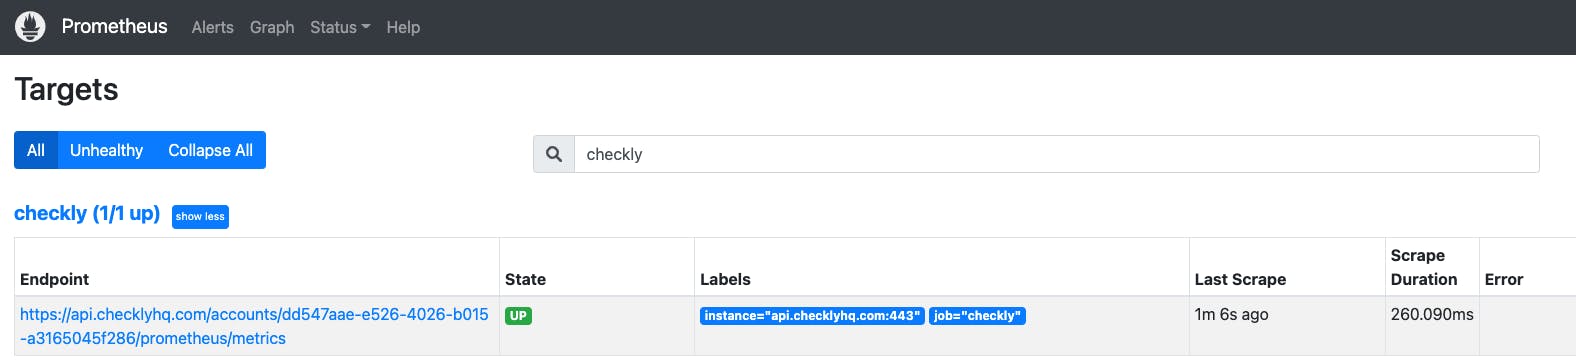
Searching Prometheus with the query {job="checkly"} (as defined in the scrape configuration) now shows the metrics that have been scraped from the Checkly endpoint. We will use these to control autoscaling behaviour.

Installing KEDA
As mentioned earlier, KEDA is the autoscaling component that we will use due to its simplicity and ease of use. In this example we will use Helm to install KEDA:
kubectl create ns keda

helm repo add kedacore https://kedacore.github.io/charts
helm repo update
helm upgrade --install keda kedacore/keda -n keda
KEDA should install and start up:
kubectl get pod -l app=keda-operator -n keda

NAME                             READY   STATUS    RESTARTS   AGE
keda-operator-7879dcd589-nvz7b   1/1     Running   0          42s
Installing the Checkly agent deployment
We now need to install the Checkly agent as a k8s deployment. You can use our sample manifests for this. You will need agentSecret.yaml and agentDeployment.yaml. Note: You only need to modify agentSecret.yaml to add the API key associated with your Checkly private location.
Create a Private Location over at https://app.checklyhq.com/private-locations and take a note of the following items:
- The private location ID. In the the example below
checkly-k8s - The API key.
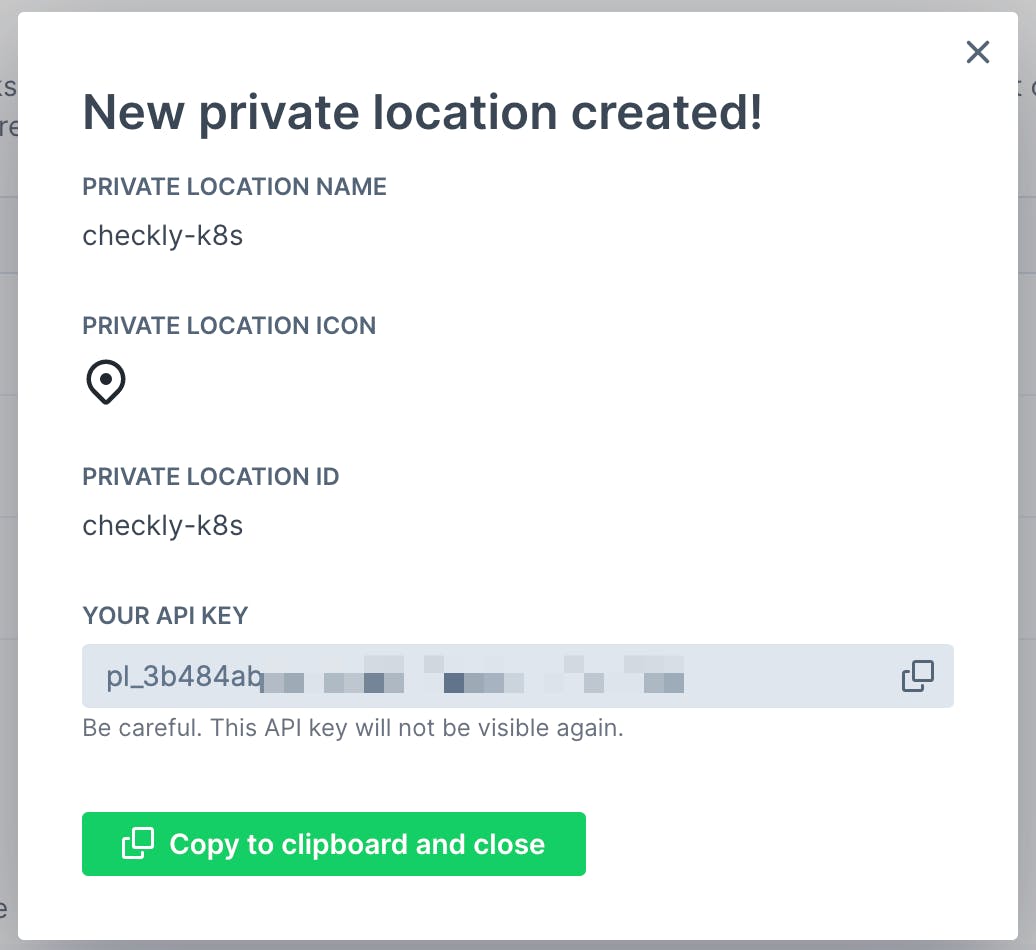
apiVersion: v1
kind: Secret
metadata:
  name: checklysecret
type: Opaque
stringData:
    API_KEY: "<key>"
agentSecret.yaml
apiVersion: apps/v1
kind: Deployment
metadata:
  name: checkly-agent
  labels:
    app: checkly-agent
spec:
  replicas: 2
  strategy:
    rollingUpdate:
      maxSurge: 3
      maxUnavailable: 1
  selector:
    matchLabels:
      app: checkly-agent
  template:
    metadata:
      labels:
        app: checkly-agent
    spec:
      containers:
        - name: checkly-agent
          image: ghcr.io/checkly/agent:latest
          env:
            - name: API_KEY
              valueFrom:
                secretKeyRef:
                  name: checklysecret
                  key: API_KEY
      terminationGracePeriodSeconds: 35
agentDeployment.yaml
Optionally, create a namespace for the Checkly agent. Apply the manifests above:
kubectl create ns checkly

kubectl apply -f agentSecret.yaml -n checkly
kubectl apply -f agentDeployment.yaml -n checkly
Two Checkly agent pods should start up and connect to the Checkly management API. This is a static configuration with two replicas, we will add autoscaling in the next steps.
kubectl get pods -n checkly

NAME                             READY   STATUS    RESTARTS   AGE
checkly-agent-674d56dc46-87hs2   1/1     Running   0          2m19s
checkly-agent-674d56dc46-stc2v   1/1     Running   0          2m19s
Configuring KEDA to automatically scale the Checkly agent
We can now create a KEDA ScaledObject to control scaling of the Checkly agent deployment. Create a checkly-autoscale.yaml file using the template below.
Make sure replace the <private_location_id> in the query section with the Private Location ID you created earlier.
apiVersion: keda.sh/v1alpha1
kind: ScaledObject
metadata:
  name: checkly-agent
spec:
  scaleTargetRef:
    kind:          Deployment     # Optional. Default: Deployment
    name:          checkly-agent  # Required. The name of the Checkly agent deployment.
  pollingInterval:  30            # Optional. Default: 30 seconds
  cooldownPeriod:   300           # Optional. Default: 300 seconds
  minReplicaCount:  2             # Optional. Default: 0
  maxReplicaCount:  10            # Optional. Default: 100
  triggers:
  - type: prometheus
    metadata:
      serverAddress: http://prometheus-k8s.monitoring.svc.cluster.local:9090
      metricName: checkly_private_location_oldest_scheduled_check_run
      threshold: '60'
      query: checkly_private_location_oldest_scheduled_check_run{private_location_slug_name="<private_location_id>"}
checkly-autoscale.yaml
There are a few key configuration entries that you need to be aware of. The most important is the trigger section. This sets the Prometheus metric that will control autoscaling.
- serverAddress: The example will be correct if you used the earlier instructions to install Prometheus with kube-prometheus. If you have a different Prometheus configuration then you will need to verify the server address.
- metricName: You can use either
checkly_private_location_oldest_scheduled_check_runorcheckly_private_location_queue_sizeas the metric on which you trigger autoscaling (or both). Checkly uses the oldest scheduled check run in our web UI to indicate queue health to users. - threshold: This is the threshold value that causes the autoscaling to trigger. If the metric is higher than the threshold, replicas will be created. Below the threshold and replicas will be deleted. For
checkly_private_location_oldest_scheduled_check_runwe recommend a threshold of 60. This means that if there are any checks queued for more than 60 seconds, new replicas will be added to process the checks. A similar result would come from acheckly_private_location_queue_sizethreshold of 2. - query: This is the exact Prometheus query that is used to get the metric for the threshold comparison. You need to add a label query to ensure you are getting the metric for the correct private location. We recommend using the Private Location ID as the
private_location_slug_namewhich is an immutable key created when the private location is first created. Renaming the private location will not change this label so it's the safest choice. - minReplicaCount and maxReplicaCount: These can be configured to suit your environment. You can get a good idea for the minimum value by following the redundancy and scaling section of the agent documentation. The maximum value should take the resource constraints of your k8s cluster into account so it does not become oversubscribed.
- pollingInterval and cooldownPeriod: These set the frequency on which scaling events are triggered. pollingInterval refers to how often KEDA checks the trigger metrics. cooldownPeriod controls how long after a scale up before a scale down event will occur. These generally only need to be changed if you notice some bouncing in the autoscaling activity.
Once you've created the yaml file with the appropriate values, you can apply it.
kubectl apply -f checkly-autoscale.yaml -n checkly
You can now see the Horizontal Pod Autoscaler (HPA) object created by KEDA:
kubectl get hpa -n checkly

NAME                     REFERENCE                  TARGETS           MINPODS   MAXPODS   REPLICAS   AGE
keda-hpa-checkly-agent   Deployment/checkly-agent   52715m/60 (avg)   2         10        7          59s
You can also see the actual autoscale actions being taken by the HPA object. In this case the Checkly agent deployment has been scaled up from its original statically defined 2 replicas to 7 automatically:
kubectl describe hpa keda-hpa-checkly-agent -n checkly

Warning: autoscaling/v2beta2 HorizontalPodAutoscaler is deprecated in v1.23+, unavailable in v1.26+; use autoscaling/v2 HorizontalPodAutoscaler
Name:                                                                                          keda-hpa-checkly-agent
Namespace:                                                                                     checkly
Labels:                                                                                        app.kubernetes.io/managed-by=keda-operator
                                                                                               app.kubernetes.io/name=keda-hpa-checkly-agent
                                                                                               app.kubernetes.io/part-of=checkly-agent
                                                                                               app.kubernetes.io/version=2.7.1
                                                                                               scaledobject.keda.sh/name=checkly-agent
Annotations:                                                                                   <none>
CreationTimestamp:                                                                             Tue, 14 Jun 2022 18:55:03 +0000
Reference:                                                                                     Deployment/checkly-agent
Metrics:                                                                                       ( current / target )
  "s0-prometheus-checkly_private_location_oldest_scheduled_check_run" (target average value):  38286m / 60
Min replicas:                                                                                  2
Max replicas:                                                                                  10
Deployment pods:                                                                               7 current / 7 desired
Conditions:
  Type            Status  Reason               Message
  ----            ------  ------               -------
  AbleToScale     True    ScaleDownStabilized  recent recommendations were higher than current one, applying the highest recent recommendation
  ScalingActive   True    ValidMetricFound     the HPA was able to successfully calculate a replica count from external metric s0-prometheus-checkly_private_location_oldest_scheduled_check_run(&LabelSelector{MatchLabels:map[string]string{scaledobject.keda.sh/name: checkly-agent,},MatchExpressions:[]LabelSelectorRequirement{},})
  ScalingLimited  False   DesiredWithinRange   the desired count is within the acceptable range
Events:
  Type    Reason             Age   From                       Message
  ----    ------             ----  ----                       -------
  Normal  SuccessfulRescale  39s   horizontal-pod-autoscaler  New size: 4; reason: external metric s0-prometheus-checkly_private_location_oldest_scheduled_check_run(&LabelSelector{MatchLabels:map[string]string{scaledobject.keda.sh/name: checkly-agent,},MatchExpressions:[]LabelSelectorRequirement{},}) above target
  Normal  SuccessfulRescale  24s   horizontal-pod-autoscaler  New size: 7; reason: external metric s0-prometheus-checkly_private_location_oldest_scheduled_check_run(&LabelSelector{MatchLabels:map[string]string{scaledobject.keda.sh/name: checkly-agent,},MatchExpressions:[]LabelSelectorRequirement{},}) above target
Summary
You should now have a working autoscaling configuration for the Checkly agents in your private location. This gives you a margin of safety if other users are creating new checks in that location, you don't need to worry if you have enough agent containers running. You can tweak the autoscaling configuration as needed to tune the environment but it shouldn't need too much additional work.