What Is Cloud Native Monitoring?
Cloud-native monitoring is all about keeping an eye on how well your cloud-based apps and services are doing. It's like having a health check-up for your digital operations, making sure everything runs smoothly and efficiently across distributed cloud systems.
The term ‘Cloud-Native Monitoring’ refers to the greater difficulty of truly monitoring and understanding large, complex architectures of microservices run in the cloud. The combination of highly distributed systems, with multiple teams responsible only for small pieces, and an infrastructure layer you don’t directly control can be a challenge to maintain. During an incident, it’s hard to answer basic questions like ‘what parts of the system aren’t working’ and ‘given current degradations, what user flows aren’t working?
Cloud-native monitoring helps businesses ensure their operations are smooth and efficient, even as their systems grow more complex and spread out. Most importantly, it secures the reliability of their apps and customer satisfaction, providing real-time alerts when something’s off.
Key Components of Cloud Native Monitoring
To understand cloud-native monitoring thoroughly, let’s take a look at the key components it encompasses.
Metrics
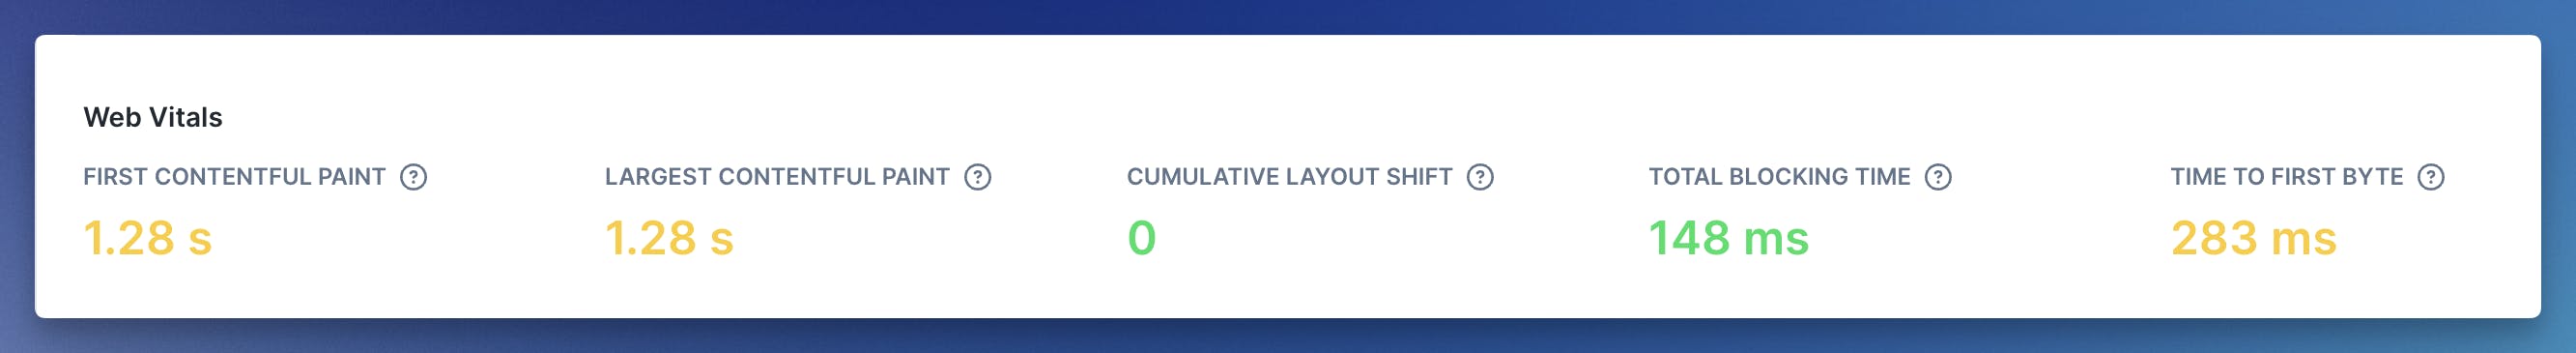
Metrics allow teams to quantify resource utilization, throughput, and the overall user experience, enabling data-driven decisions to optimize system performance and plan for future capacity needs. These could include CPU usage, web vitals, memory consumption, request latency, and many others.
Events
Events are significant occurrences within your cloud-native infrastructure and applications, signaling changes or updates in the system. They can range from deployments, scaling actions, and configuration changes to unexpected incidents. Monitoring these events is crucial for understanding the context behind performance metrics and system behavior, enabling teams to respond more effectively to the dynamic nature of cloud-native environments.
One example of an event might be when you deploy a new version of a service. Monitoring this event will help you correlate it with any subsequent changes in system performance or behavior, supporting you in faster troubleshooting and more informed decision-making.
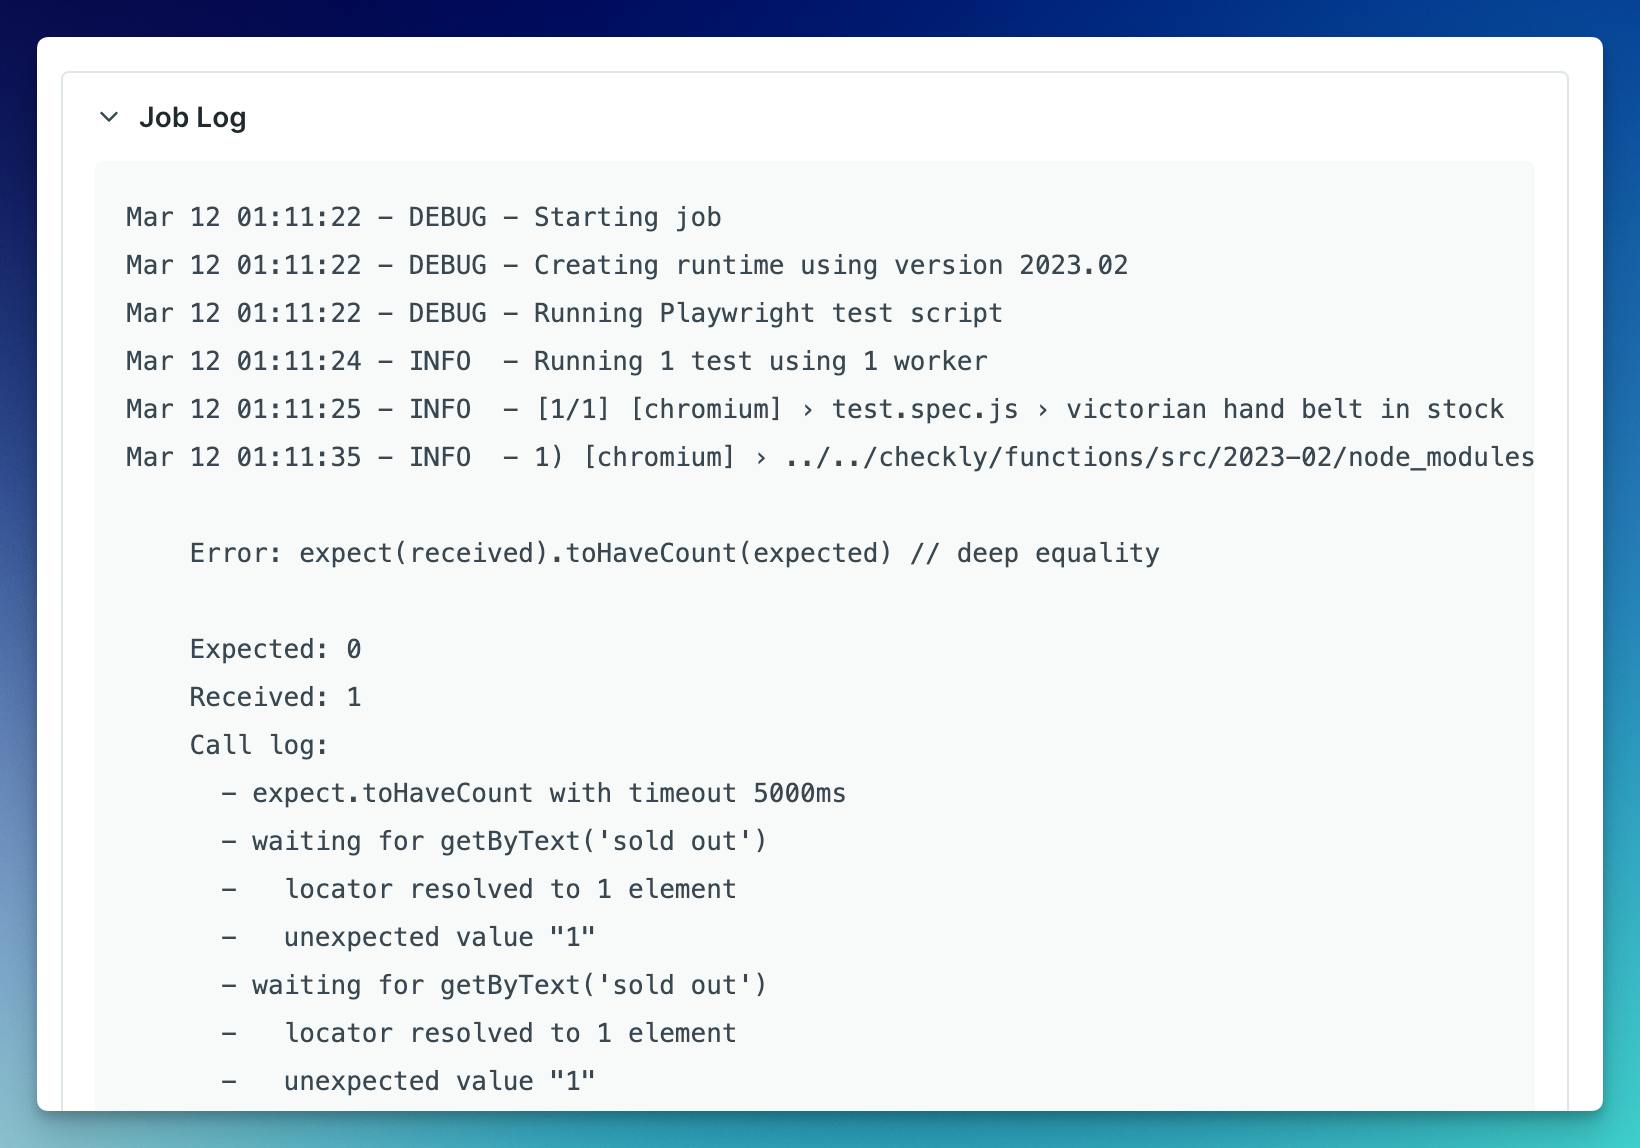
Logs
Logs are detailed records of events within your applications and infrastructure. Logs are crucial for debugging issues, understanding system behavior, and maintaining security.
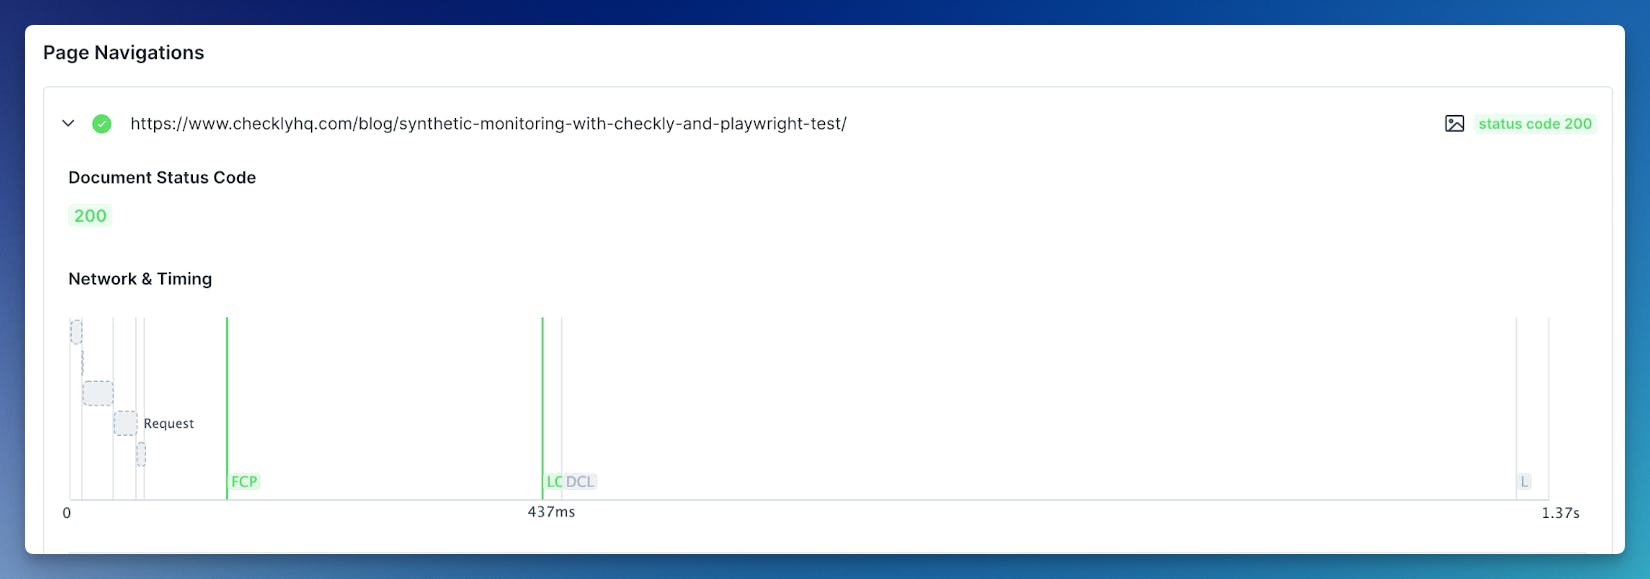
Tracing
When an error occurs, tracing uncovers the journey from the initial request to the error's emergence. By tracking the request's path, it's possible to determine the services it interacted with and pinpoint the likely root cause.
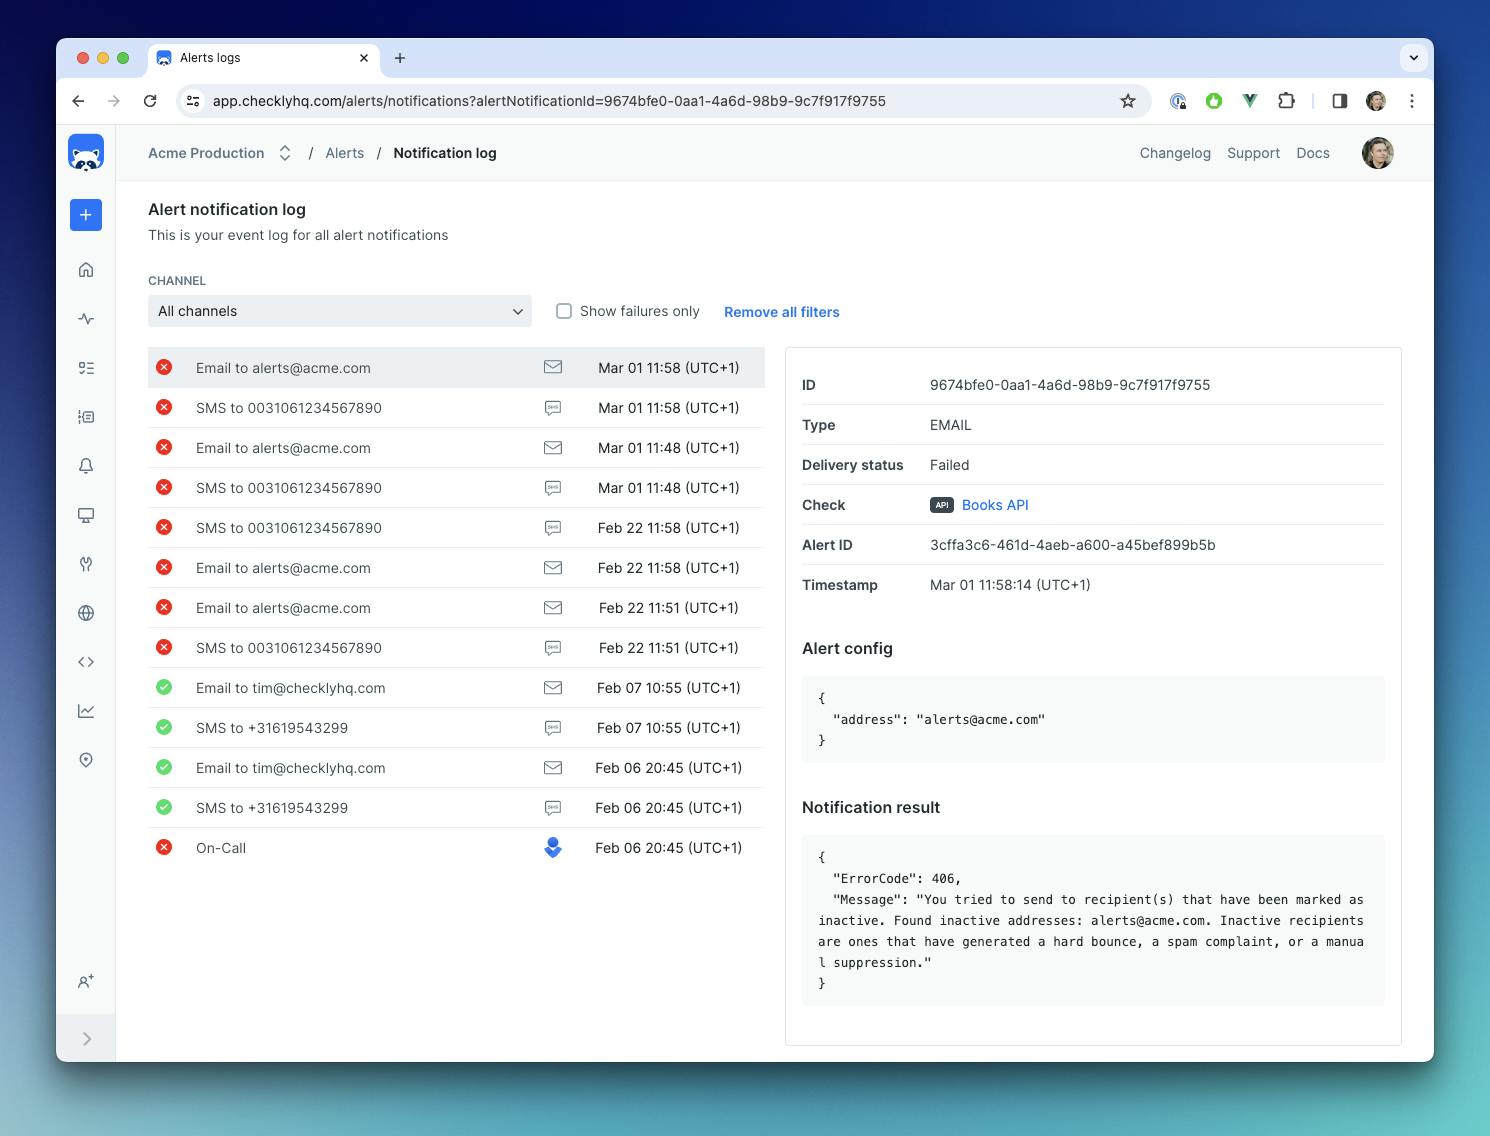
Alerting
Setting up automated alerts based on predefined thresholds or anomalies in metrics, logs, or traces is key to creating a vigilant monitoring system. This component ensures that teams are promptly notified of potential issues or performance degradation, allowing for quick response.
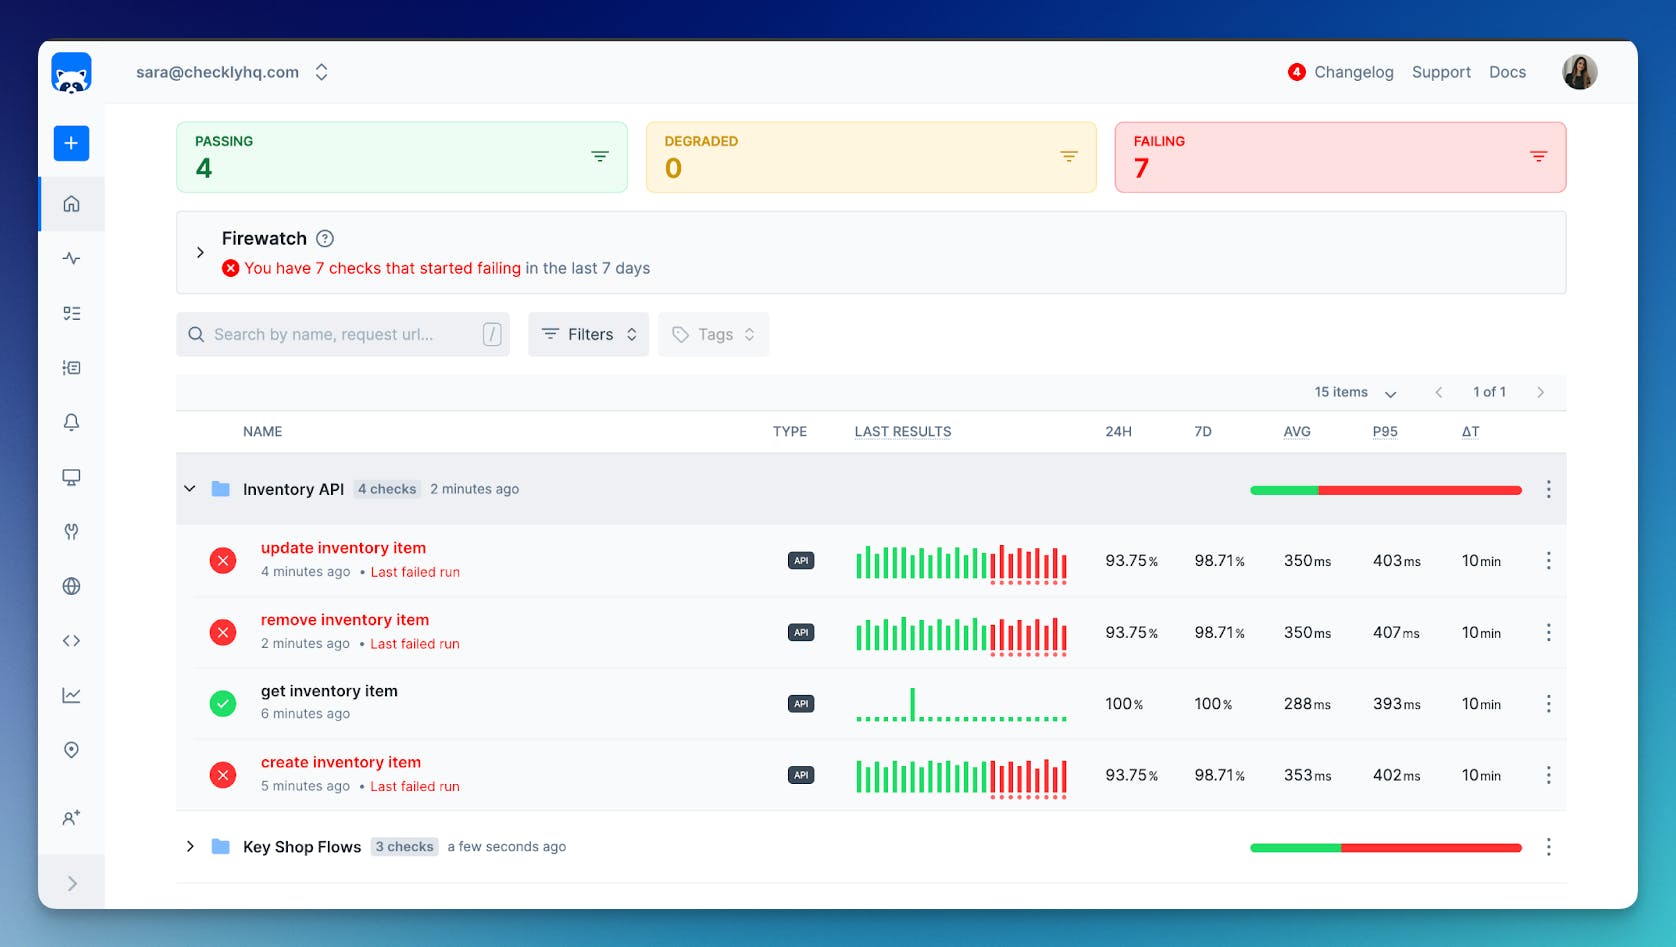
Checks
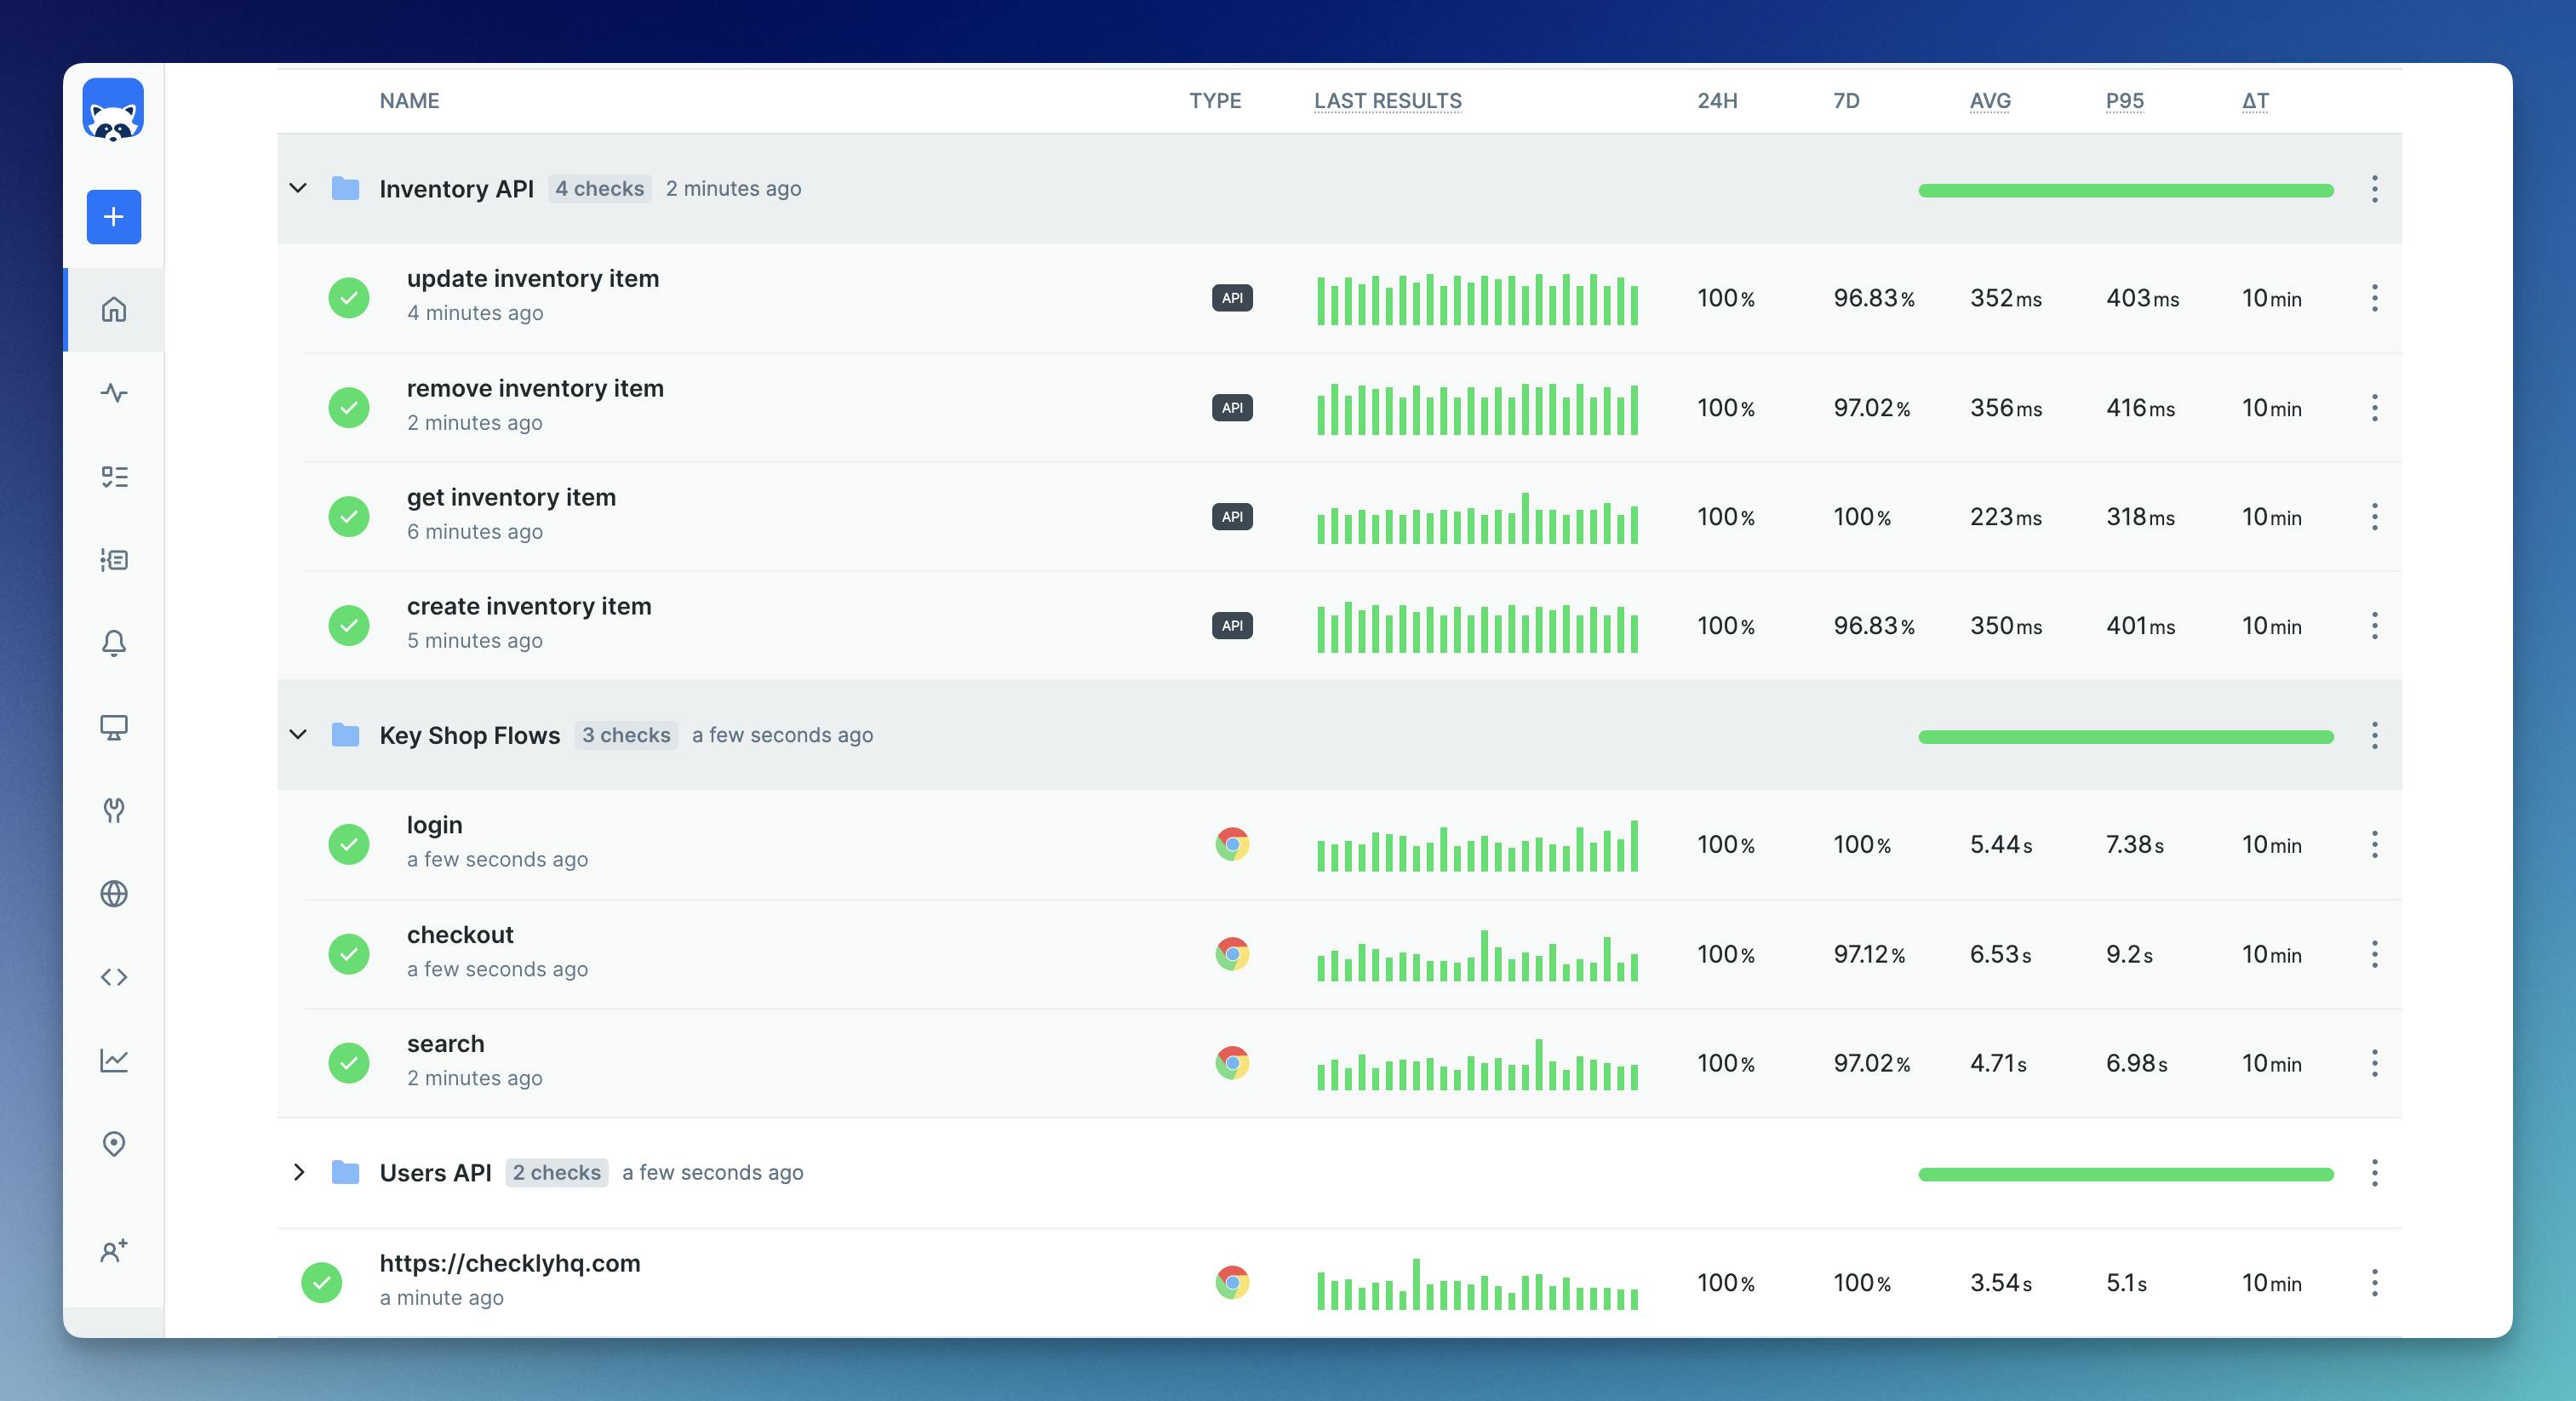
Automated checks continuously assess the availability and responsiveness of applications and services. Health checks help in ensuring that systems are operational and meeting performance expectations. With automated checks you could monitor APIs, entire user flows, or just chunks of them, services, etc. Here’s an example of some automated checks set up with Checkly:
| Component | Description |
Metrics | Data points that allow teams to quantify resource utilization, throughput, and the overall user experience. |
Events | Significant occurrences within your cloud-native infrastructure and applications, signaling changes or updates in the system. |
Logs | Detailed records of events within your applications and infrastructure. |
Traces | Records of the journey from the initial request to the error's emergence. |
Alerts | Automated notifications based on predefined thresholds or anomalies in metrics, logs, or traces. |
Checks | Automated monitors that assess the availability and responsiveness of applications and services. |
Automation | Integrating monitoring tools with the cloud-native ecosystem, including orchestration platforms, development tools, and incident management systems. |
Cloud Native Monitoring Challenges
Cloud-native monitoring introduces a number of challenges that you could come across. Let’s take a look at some of them:
1. Dynamic Scalability
Dynamic scalability allows cloud-native systems to automatically adjust their size and capacity to meet demand, but this rapid scaling poses a significant challenge for monitoring. As resources fluctuate, monitoring tools must quickly adapt to track new instances and services without missing a beat, ensuring accurate and comprehensive visibility at all times.
Consider an e-commerce platform during a flash sale, where the number of instances may double in minutes to handle traffic spikes. Monitoring tools must automatically recognize and track these new instances to ensure seamless performance visibility.
2. High Volume of Data
The sheer number of metrics, logs, and traces generated by cloud-native applications can be overwhelming. This data flood requires the use of advanced monitoring solutions capable of sorting through it all to find important signals amidst the noise, ensuring nothing critical gets missed.
For example, a cloud-based video streaming service might generate petabytes of logs every day. Sifting through this data to find actionable insights requires monitoring solutions capable of large-scale data aggregation and analysis.
3. Complexity of Microservices Architectures
Microservices architectures break applications into smaller, independent services, which increases the complexity of monitoring due to the sheer number of components and interactions. Figuring out where a problem starts might sometimes be like finding a needle in a haystack.
For instance, a mobile banking app uses dozens of microservices for various functions like user authentication, balance checks, and transaction processing. Identifying the root cause of a latency issue requires a robust monitoring solution that can trace interactions across all these services.
4. Visibility Across Diverse Environments
The challenge of visibility across diverse environments is about keeping track of how your cloud-native app is doing, even when it's spread across different places, like multiple cloud services or a mix of cloud and on-premises data centers. It's like trying to watch over a team that's split between different offices and remote locations; making sure you have a clear picture of everyone's work can be tricky. You need tools that can bring all this information together seamlessly, so you don't miss out on anything important happening in any part of your digital landscape.
Most multinational corporations run their applications across multiple cloud providers and its own data centers. Achieving consistent monitoring across these varied environments demands a solution that can integrate and present data cohesively, ensuring no part of the application's infrastructure is overlooked. A good monitoring solution should be able to cover all locations where the cloud-native app is present and alert you whenever one of them fails.
What Should Be Tracked in Cloud Native Monitoring?
Now, let’s take a look at some of the crucial aspects you should monitor if you have a cloud-native app.
Latency
Latency measures the time it takes for a request to travel from the client to the server and back again, essentially gauging the responsiveness of an application.
In cloud-native monitoring, keeping a close eye on latency helps ensure that users are experiencing fast and reliable service, identifying any delays that could frustrate users or signal deeper issues within the infrastructure. For instance, if a cloud-based data-sharing service experiences increased latency, users might face slow image loading times, leading to frustration and potentially driving them away.
Traffic
Traffic monitoring involves tracking the volume of data requests to your services, which can fluctuate significantly in cloud-native environments.
Understanding traffic patterns helps manage resource allocation to handle peaks efficiently and maintain application performance, especially during unexpected surges that could otherwise overwhelm systems. Consider an online ticketing platform during a major event sale; monitoring traffic ensures the system scales up resources to handle the influx of buyers without crashing.
Error Rate
The error rate is a critical metric that indicates the percentage of requests that result in errors, offering direct insight into the health and stability of applications.
Monitoring error rates allows teams to quickly detect and address issues, minimizing downtime and ensuring a smooth user experience by keeping error rates within acceptable thresholds. For example, a sudden spike in error rates for a cloud-based payment processing system could indicate a malfunctioning service, impacting transactions and customer trust.
Saturation
Saturation refers to how fully a resource, such as CPU, memory, or disk space, is utilized, indicating the capacity limits of your system.
Monitoring saturation levels is crucial in cloud-native environments to prevent resource exhaustion, which can lead to performance degradation or service outages. It ensures that there's always enough capacity to meet demand. An example would be a cloud-hosted video streaming service nearing its bandwidth capacity during a popular live event, risking service disruption if not addressed promptly.
| Name | Description |
Latency | The time it takes for a request to travel from the client to the server and back again. |
Traffic | The volume of data requests to your services. |
Error rate | The percentage of requests that result in errors. |
Saturation | The capacity limits of your system (how fully a resource is utilized). |
Benefits of Cloud-Native Monitoring
Let’s take a look at some of the benefits of cloud-native monitoring.
Application-Level Observability
Cloud-native monitoring provides deep insights into the behavior and performance of applications at a granular level. It allows teams to understand how different components of their application interact with each other and with the underlying infrastructure, facilitating a comprehensive view of the system's health and behavior.
This visibility is crucial for optimizing performance and ensuring reliability, offering a clear window into every aspect of the application's operation. For example, by utilizing cloud-native monitoring tools, an e-commerce company can track the performance of its product recommendation engine in real time, ensuring that customers receive personalized and accurate suggestions promptly, enhancing user experience and sales.
Strengthens Compliance and Security
Effective monitoring plays a pivotal role in maintaining compliance with regulatory standards and enhancing security posture. It enables the continuous tracking of system activities and configurations, helping to identify and remediate potential compliance issues or security threats swiftly.
This ongoing vigilance supports adherence to industry regulations and protects against data breaches or unauthorized access, especially in sectors handling sensitive data like healthcare.
A healthcare app leveraging cloud-native monitoring can ensure that patient data handling complies with HIPAA regulations by continuously auditing access logs and data encryption, quickly spotting and rectifying compliance gaps.
Enables Streamlined Debugging and Troubleshooting
Cloud-native monitoring simplifies the process of identifying and resolving issues within cloud-native applications. By providing detailed insights into the system's operations, including error logs, performance metrics, and user activity, developers and operations teams can quickly pinpoint the root cause of problems, reducing downtime and improving the overall quality of the service.
For example, when users report slow loading times on a video streaming service, cloud-native monitoring tools can help the technical team trace the issue to an overloaded database query, allowing for rapid adjustment and resolution. To take your monitoring to the next level, robust tools like Checkly have alerting systems optimized for speed and will catch your issues even before they get to your users.
Supports Meeting Service Level Objectives (SLOs)
Cloud-native monitoring plays a crucial role in ensuring that services meet or exceed their SLOs by providing real-time data on performance metrics and system health. SLOs are specific measurable characteristics of the service level agreements (SLAs), such as uptime, latency, and error rates, which are critical for ensuring customer satisfaction and trust.
Let's consider a cloud-native online video streaming service that has set a SLO for 99.9% uptime and a maximum load time of 2 seconds for video playback initiation. The monitoring system flags that video load times have breached the 2-second threshold in a particular region.
Thanks to automated alerts, the operations team is swiftly informed and pinpoints the issue to a lagging regional content delivery network (CDN). By rerouting traffic to a more efficient CDN, they quickly rectify the latency, keeping service performance within the set SLO and maintaining a seamless user experience. This scenario underscores the importance of cloud-native monitoring in not only detecting but also responding proactively to potential service disruptions, thereby upholding service quality and reliability.
Cloud-Native Monitoring Best Practices
Next, let’s take a closer look at some of the cloud-native monitoring best practices.
1. Automation
Automating the monitoring process in cloud-native environments not only streamlines the detection of issues but also enhances the capability to respond to them swiftly. This approach minimizes the risk of human error and ensures that potential problems are identified and addressed even outside of business hours.
Automation encompasses everything from the deployment of monitoring agents and the collection of metrics to the triggering of alerts and execution of predefined response actions, making it a cornerstone of efficient and effective cloud-native monitoring.
Checkly excels in this area by allowing users to automate end-to-end API and website monitoring. This automation ensures that any performance issues or downtime are immediately detected and reported, reducing manual monitoring efforts and enabling teams to focus on resolution and innovation.
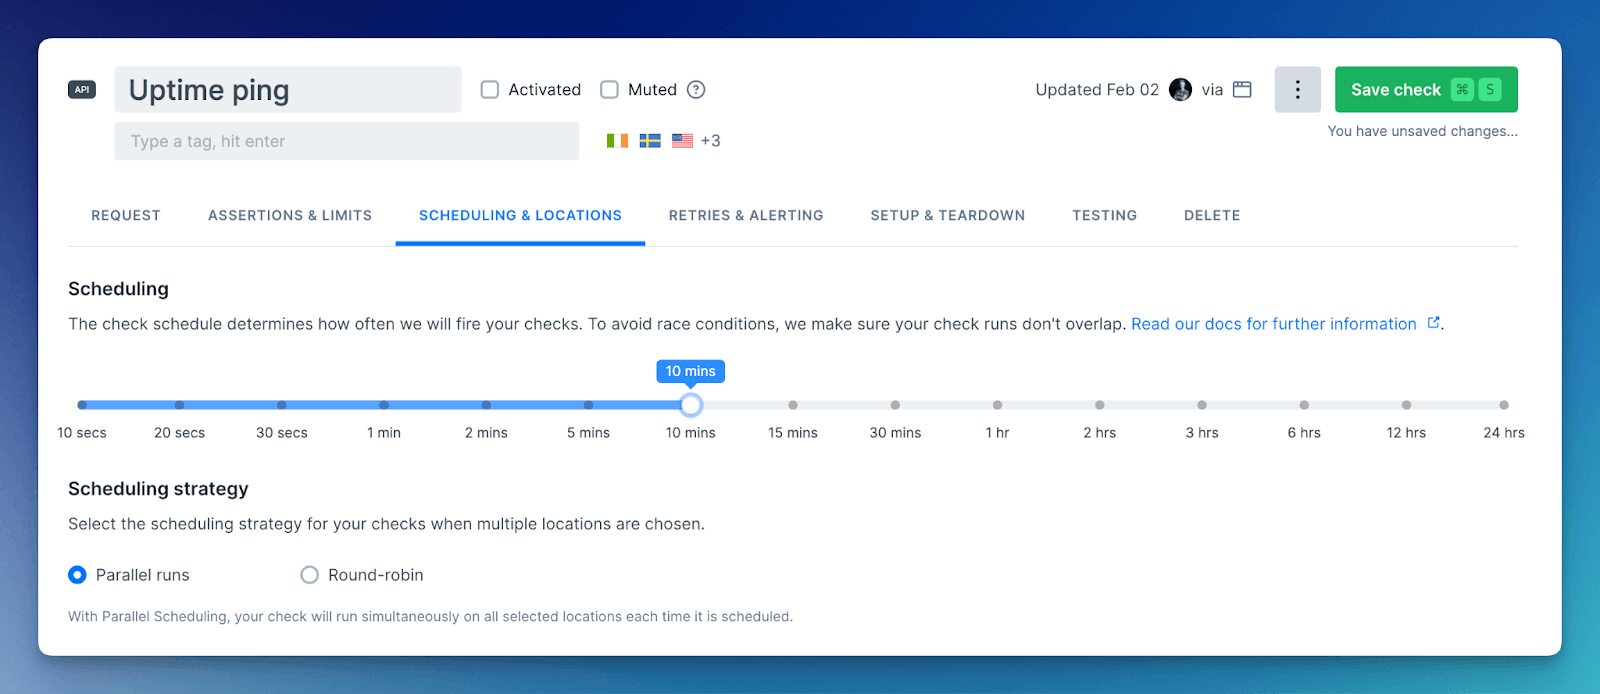
For example, with Checkly, you can set up your checks to automatically examine your application's API endpoints every 10 minutes, ensuring continuous monitoring without manual intervention. This approach catches a critical API response failure in the early seconds, triggering an alert that prompts immediate action before most users are affected.
2. Tracing
Understanding how requests flow through the system is crucial for pinpointing issues. Tracing provides this insight by tracking the journey of requests across all the services involved, from entry to exit. This visibility is invaluable for diagnosing latency issues, identifying errors, and understanding the interdependencies within cloud-native architectures, ultimately leading to more reliable and performant applications.
3. Correct Configuration and Prioritization of Alerts
Monitoring systems could overwhelm teams with noise when they alert equally about all issues. Correctly configuring alerts to ensure they are meaningful and actionable, and prioritizing them based on severity, impact, and urgency, helps teams focus on what matters most.
Checkly enables precise customization and prioritization of alerts, allowing teams to focus on the most urgent issues based on their potential impact on the system and user experience. This approach ensures that critical alerts are acted upon promptly, while less urgent notifications can be addressed at a later point.
For example, an online retail platform uses Checkly to create tiered alerts for their checkout process, with critical errors like payment failures triggering immediate alerts to senior developers, while minor issues queue for regular review, ensuring rapid response to business-critical problems.
4. Specialized Dashboards
Specialized dashboards offer tailored views of monitoring data, making it easier for teams to quickly assess the health and performance of specific aspects of their cloud-native applications or infrastructure.
With Checkly, teams can create custom dashboards that focus on key metrics such as API response times and success rates of web checks. This customization ensures that the most relevant and actionable insights are front and center, aiding in rapid decision-making and problem resolution.
What to Look for in a Cloud-Native Monitoring Platform?
When choosing a cloud-native monitoring platform, it's essential to pick one that not only matches your current needs but also scales with your growth and adapts to the new trends in cloud-native monitoring. Here are key features and capabilities to look for:
Helps in Decision-Making Across Hybrid Systems
A cloud-native monitoring platform should provide comprehensive insights that facilitate decision-making across hybrid systems, which often comprise a mix of cloud environments and on-premises data centers. This capability ensures that you can maintain visibility and control over your applications and services, regardless of where they are hosted, helping to optimize performance, cost, and resource allocation across your entire infrastructure.
Checkly provides the insights necessary to make informed decisions regarding resource allocation, performance optimization, and cost management. Its ability to monitor APIs and web applications across diverse environments supports a unified view of system health, aiding strategic planning and operational adjustments.
Assistance in Large-Scale Investigations
The ability to efficiently navigate and analyze large volumes of monitoring data is crucial for identifying and resolving issues in cloud-native architectures. Look for a platform that supports large-scale investigations with features like advanced querying, data aggregation, and filtering. These tools can significantly speed up the process of diagnosing problems, especially in complex environments where pinpointing the root cause requires sifting through immense datasets.
It’s also important that the data and dashboards are available to as many team members as possible. If your monitoring tool has restrictive seat licensing or requires all users to master a query language to get any answers, it’s unlikely that everyone who needs information can get it during a larger investigation.
With Checkly, teams can leverage detailed logs and metrics for large-scale investigations into application behavior and performance issues. Checkly's dashboards and alerting system help sift through data to identify anomalies or trends, making it easier to diagnose and resolve complex issues in vast and intricate cloud-native landscapes.
Integration with Orchestration and Automation Tools
Integration with orchestration and automation tools is a must-have feature for any cloud-native monitoring platform. Such integrations allow for seamless operation within the dynamic and scalable nature of cloud-native environments. They enable automatic scaling, self-healing, and other intelligent responses to changes in the monitored environment, enhancing both operational efficiency and system reliability.
Checkly integrates smoothly with popular CI/CD pipelines and orchestration platforms, facilitating automated deployment and management of monitoring checks as part of the software development lifecycle. These integrations enhance operational efficiency and ensure that monitoring strategies evolve in lockstep with application development and deployment processes.
Easy Implementation Into Your Existing Workflow
Ease of implementation is another critical factor to consider. A cloud-native monitoring solution should be straightforward to deploy and configure, minimizing the time and effort required to get it up and running. Look for solutions that offer intuitive interfaces, clear documentation, and robust support to ensure a smooth setup process. This ease of use extends to the day-to-day management of the platform, ensuring that teams can quickly adapt monitoring strategies as their systems evolve.
Checkly enhances the ease of implementation through its CLI. The CLI enables engineers to efficiently manage their monitoring configurations and automate the deployment of checks directly from their terminal.
Moreover, with Checkly, you’re doing pure synthetic monitoring done from outside your service: there are no agents to install and no need to modify your application code.
This setup process makes it straightforward for teams to incorporate Checkly into their development and operational processes. This simplicity ensures that organizations can rapidly take advantage of Checkly's comprehensive monitoring capabilities, reducing the time to deploy and maximizing the impact of their monitoring strategy.
Compatibility With Your DevOps Culture
A cloud-native monitoring platform should align with your organization's DevOps culture, emphasizing collaboration, automation, and continuous improvement. A key aspect of this is supporting a Monitoring as Code (MaC) workflow, which integrates monitoring configurations into version control systems alongside application code. This approach fosters collaboration between development and operations teams, ensures consistency across environments, and facilitates rapid deployment and iteration of monitoring configurations.
Checkly inherently supports DevOps practices through its Monitoring as Code approach. By allowing teams to define and version-control their monitoring configurations, Checkly ensures that monitoring setup and adjustments are as agile and reproducible as the application development process itself. This compatibility with the DevOps culture streamlines workflows, enhances collaboration and ultimately leads to more reliable and high-quality software delivery.
Accurate and Reliable Alerts
For cloud-native monitoring to be effective, it must provide accurate and reliable alerts that can distinguish between genuine issues and noise, thereby minimizing false positives. A platform that excels in delivering precise alerts ensures that teams can trust the notifications they receive, focusing their efforts on addressing real problems rather than chasing down erroneous alerts.
Checkly stands out for its robust alerting capabilities, designed to cut through the noise and significantly reduce false positives. By offering fine-grained control over alert thresholds and conditions, Checkly enables teams to tailor their alerting criteria to match their specific needs and sensitivity levels. This precision, combined with Checkly's integration with leading communication and incident management tools, ensures that the right people are notified about the right issues at the right time, fostering a proactive and responsive monitoring strategy.
Selecting a cloud-native monitoring platform that excels in these areas will equip your team with the tools necessary to effectively oversee and optimize your cloud-native applications and services, ensuring they deliver the performance, reliability, and user experience your business demands.
Cloud Native Monitoring with Checkly
Checkly offers a suite of features tailored for the unique demands of cloud-native monitoring, combining ease of use with deep technical capabilities. Here are some of the most important features and their benefits:
End-to-End API & Browser Monitoring
Checkly enables comprehensive API and browser monitoring, allowing teams to check the performance and availability of their web applications and services in real time. This ensures that any user experience issues can be quickly identified and resolved, maintaining high service quality and reliability. Here's an example of Checkky's dashboard, showing different user flows and APIs being monitored:
Proactive Monitoring
With proactive monitoring, Checkly proactively checks the health of applications by simulating user interactions or API calls. This approach helps in identifying problems before they impact users, ensuring that potential issues are caught and addressed early, thus enhancing the overall user experience.
Monitoring as Code (MaC)
Checkly supports Monitoring as Code, enabling teams to define their monitoring setup using code, which can be version-controlled alongside application code. This integration with DevOps workflows ensures that changes in application infrastructure are automatically reflected in the monitoring setup, maintaining alignment between development, operations, and monitoring practices.
Monitoring Testing and Staging Environments
This is something that often gets overlooked. The reason for this is most commonly tied to the fact that they are a lot bigger than production environments, which makes them very costly to monitor under typical observability tool pricing models. This financial hurdle leads many organizations to take the calculated risk of either not monitoring these critical stages or doing so very sparingly, potentially missing early detection of issues that could impact production.
However, Checkly's Monitoring as Code (MaC) approach aligns seamlessly with the ethos of "monitor everything at all stages," offering a cost-effective solution. By integrating monitoring configurations directly into version control alongside application code, Checkly enables teams to extend robust monitoring to every phase of development, from testing to staging to production, without breaking the bank. This approach not only fosters a culture of early detection and resolution of issues but also ensures a smoother transition to production, reinforcing the overall reliability and quality of cloud-native applications.
Integration with CI/CD Pipelines
Checkly integrates seamlessly with CI/CD pipelines, allowing for the automated deployment of monitoring checks as part of the software development lifecycle. This ensures that new features and changes are monitored from the moment they are deployed, facilitating a continuous monitoring approach that keeps pace with rapid development cycles.
Reporting and Dashboards
Checkly provides detailed reporting and customizable dashboards, offering insights into application performance, uptime, and the results of monitoring checks. These visualizations make it easy for teams to assess the health of their applications at a glance and to drill down into specific issues for further analysis.
Global Locations
To ensure a realistic user experience assessment from different geographic regions, Checkly allows teams to run tests from multiple global locations. This feature is particularly beneficial for cloud-native applications with a global user base, as it helps in optimizing performance and availability across diverse locations.

Alerting and Notifications
Checkly's advanced alerting and notification system cuts through the noise to deliver meaningful alerts about issues that genuinely require attention. This reduces alert fatigue and ensures that teams can focus on resolving high-priority issues promptly, maintaining the integrity and performance of cloud-native applications.
By leveraging these features, Checkly provides a powerful, flexible, and user-friendly platform for cloud-native monitoring, helping teams to ensure their applications are performant, reliable, and delivering a great user experience.
Conclusion
Getting cloud-native monitoring right is key to keeping your cloud-based apps running smoothly and your users happy. We've touched on the hurdles you might face, shared some top tips for effective monitoring, and highlighted what to look out for in a great tool.
Checkly stands out as your code-first partner for this journey, making sure you're the first to know when something's off. It's about making your life easier and letting you focus on what you do best. So, with the right approach and Checkly by your side, you're well on your way to nailing cloud-native monitoring and keeping those digital wheels turning smoothly.