A web application or an API breaking is a matter of when, not if. Whether the cause is buggy code making it to production or infrastructure failing to support the software built upon it, incidents of varying severity are the norm rather than the exception, appearing frequently enough that the industry has coined the terms Mean Time To Detect (MTTD) and Mean Time To Recovery (MTTR). In this article I argue why organizations should be looking at monitoring as code (MaC) as the key to achieving great MTTD and MTTR numbers.
MTTD and MTTR Explained
So what exactly are MTTD and MTTR?
Let’s start by diving into MTTD and providing a bit more detail. MTTD is a key performance indicator in incident management, and measures the average time it takes from when an incident begins to when the incident is detected by a member of the organization. The MTTD for a given timespan is calculated by taking the sum of the time it took to detect the incidents and dividing it by the number of said incidents.
MTTR is the average time it takes to recover from an incident. MTTR includes the full length of time that the system failure was in effect, spanning the period between when the incident was first identified and how long it took for the impacted system to become operational again. MTTR is calculated by dividing the total time spent addressing failures in a given timeframe by the number of said failures.
Organizations struggling with high MTTD and MTTR often look at synthetics to bring these metrics back under control. Synthetic monitoring is all about proactively “exercising” key user flows and endpoints to detect issues, from performance degradations to full blown downtime, as early as possible, ideally even before the end user of the system being monitored is affected.
Once the “detection” part has been taken care of, we still need to dive in to resolve the issue (this is the MTTR bit). The actual recovery process is going to look different depending on the affected system and the type of incident, but where synthetic monitoring can move the needle is in surfacing the right information needed to point the incident response team in the right direction without wasting any time.
Getting the basics of synthetics right
You won’t be surprised to hear that running synthetic checks does not automatically guarantee a significant edge in achieving acceptable MTTD and MTTR. As always, the devil is in the details. Let’s go through those details, starting with the obvious basic requirements for successful synthetics (we’ll take a look at the less obvious further in the article):
- Checks need to be (highly) programmable
- Checks need to be (extremely) reliable
- (Some) checks need to run at high frequency
- Alerting must be (highly) configurable
Highly programmable checks
First off, synthetic checks need to mimic your actual business critical user flows as close as possible. This means a solid browser automation toolkit enabling both run-of-the-mill UI interactions and more complex lower level operations, as well as tools to develop and maintain flexible API checks with great assertion capabilities.
For example: API flows very rarely can be monitored in a vacuum. Authentication is often something we need to take care of before a large part of a target API can be accessed. As such, a flexible way to chain API calls, together with the possibility to elaborate and/or clean test data, should be considered a minimum requirement for monitoring scenarios. Complex assertions also help us establish clear expectations around correctness and performance.
Extremely reliable checks
Our checks run against production and will alert engineers on failure, whenever that failure takes place - be that during business hours or in the middle of the night. For this reason they need to run reliably, with the goal being to get rid of false positives entirely. Modern automation tools make this a possibility for the wide majority of systems.
The issue of false positives, in monitoring just as in testing, is often underestimated until it is too late. As engineers, we’re almost always under intense pressure to deliver and have little time to waste on check failures that don’t map to an actual issue with the system we’re overseeing. After being paged needlessly more than a few times, the obvious response is to accept that the check(s) can’t be trusted and the alerts they send out should just be ignored. This lack of trust in the results our monitoring system provides pretty much defeats the whole purpose of synthetic monitoring.
Support for high frequency checks
Our checks’ job is essentially to give us insight into the state of the target system at a given point in time. The frequency at which we run our checks determines how often we're getting a “reading” from the target system. A lower check frequency will translate into an increased probability that any issues (potentially critical ones) will go undetected for a longer period of time, by definition increasing the MTTD for the service being monitored.
So how often should we run our checks? We don’t need to schedule checks to run every second, which consumes additional system resources, could increase monitoring costs, and is generally unneeded in most synthetic monitoring situations. The best approach is to determine the check frequency based on some simple criteria: Is the flow we’re monitoring a critical one, like a user login or checking out of an ecommerce shop? Or is it a less critical path, like users navigating to your terms, privacy, and conditions pages? (You can use the same criteria when looking at API endpoints and their downstream dependencies.)
In the first example, a check every minute might be reasonable, while for the second example maybe an hour (or longer) would be appropriate. Asking ourselves this question: “How long can I be unaware that this user flow is broken?” will help guide your decision-making when it comes to determining an ideal check frequency.
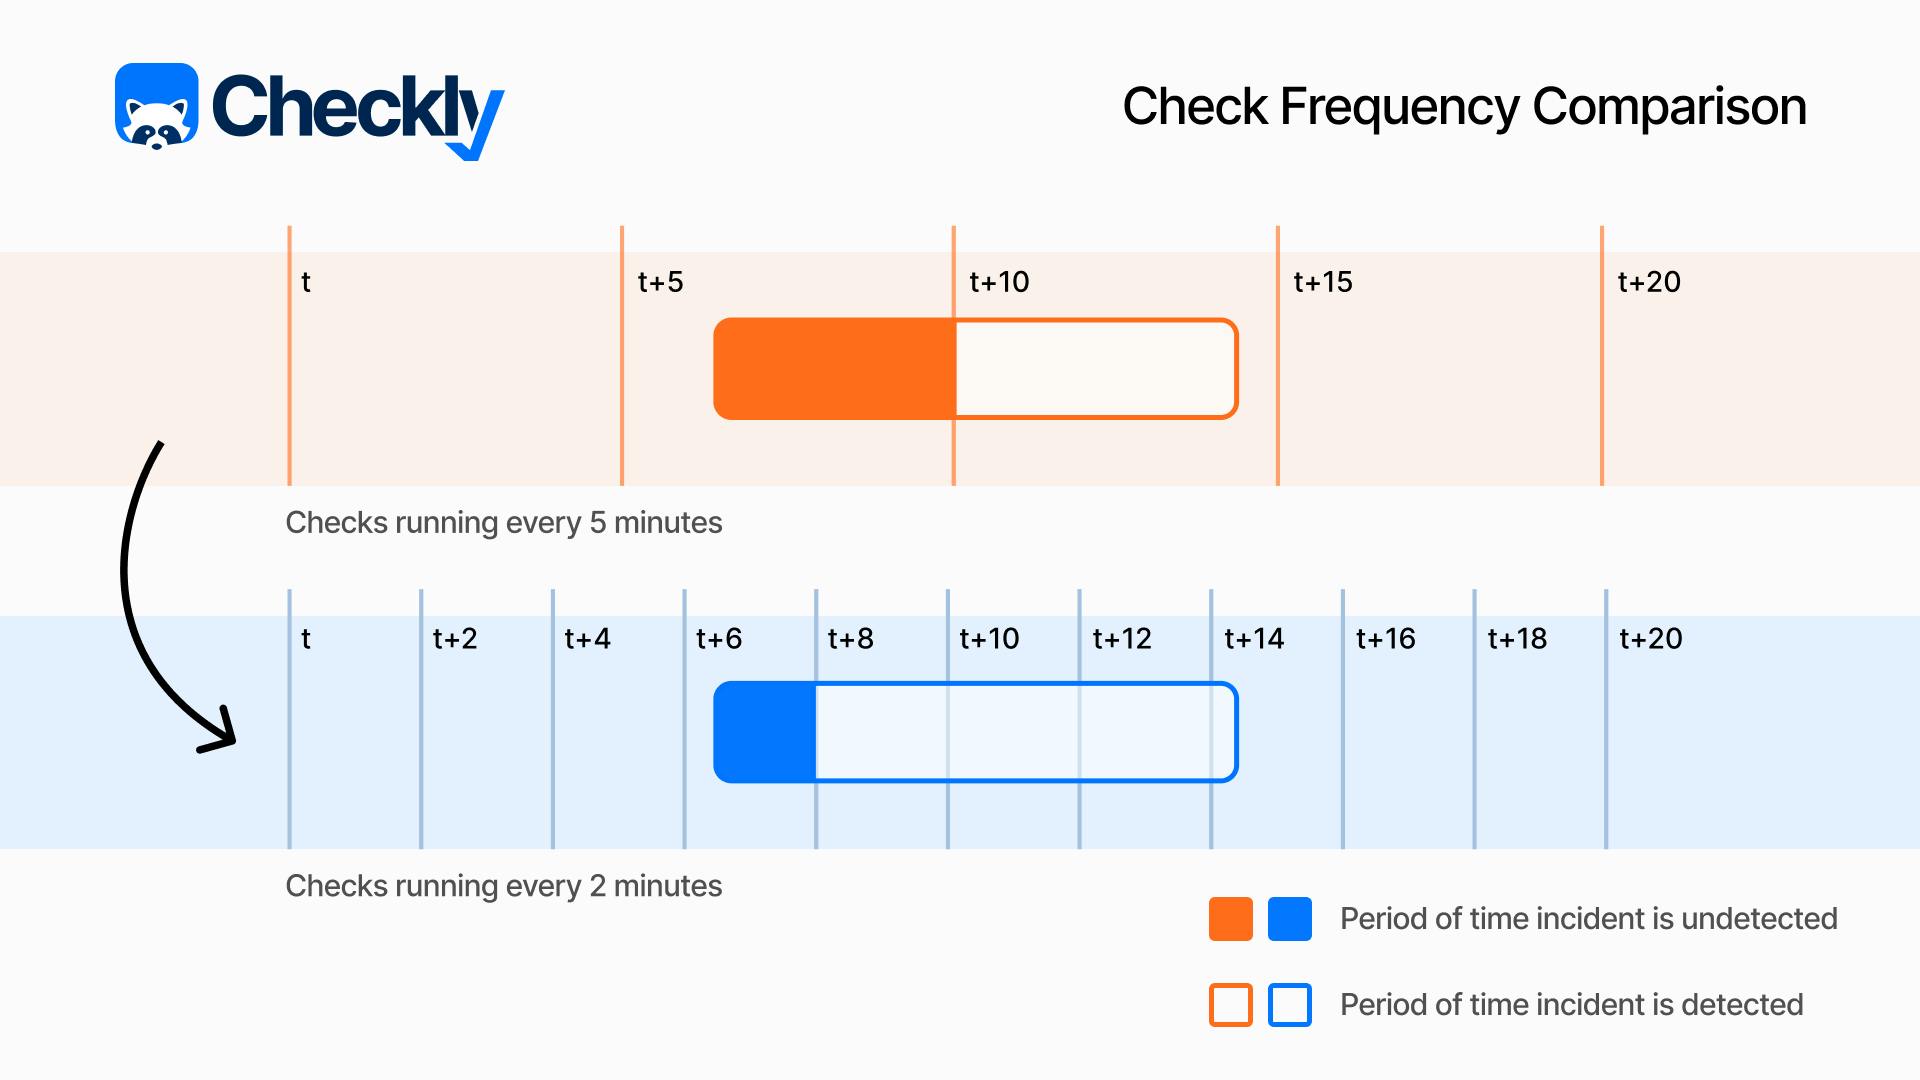
If that is still too abstract, you can look at it this way: if you are running a check every 10 minutes, on average you will catch an incident five minutes in - is that acceptable, or should you run at higher frequency? Even considering instant recovery upon detection (keep in mind that this is very far from reality - MTTR is normally measured in hours), what does it mean for our availability to have a 5-minute TTD happening ten times per month? That would amount to 50 minutes of our service being unavailable, which is already below the 99.9% figure. That is a bad start already.
Configurable alerting and in-depth reports
Once an issue has been detected, alerting needs to happen instantly and according to a system that fits the custom workflow of those looking after the affected system. This is not a nice-to-have, but rather something transformative: if our goal is to enable developers to own the monitoring of the systems they build, we need to have the alerting work for them in their current toolchain and within the workflow they use to build those systems in the first place.
Different engineer personas (think developers, SREs, DevOps and platform engineers) will use different tools to handle alerting at different priority levels, and will want different information to reach them as soon as they are paged or otherwise contacted.
This means that aside from supporting integration with established alerting solutions, another key requirement is a degree of customization to allow end-users of those channels to select the priority information they want to receive when an alert is sent out. The goal is to minimize wasted time looking for assets and information when every minute is critical.
Once the engineers who have the right access and information about the affected system are on point, they need quality information fast. They need to be able to quickly understand when things started going wrong, and what precisely happened. Time-travel debugging on key user flows and granular API reports need to be available and easily explorable. Once all the key information has been processed by the incident team, actual recovery can start.
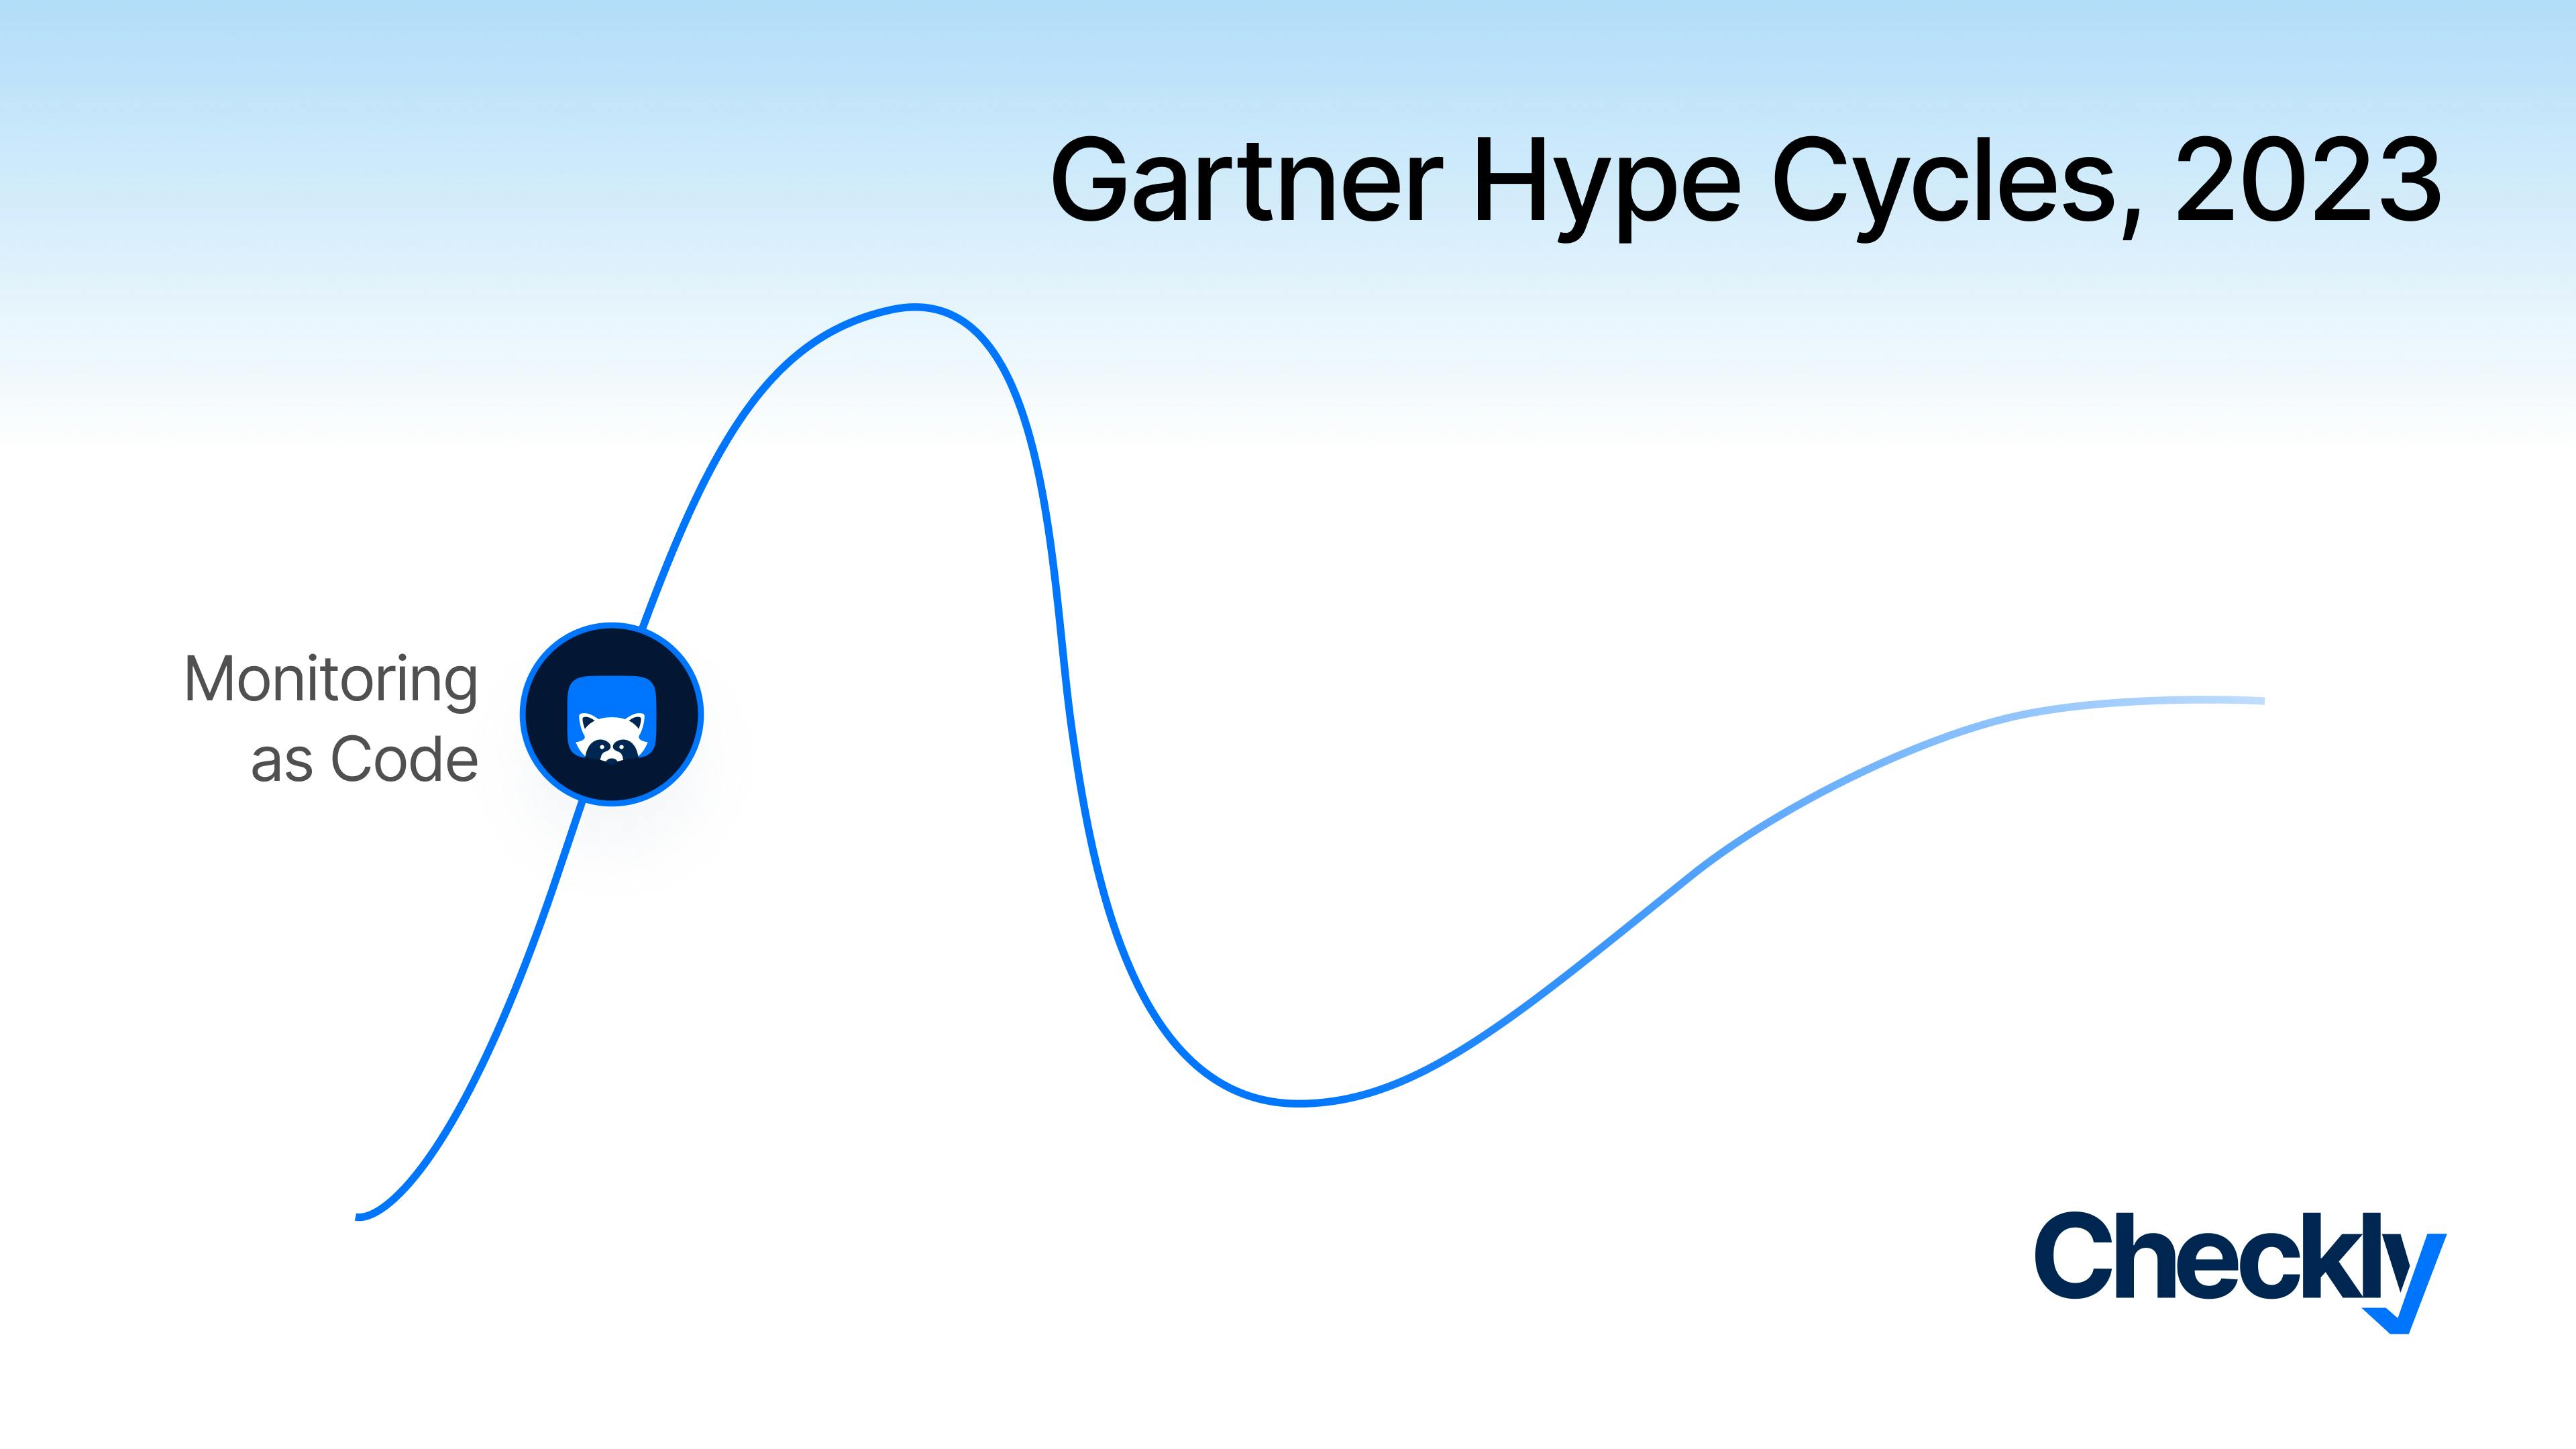
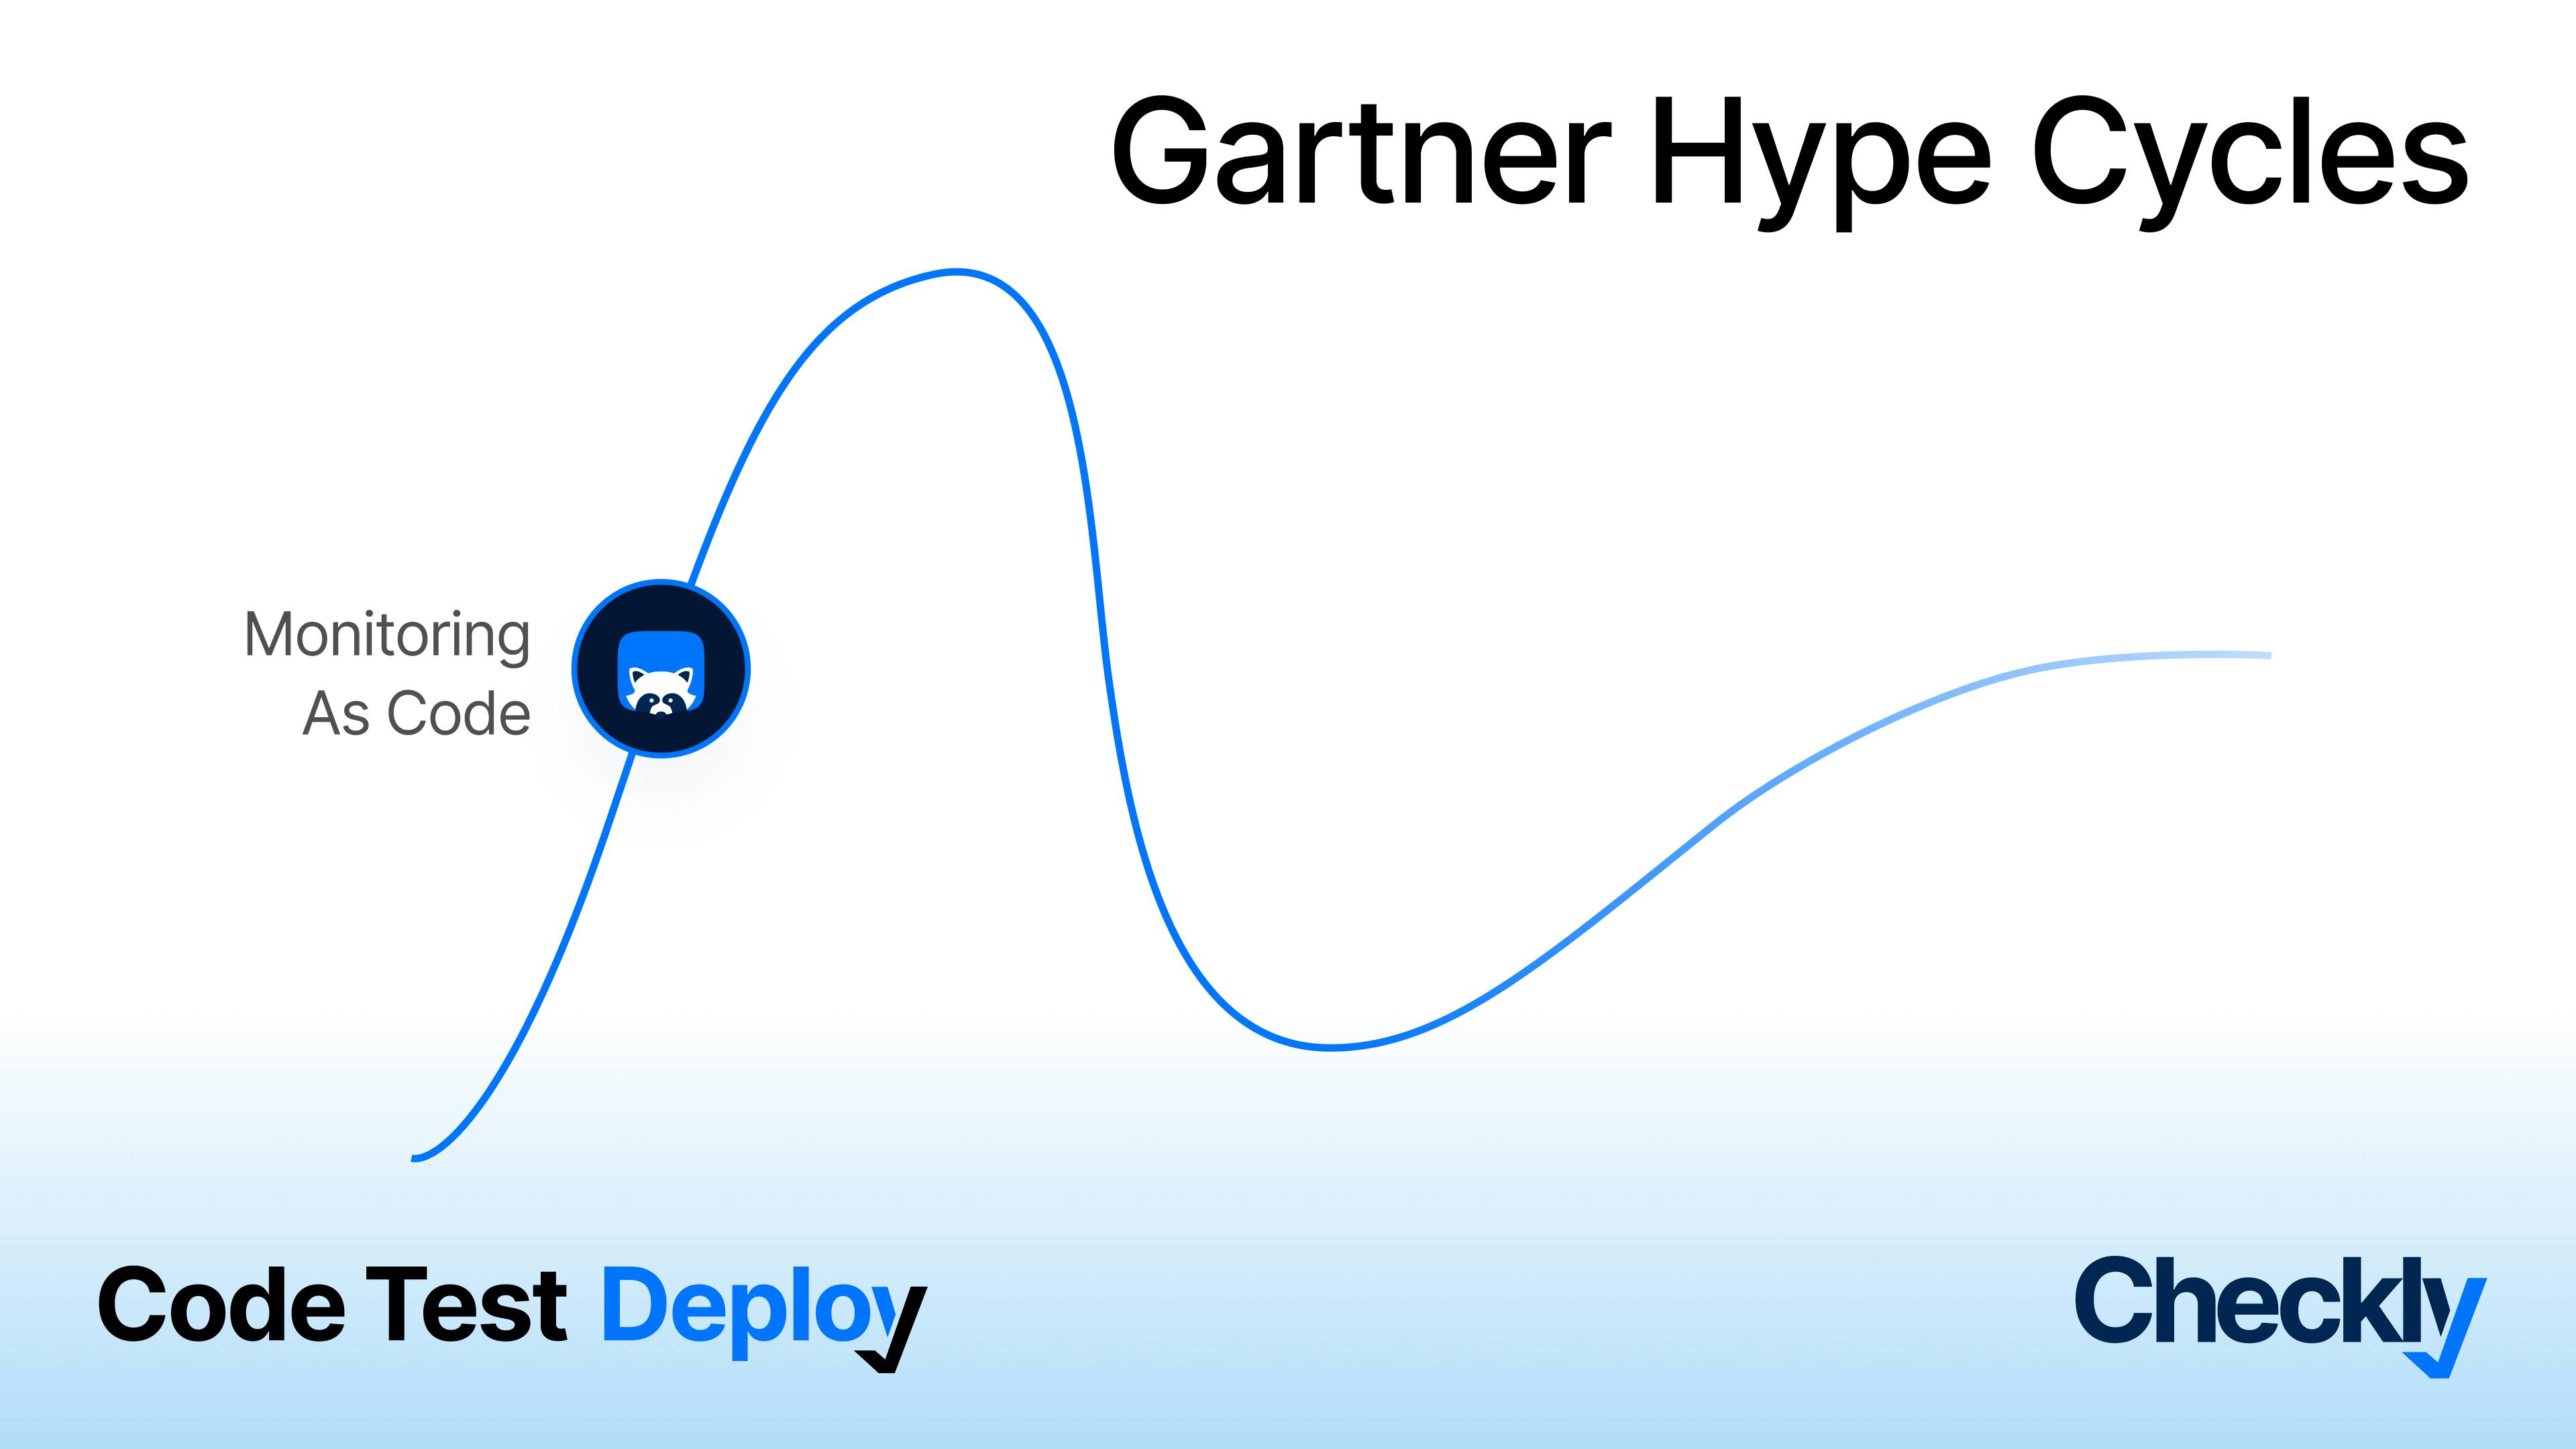
Monitoring as code adds the missing piece: workflow
All of the above prerequisites might be in place, but our MTTD & MTTR might still leave a lot to be desired. That is because we're still missing the less obvious and probably most important piece, the actual key to the solution: engineering team ownership of synthetic monitoring.
No one is better equipped to resolve an issue affecting a specific system than the team building and maintaining that system in the day-to-day. Those are the people with all the knowledge and all the access needed to intervene effectively. They do not need to change the way they do things, either - it’s monitoring that needs to change.
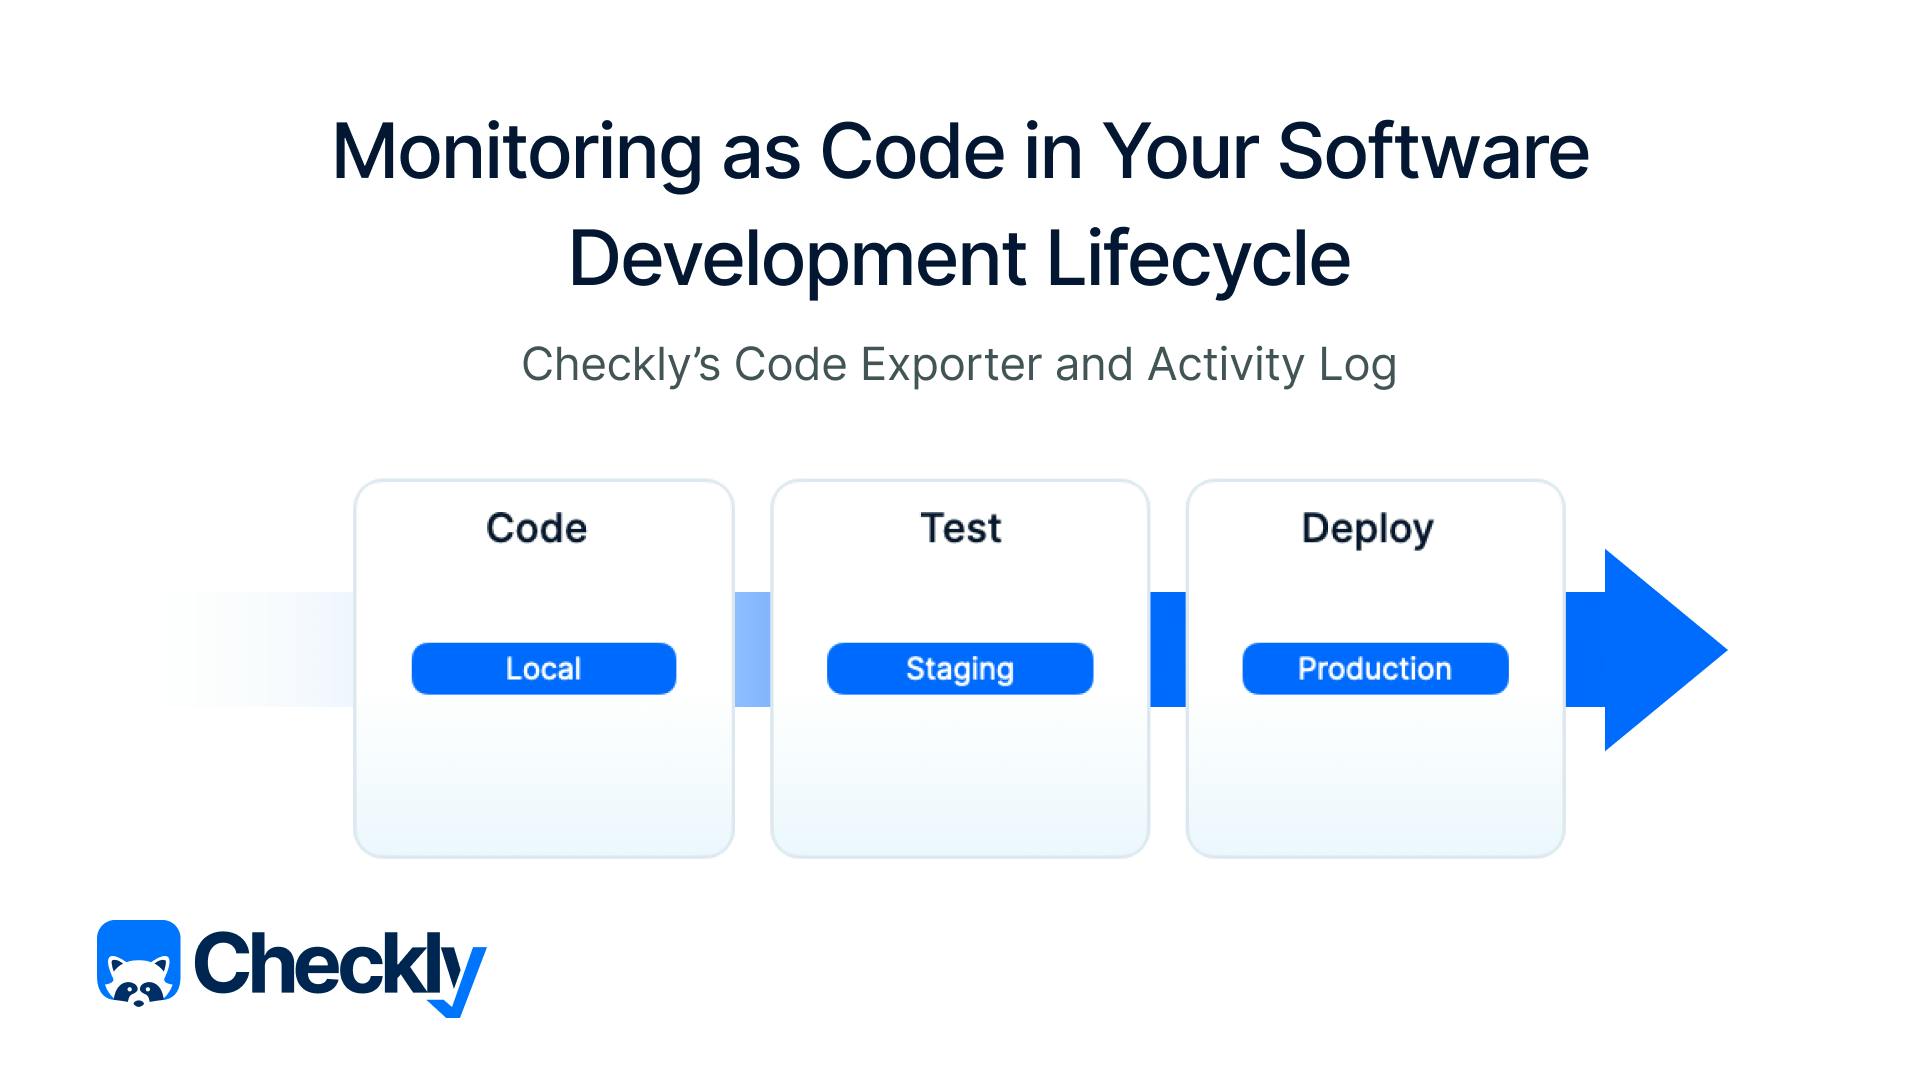
Monitoring needs to become code-first in order to fit the existing workflows of the different types of engineering teams. It needs to live directly in the code base of the projects being monitored (that means in source control), work with the languages the teams are using already to build those systems and allow itself to be molded into something that can adhere closely to the teams’ individual processes and their systems’ business logic.
Once that is achieved, the feedback loop is finally shortened to enable engineers to drive down both the time it takes to detect an incident and how long it takes to investigate the root cause of the incident itself - ultimately also contributing to a lower time to recovery.
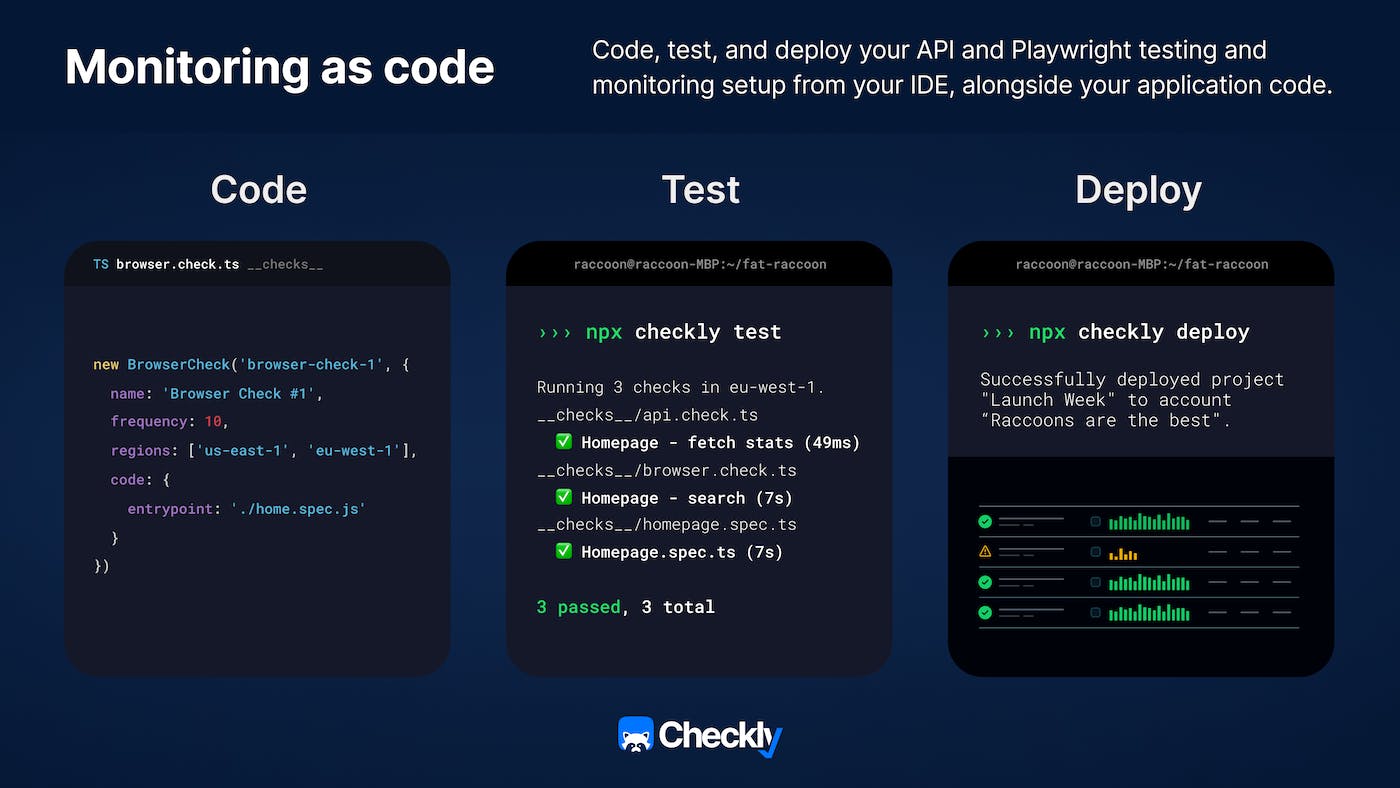
MaC and the Checkly CLI
Starting more than two years back, our focus at Checkly has been monitoring as code, allowing businesses small and large to scale synthetic monitoring. The learnings discussed in this article are some of the ones we picked up along the way. This week we are launching our brand new Checkly CLI, the latest incarnation of our vision to allow engineers to own synthetics using a workflow that’s right for them: code, test, deploy.
See our documentation to get started.