
Checkly is the synthetic monitoring platform that scales. A core part of the Checkly platform is our monitoring as code workflow, which just got a massive boost with the launch of our TS/JS native Checkly CLI which is now in beta! The new CLI allows you to:
- Code your Playwright-based E2E Checks and API checks using TypeScript / JavaScript.
- Test your Checks against our global infrastructure.
- Deploy your Checks from your local box or from CI.
This blog post is split into two parts: Checkly’s history with synthetic monitoring, which is an epic tale of success and failure that eventually led to the new CLI; and our vision for the future that discusses our new CLI and why and how we built it.
If you really wanna speed ahead, just install our CLI right now with the following command and it will set up an example project for you:
npm create @checkly/cliOur history with synthetic monitoring
Checkly has always been a synthetic monitoring provider that blurs the line between monitoring and E2E testing. When we started, this mostly meant two things:
- Use stock Playwright — we actually started with Puppeteer — for E2E Browser checks.
- Use JavaScript setup & teardown scripts for our API checks: just like a typical unit test.
The simplistic idea was “monitoring is actually just fancy testing on a loop.” Right? Well, almost. The core feedback we got from customers was:
- Creating Checks in WebApp is nice, but it doesn’t scale. Past ~15 Checks it just starts being a drag. This is a user problem and a business opportunity.
- Our Checks are code heavy. Code needs to live in source control, so my teammates can review, we can
git logandgit revert, and just have all the nice things that come with my IDE.
Note, there were (way) more problems to tackle but we did not know that yet. We will get back to this, but these two core issues started our journey.
Step #1: Terraform and an API
In 2020, as an early stage startup, we did not want to build our own solution. Luckily, one of our early customers actually built a Terraform provider against our API. We worked with them and a contractor (Hi John!) to adopt that provider and flesh it out.
Fast forward to today, and I can see in our Mixpanel ~2.3M API events triggered by our Terraform Provider in the last 30 days. Some of our largest customers drive their full monitoring setup from Terraform.
Pros
- Terraform and its HCL language are industry leading.
- Terraform is vendor & resource agnostic. If it has an API you can Terraform it.
- Terraform now has a CDK so you can use TypeScript.
Cons
- Managing Terraform files from source in Git is non-trivial.
- As a web dev, you need another tool and learn another language.
- Local writing and debugging of JS/TS-based Checks is hard.
Step #2: Checkly CLI based on YAML - Aborted
Mid 2021 we took a first stab at addressing the concerns we saw with our Terraform provider. Terraform adoption was good and Terraform solves a ton of problems if you’re on the Hashicorp-stack, but a lot of our users are not ops people: they are application developers.
We fired up our IDE’s and basically coded a CLI based on YAML resource definitions. But somehow, it wasn’t really coming together. We didn’t like YAML, as we ended up with all kinds of programming-like syntax inside YAML files. It just felt too limiting to really have an “as-code” workflow. We didn’t like the workflow we came up with. So, some months later we canned it before it was ever used by any customer.
Ok, next!
Step #3: Pulumi and GitHub sync
In 2022 we started two initiatives, as customers kept demanding some way to store their Checks in their codebase.
First, we introduced Pulumi as an alternative to Terraform. The workflow is very similar to Terraform but now you can use TypeScript and other languages Pulumi supports.
Pros
- Pulumi supports actual programming languages.
- Like Terraform, Pulumi is vendor & resource agnostic.
Cons
- Pulumi requires a Pulumi Cloud account.
- Local writing and debugging of JS/TS-based Checks is still hard.
Second, we introduced GitHub sync for Browser Checks where you could store any Playwright code and dependencies in a GitHub repo, which we would fetch on a Git push or deployment trigger sent by 3rd party integrations like GitHub or Vercel.
Pros
- No extra tools needed for syncing code.
Cons
- Works only with GitHub.
- Only works for Browser Checks.
- Does rely on 3rd party events to trigger the sync.
Our vision for the future of synthetic monitoring
After going through the winding road described above, we were still not happy with the developer workflow for driving E2E testing and monitoring from your codebase.
The Monitoring as Code problems recap
Let’s do a short summary of the subtle and not so subtle problems we ran into over the years.
- Using code from source control: Playwright code and setup and teardown scripts are JS/TS code. They need debugging, maintenance, and code reviews.
- CI and Deployment: In most cases, monitoring targets a live production environment. As you deploy changes to production, your monitoring needs to be updated too, preferably right after or right before application changes are rolled out. This needs to be handled somewhere in your CI/CD pipeline.
- Checks are special resources: Defining a Playwright-based Browser Check or API Check is nice, but you want to dry run them so you can debug. Just defining them as an IaC resource is very limiting.
- Different audiences, different stack: Are you in an Ops team at a Fortune 500 company? Are you a full stack dev at a 15 people startup? GitHub or GitLab? CircleCI Jenkins, etc.? YAML, HCL or Typescript?
Late 2022 we went back to the drawing board to tackle this once and for all.
Designing the Developer Workflow
Instead of just starting coding, we actually sat down to set some first principles and looked carefully at “the workflow loop” a developer is comfortable with.
We decided to start from the unit testing and / or E2E testing perspective. Why? Because unit testing is an ingrained workflow that has proven the test of time.
- You code your tests.
- You run your tests. Locally and/or in your CI pipeline.
And then we just added a last step needed in a monitoring use-case.
3. You deploy your tests to Checkly so we can run them around the clock.
This workflow already implies some other obvious design decisions like being terminal-first and source control and/or CI-provider agnostic. But there were some less obvious design decisions, specifically around how to define an actual Check.
First, we did not want to use a configuration language like JSON, TOML or YAML. We quickly settled on TypeScript with implicit JavaScript support. Just like unit testing, think the typical .spec.ts|js file.
Second, we wanted to store our Checks inside our application code base, alongside the component / service / module it was actually supposed to monitor. Just like unit testing again, think of the typical __tests__ folder.
Finally, we wanted Checks to be composable and generatable. You should be able to loop over a set of variables and create Checks, just like table-based unit testing.
However, we also recognised while synthetic monitoring is a lot like testing, it’s not an exact 1:1. I.e., a unit test is not persisted and executed on a runtime environment outside of its test suite, whereas a synthetic monitor is a persistent background job that runs on our cloud and collects metrics over days, weeks, and months.
You can see the dilemma. We want some aspects of a test runner like Jest and some aspects of an IaC tool! So that is exactly what we built.
I jokingly refer to our CLI as “the bastard child of Jest and AWS CDK.”
Let’s have a look at how that works in practice
The CLI and Constructs Architecture
I did not want to write a manual here on how to use the CLI. The repo is open source and we have extensive documentation on all the ins and outs. Instead I wanted to showcase how the learnings and design decisions are reflected in the actual implementation.
1. Projects
Everything starts with a checkly.config.ts|js at the root of your repo. This should be very familiar to all devs in the TS/JS ecosystem. Here is what a typical repo structure looks like. Note the __checks__ folder too, we'll get back to that.
.
|-- checkly.config.ts
|-- package.json
`-- src
    `-- __checks__
      |-- hello-api.check.ts
      `-- homepage.spec.ts
The checkly.config.ts file sets global defaults, some file matching patterns (more on that later) and defaults for CLI execution. Here’s a typical, abbreviated example.
const config = {
 projectName: 'Acme Monitoring',
 checks: {
   activated: true,
   muted: false,
   runtimeId: '2022.10',
   frequency: 5,
   locations: ['us-east-1', 'eu-west-1'],
   tags: ['website', 'api'],
   alertChannels: [],
   checkMatch: '**/*.check.js',
   browserChecks: {
     frequency: 10,
     testMatch: '**/*.spec.js',
   },
 },
 cli: {
   runLocation: 'eu-west-1',
   privateRunLocation: 'private-dc1'
 }
}

export default config
2. Constructs
Let’s add some Checks by instantiating a Check construct. A construct is just a TypeScript class that describes a Checkly resource. This can be a Check, but also a Check Group or an Alert Channel. We 100% did not steal this idea from the AWS CDK.
Here’s an example of creating a Playwright-based Browser Check and API check. It comes with all the goodies like code completion, type safety etc.
// __checks__/hello-api.check.ts

import { ApiCheck, AssertionBuilder } from '@checkly/cli/constructs'

new ApiCheck('product-api-1', {
  name: 'Product API',
  request: {
    method: 'GET',
    url: 'https://api.acme.com/v1/products',
    headers: [
      {
        key: 'X-My-Header',
        value: 'My custom header value'
      }
    ],
    assertions: [
        AssertionBuilder.statusCode().equals(200),
        AssertionBuilder.jsonBody('$.name').notEmpty()
    ]
  }
})
// __checks__/homepage.spec.ts
import { test, expect } from '@playwright/test'
test('Acme Homepage', async ({ page }) => {
const response = await page.goto('https://acme.com')
expect(response.status()).toBeLessThan(400)
await expect(page).toHaveTitle(/Acme: Soap and Dynamite/)
await page.screenshot({ path: 'homepage.jpg' })
})
Let’s highlight three things in the design here:
- We organize Checks in
.check.tsfiles inside__checks__folders to instantly recognize where our checks live. Using the glob patterncheckMatchwe slurp them up once we hit the test command. - All key Check properties like
locations,frequencyandalertChannelswhich dictate where and how often a Check runs and where it should alert if anything breaks are inherited from the Project, a Check Group or can be overridden at the individual Check level. - Playwright-based Browser Checks are special. We want your Playwright script to be a canonical script. No added flavours. This is why we have a
testMatchproperty in theProjectandCheckGroupconstructs. It matches.spec.tsfiles and turns them into synthetic monitoring Checks based on defaults for properties like locations, frequency etc. This is immensely powerful as you can use any and all local Playwright debugging tools to get your Checks working exactly the way you want.
The key underlying DX principle here is that after setting up a project like you want to, you can “just add a file” to build out your testing and monitoring coverage.
Note: the above are all conventions we advise. You can tweak the file extensions and paths as you like. Learn more about checkMatch and testMatch in our docs.
3. Test Runner
When you run npx checkly test a whole bunch of things happen, but most of that is hidden from you. It looks like just another test run.
npx checkly test
Running 2 checks in eu-west-1.

src/__checks__/home.check.ts
  ✔ home.spec.ts (7s)
src/__checks__/hello-api.check.ts
  ✔ Product API (46ms)

2 passed, 2 total
Under the hood, we package up the Checks defined in your project and send them off to one of our runner locations. You can tweak that in the checkly.config.ts or just using the --location flag. Yes, this also works with Private Locations inside your own DC or VPC. We execute your Checks in parallel and report back the results to your terminal with logging and debug info when a Check fails.
Boom. You just did a dry run of your synthetic monitoring Checks. You can do this from your local box or in CI. We have a GitHub Actions example right here.
4. Deploy command
In the final step, you deploy your Checks and their related resources to the Checkly cloud.
npx checkly deploy

You are about to deploy your project "Acme Monitoring" to account "Production". Do you want to continue? (Y/n)

Successfully deployed project "Acme Monitoring" to account "Production".
Open your Checkly dashboard et voilà
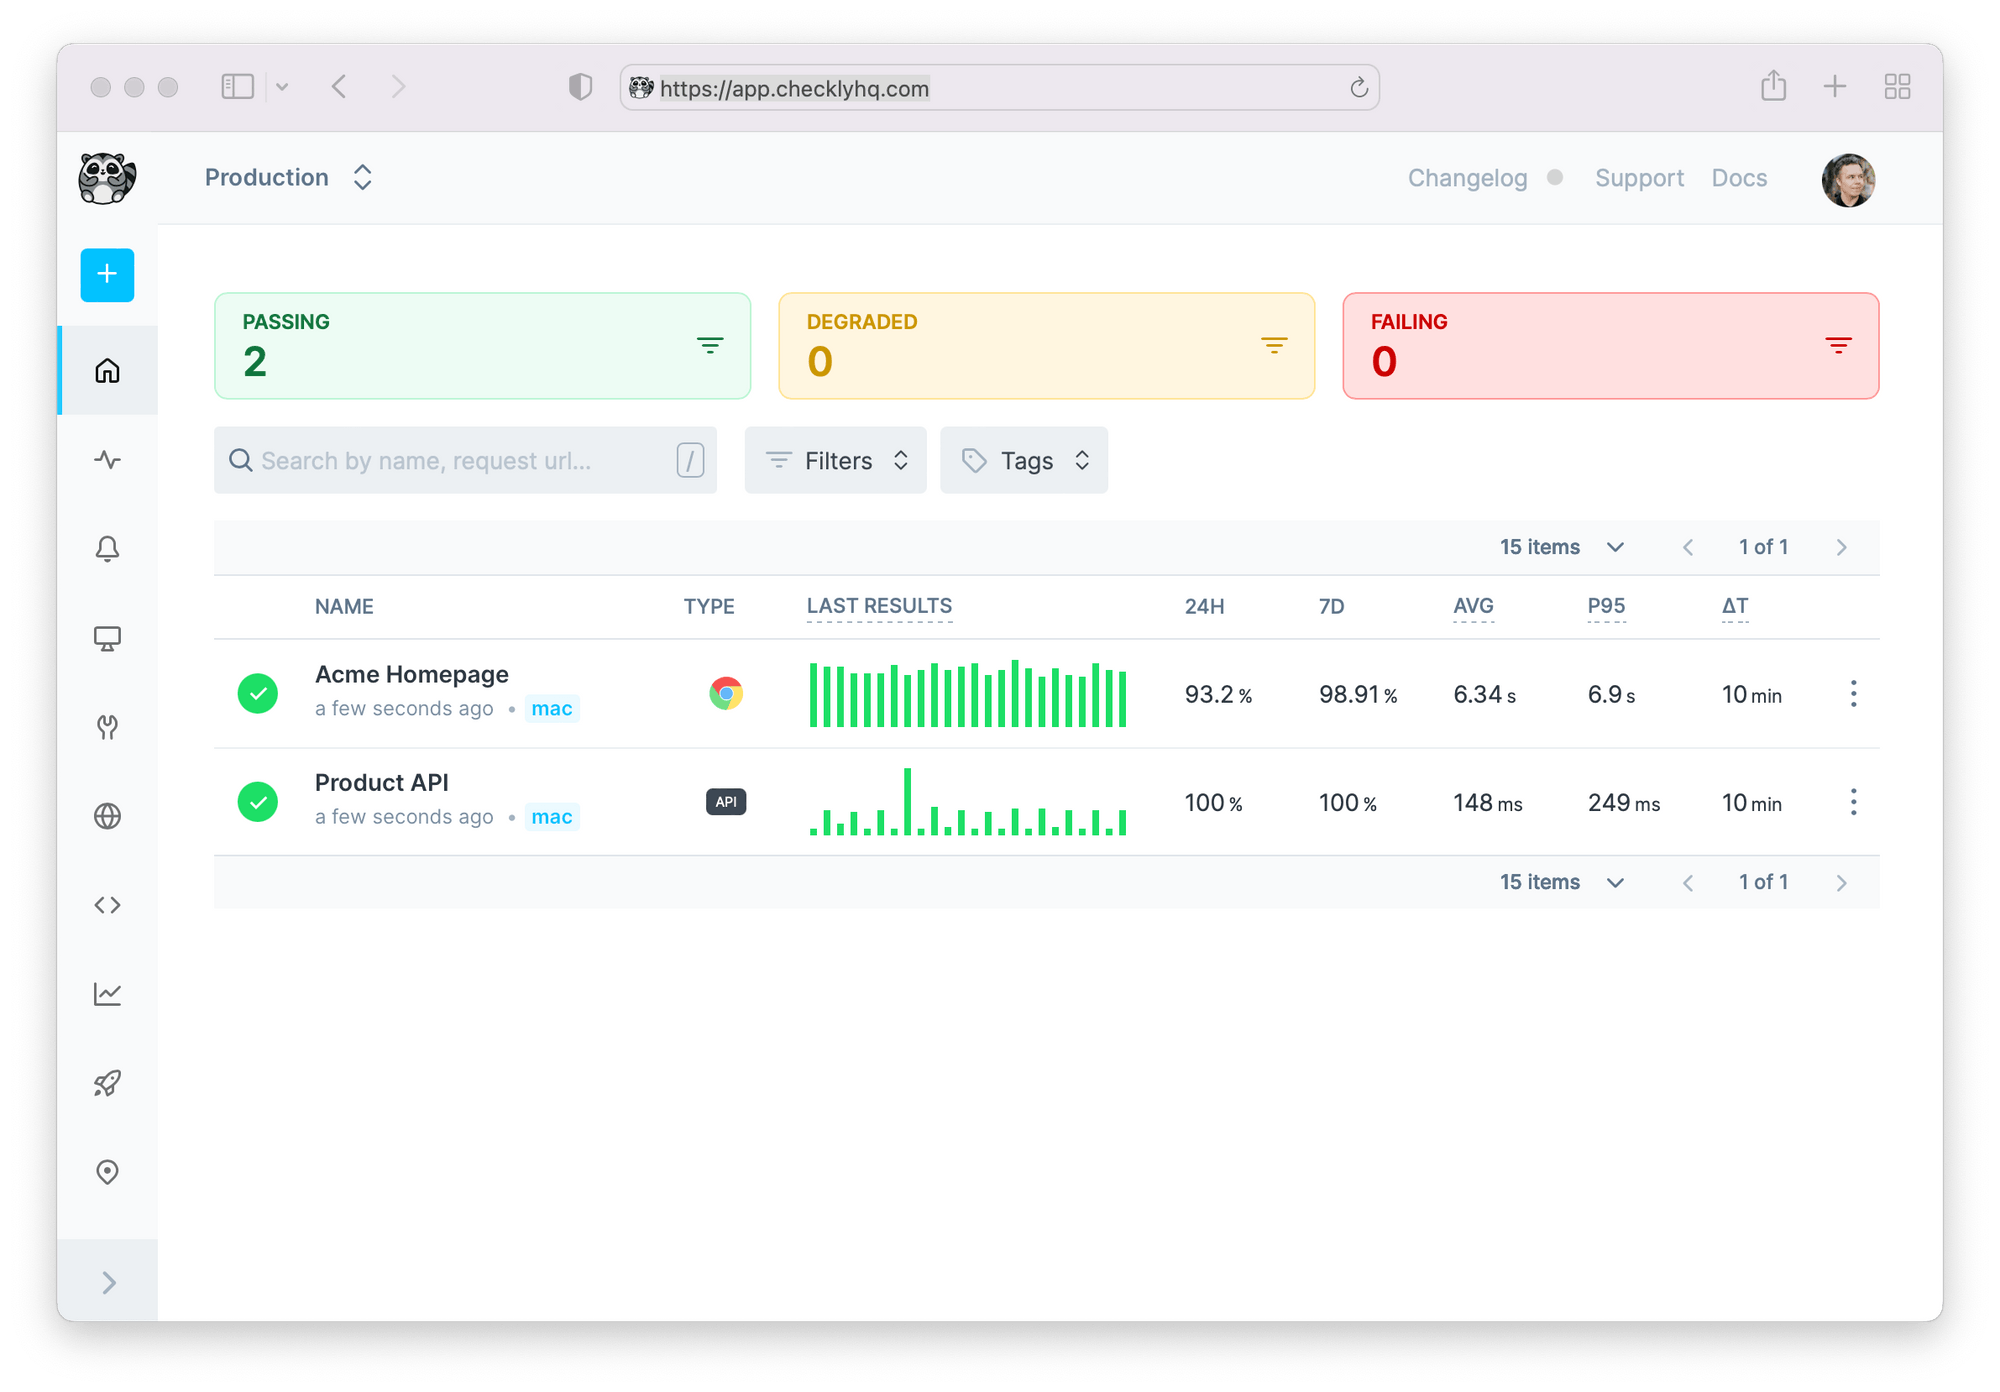
Of course, this is very specific to monitoring. In a unit testing case this makes no real sense. With the deploy command, we not only deploy your Checks but also all other constructs that are not Checks: CheckGroups, AlertChannels etc.
We left test runner land and are now squarely in IaC land again. Your Checks are humming around the clock, ready to beep you out of bed when needed.
Looking Ahead
The Checkly CLI and its constructs are already pretty damn powerful, and we are just in Beta right now. We have been using the CLI ourselves since early alpha, together with dozens of early adopters.
Having said that, we have some big plans for the CLI and the monitoring as code workflow it enables.
- We will heavily focus on the code, test, and deploy workflow so it integrates like magic with whatever stack you are using.
- We will introduce new Check types you can drive from code base: think DNS, TCP, and multi-step API checks.
- We will make switching between the UI and the CLI as seamless as possible, surfacing the right info and helping you adopt monitoring as code.
The vision for Checkly going forward is to make the monitoring as code workflow the best and primary workflow to add E2E testing and monitoring to your application stack.