Edit: after publishing this article, a user on Hacker News asked if we could explore the relative savings rather than the absolute. My response from that thread:
Based on last week's data, our change reduced the task time by 40ms from an average of 3440ms, and this task runs 11 million times daily. This translates to a saving of about 1%.
To put it in perspective, thanks to OTEL and Coralogix, we identified and fixed the issue in about one day of work. Small efficiencies can indeed make a significant impact in large-scale systems.
------
What’s the point of observability? Surely if you write good code, maintain it, handle tech debt, and administer its resources correctly, it’ll run great? Why would you need to keep a close eye on services that have already been tested and are working great? In this article I want to show how continuous monitoring of your systems closely, with tools like Checkly and Coralogix, can find problems that would have been impossible to predict or pre-optimize. More generally, we’ll see how tiny fixes identified by observability can have big impacts.
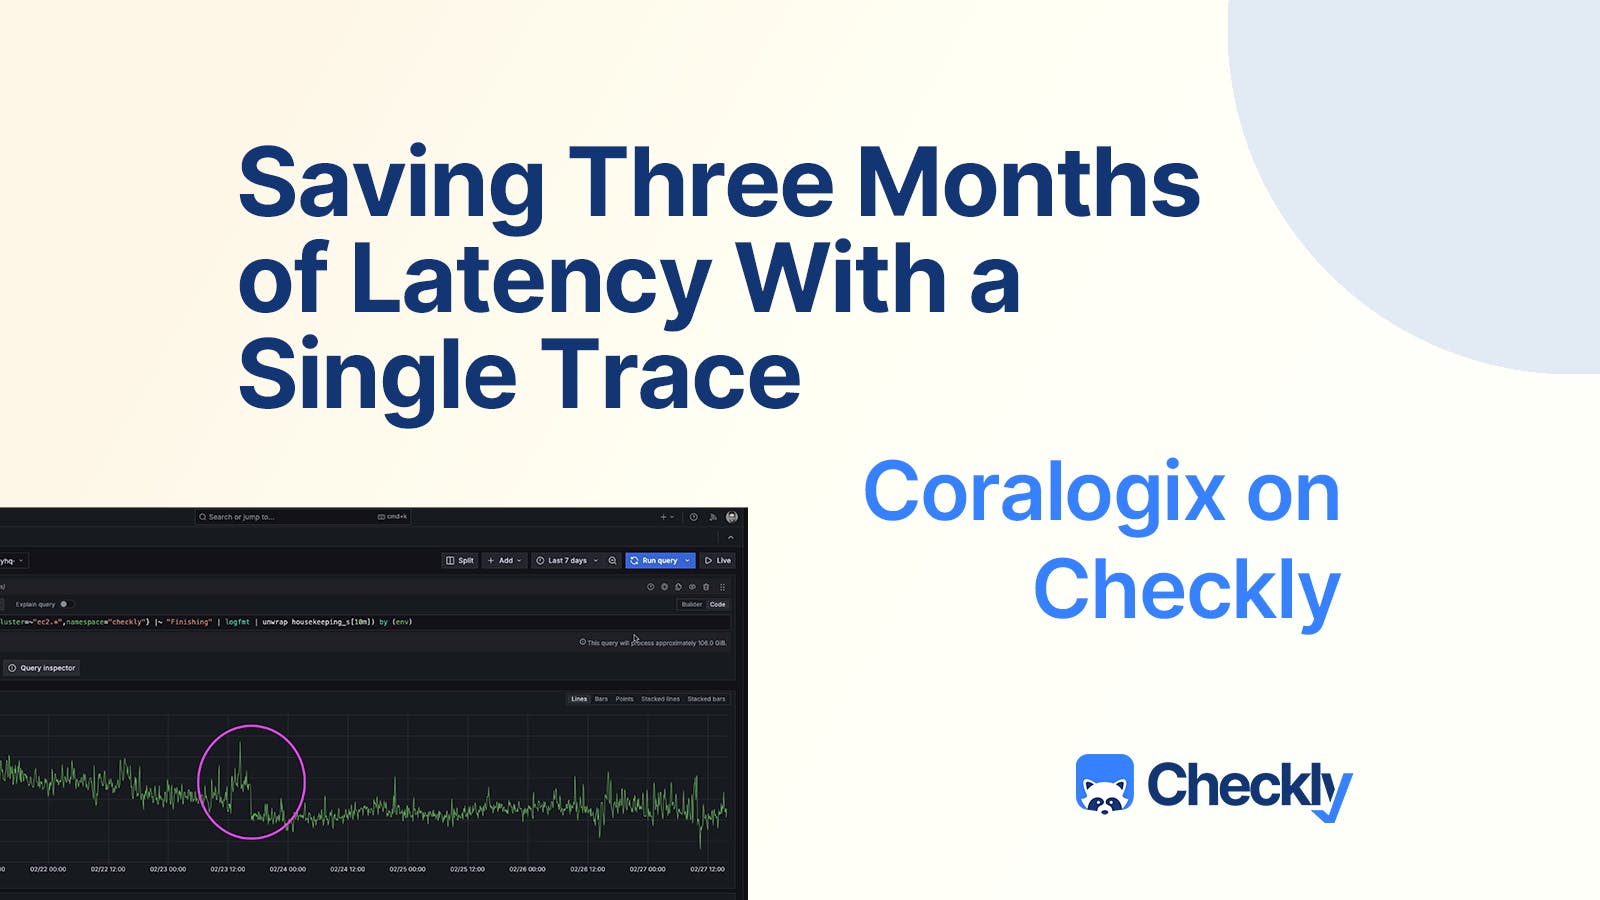
We monitored our Node service with OpenTelemetry and sent the data to a Coralogix dashboard, and with a little digging found an issue that was causing over a month of latency over all our tasks. A huge win with a small time investment, and a strong argument for observability tools.
Part 1 — Adding OpenTelemetry monitoring for a slow process
Our story begins with a mystery: a process that was taking longer than expected. The process involved was ‘housekeeping time:’ the time the Checkly service spent after a check has completed. In this time we write the trace to our datastore, send an event with the status, etc. All the stuff that needs to happen for the Checkly service to display data from the check, and notify the user if something is wrong.
We decided to use OpenTelemetry and to identify the root of the problem in our back end code. Coralogix supports OpenTelemetry to get telemetry data (traces, logs, and metrics) from our application as requests travel through its many services and infrastructure.
Taming OpenTelemetry Node Traces
The OpenTelemetry project contains multiple language projects at varying levels of maturity, but all those listed on the main language project page are used by large teams in production. Our initial experience with the Node OpenTelemetry project out of the box was that traces were extremely noisy.
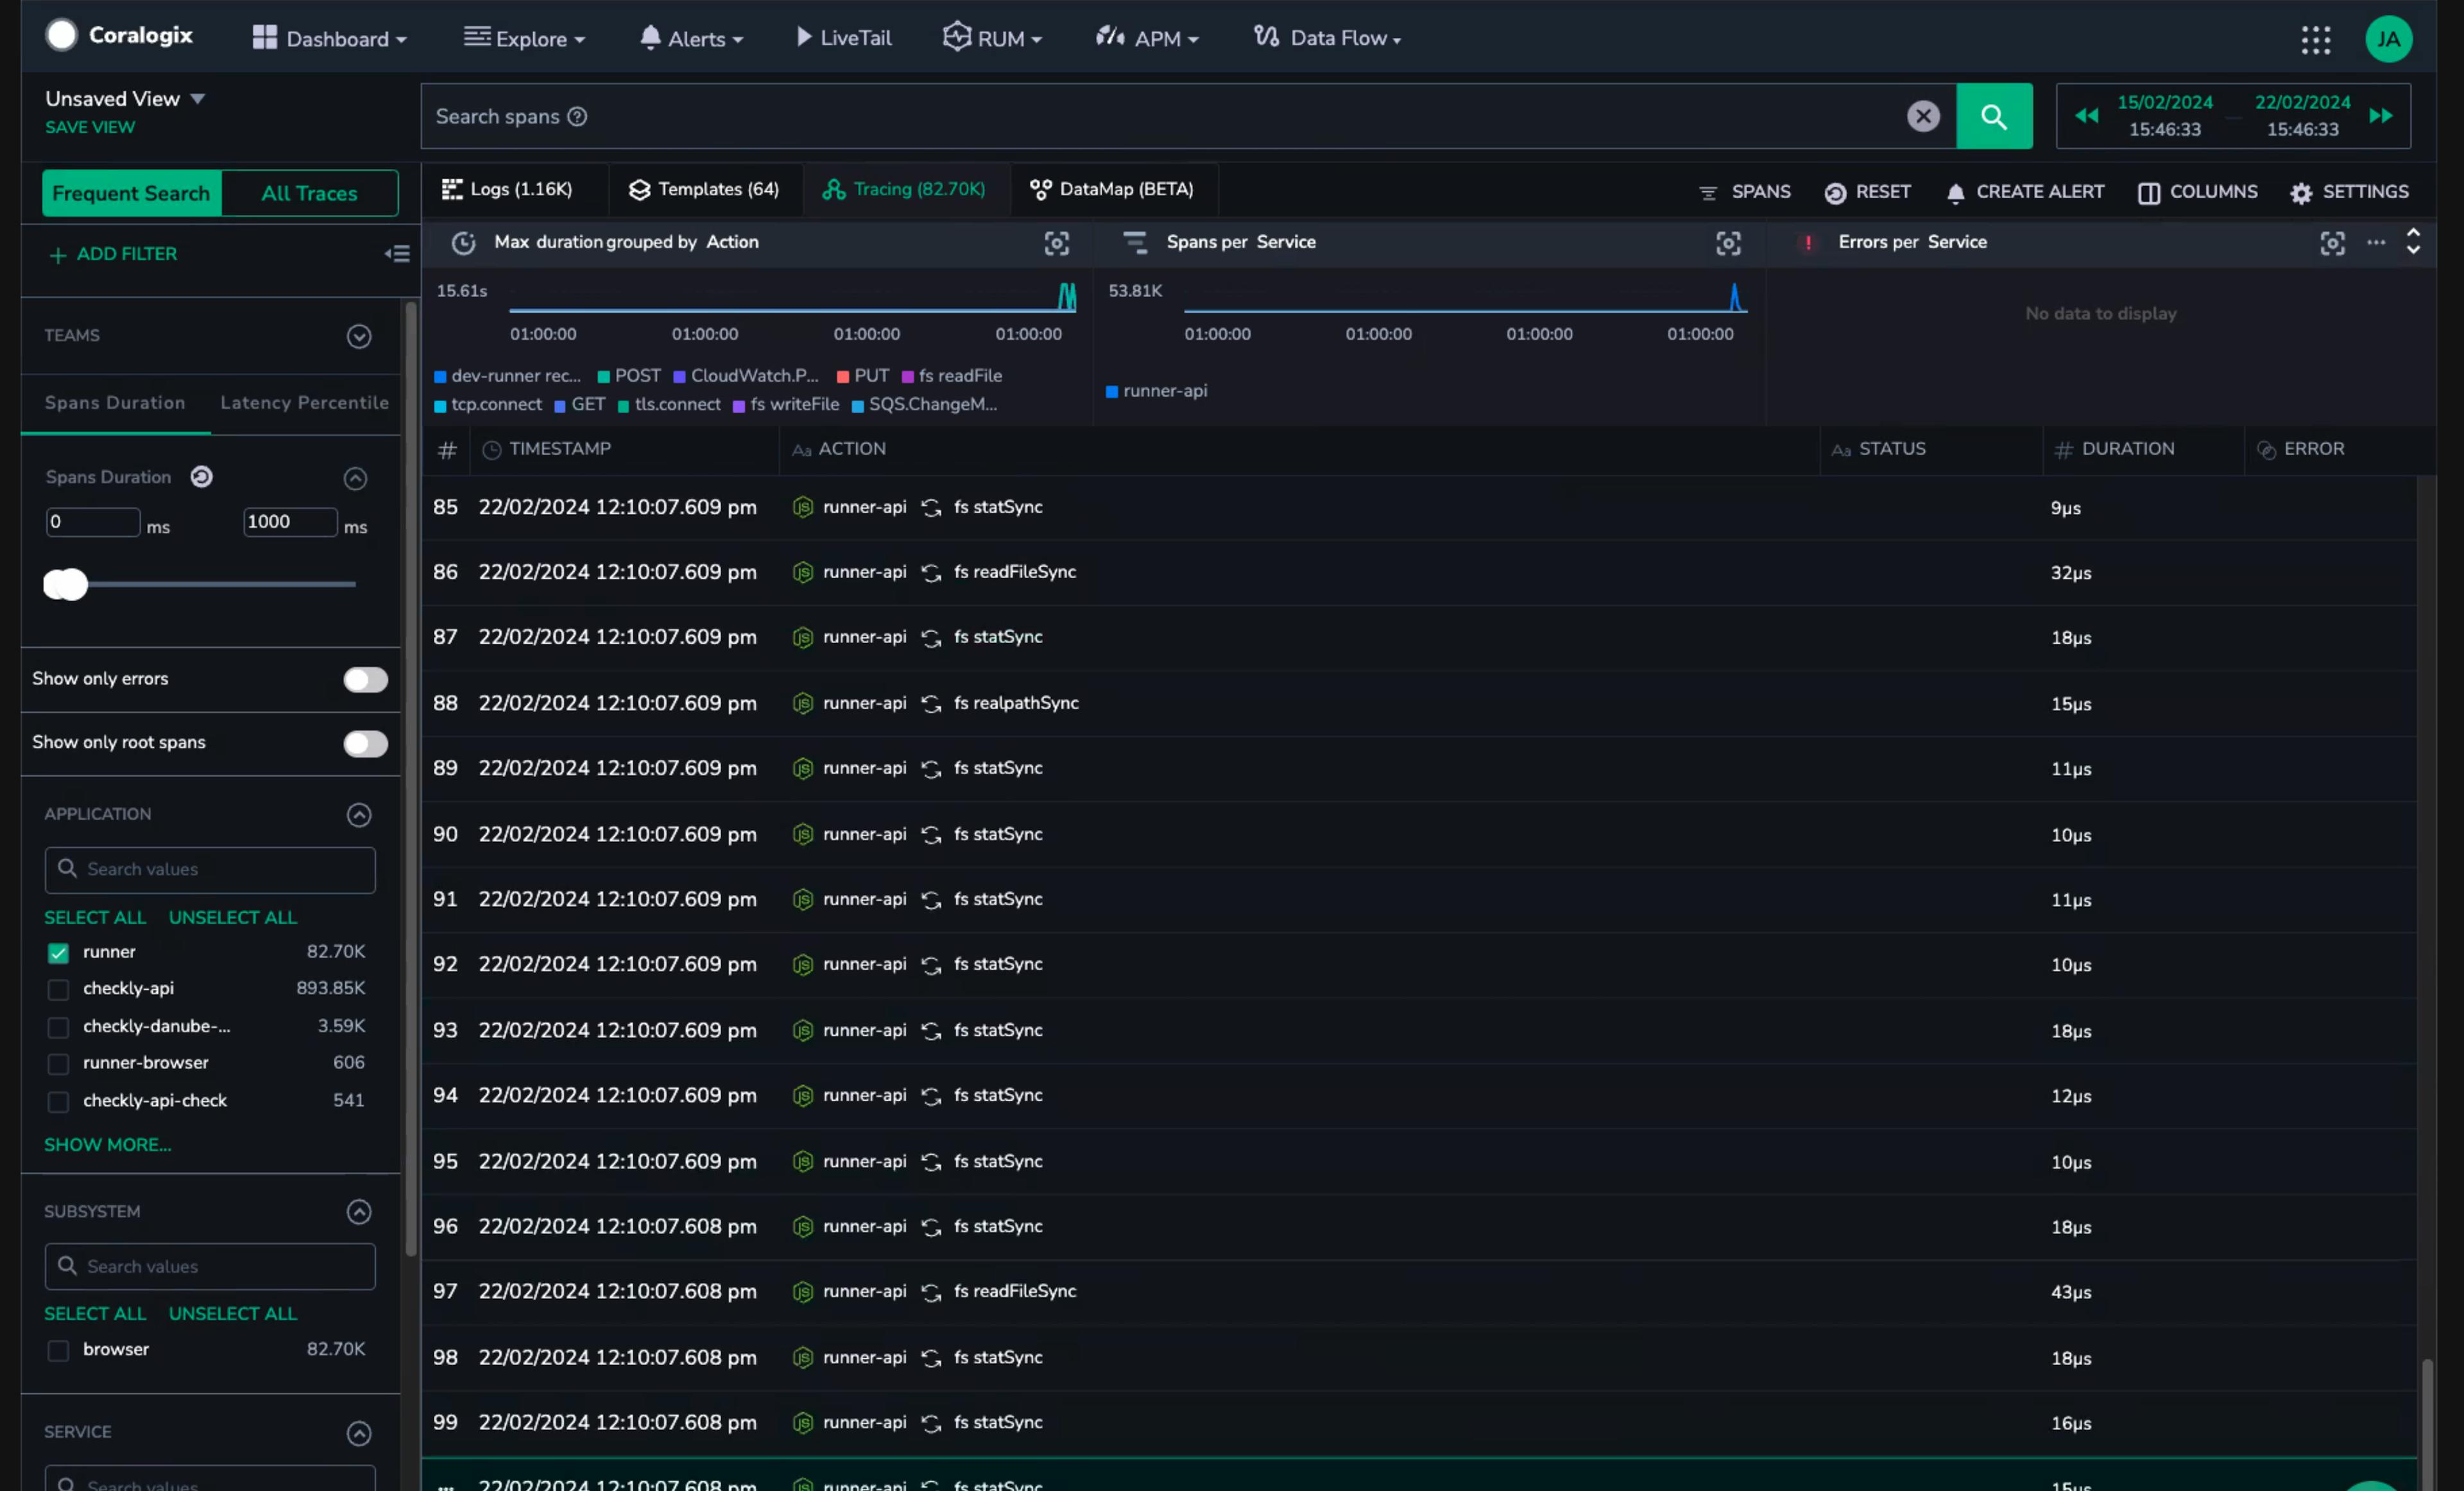
One of our early traces with many MANY time spans in microseconds
Consulting with some smart people on the CNCF Slack, we found a few existing issues with the OpenTelemetry Node instrumentation. It became clear the issue was capturing NodeJS’s file system, creating a span each time a module was required. By modifying our configuration we disabled file system instrumentation and started getting much more interesting trace data.
With many types of spans and millisecond-length measurements, this is a trace worth looking at.
There are many ways to filter your OpenTelemetry data, in fact if you’re curious about this topic you might check out Nica’s recent talk at KCD New York: “Controlling Data Overhead from the OpenTelemetry Collector.”
Part 2 Finding the red flags 🚩 — a mysterious re-authentication
One of the wonderful things about doing Observability right is the role of human operators in the highest level of investigation. Automatic scanning is useful for so much, but a human being scrolling through a trace can notice things right away that just don’t look right.
Notably, if you want to make sure that your own checks’ traces are more human-readable, consider adding steps to your Playwright code to make sure others can see the purpose of check components.
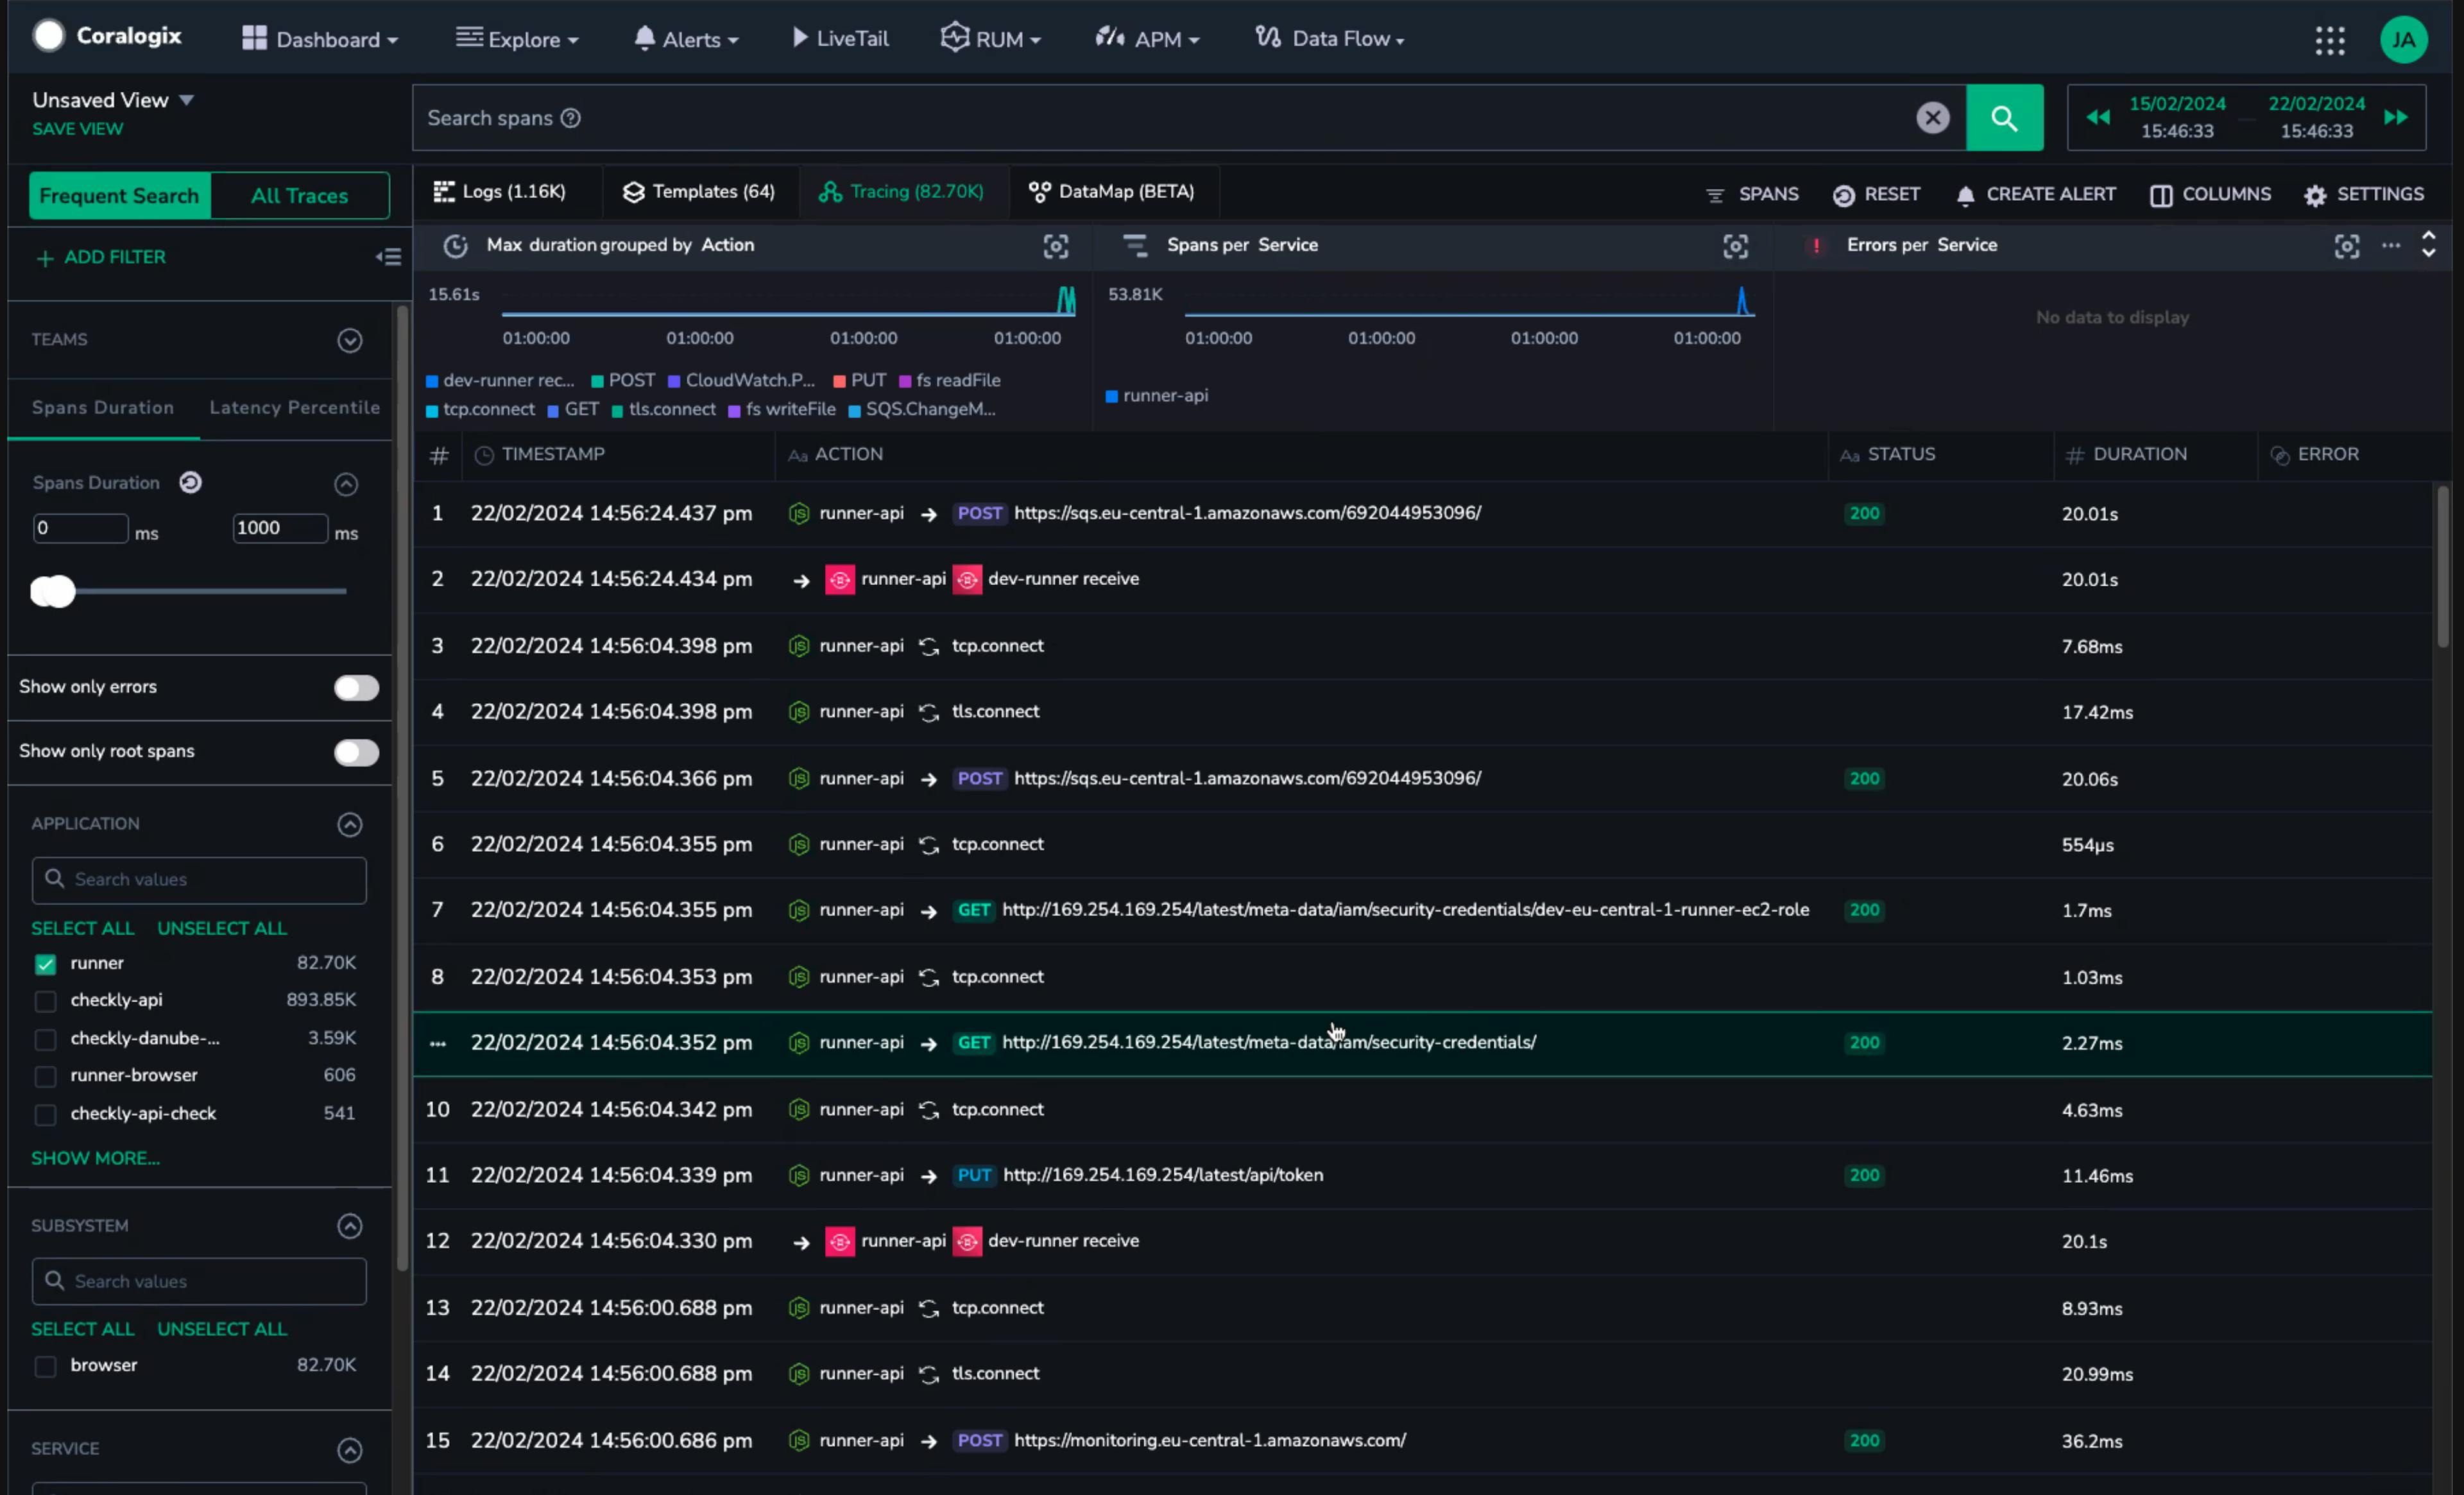
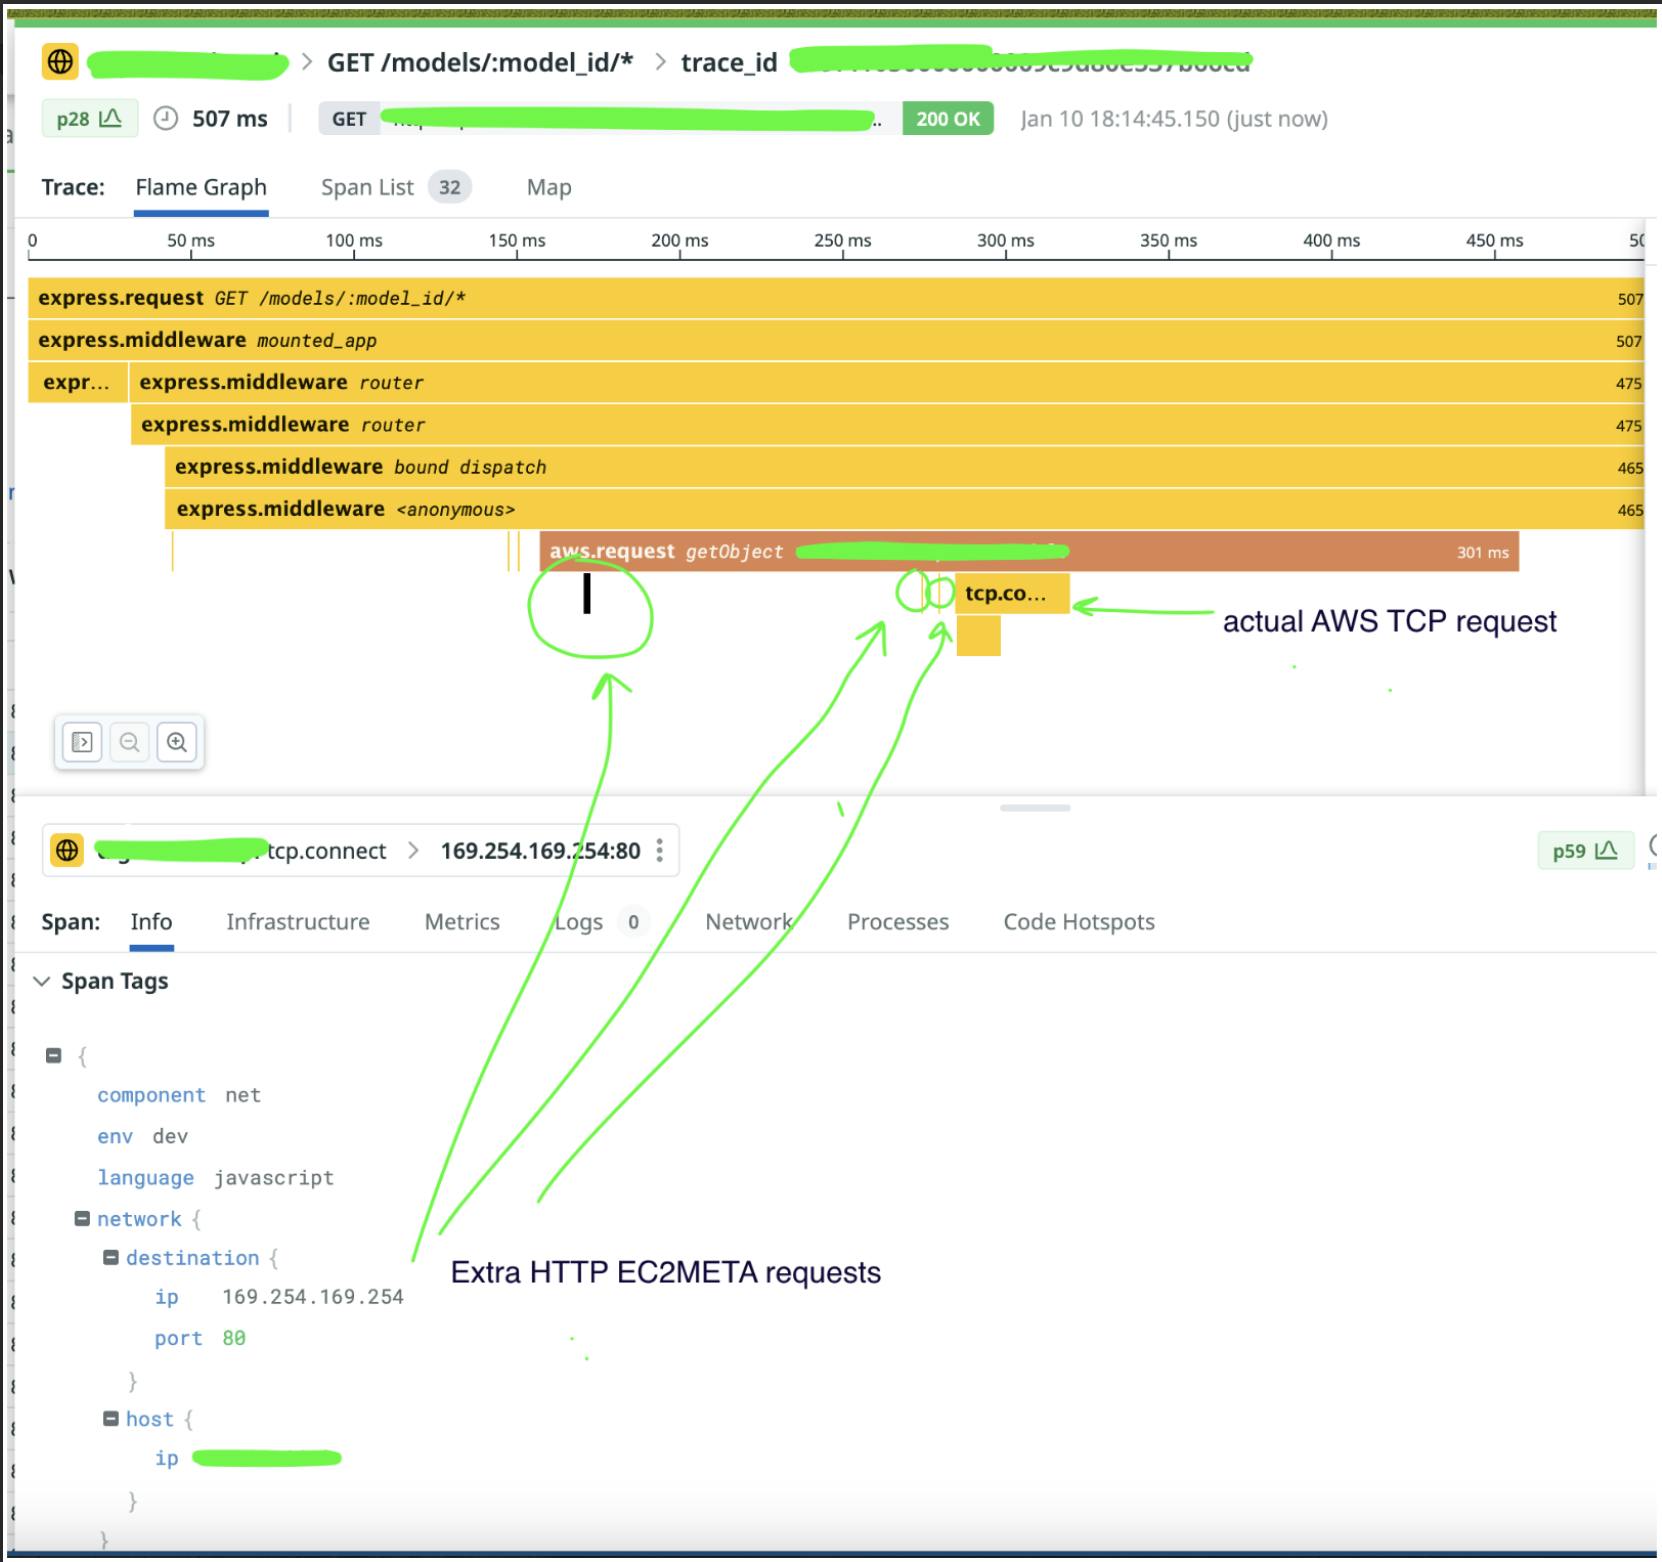
In the case of our traces, we noticed that a request for security credentials was happening more than once. The requests were spaced out enough that they didn’t show up in the same page of spans:
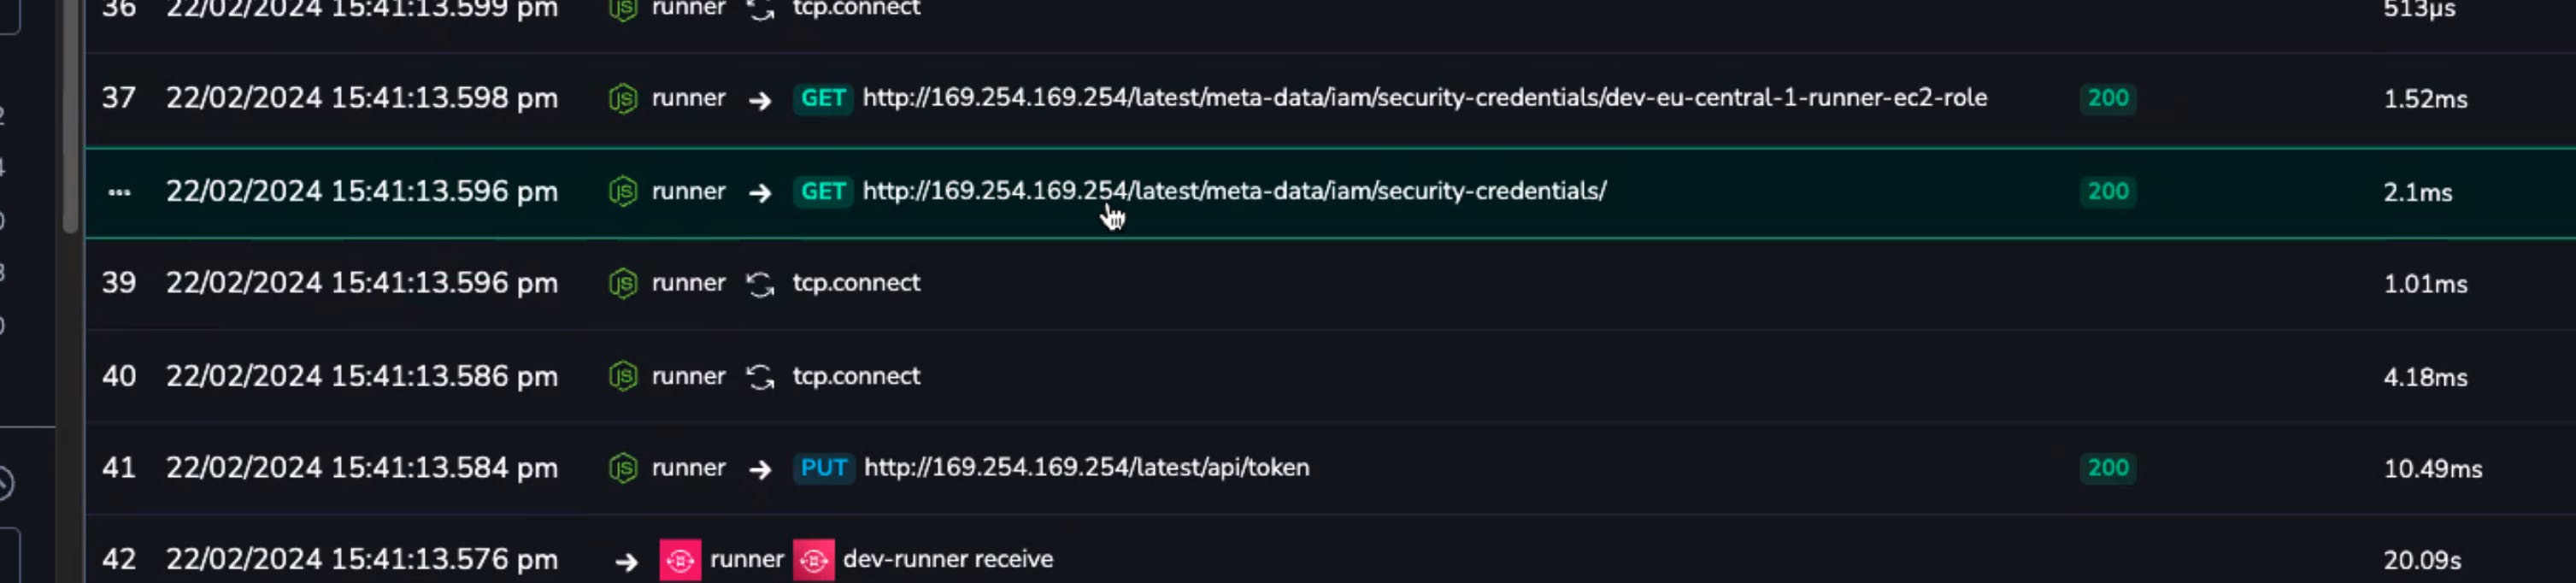
When you’re fetching a security token, once is funny, twice is mean.
Knowing that the issue was multiple requests to AWS authentication, a little searching brought us to the exact issue in the AWS SDK.

Charmingly, Yurii Siedin had shown clear evidence of the problem using his own tracing tool:
Sometimes a trace is just the easiest way to show a problem.
With the fix recommended in the GitHub issue, saving the results of our authentication call locally and obviating repeated requests, the issue disappeared from our traces.
Part 3 — Little changes, big benefits
A little bump can mean big things. In this case, the merge of our fix resulted in a measured drop in the time of housekeeping tasks.
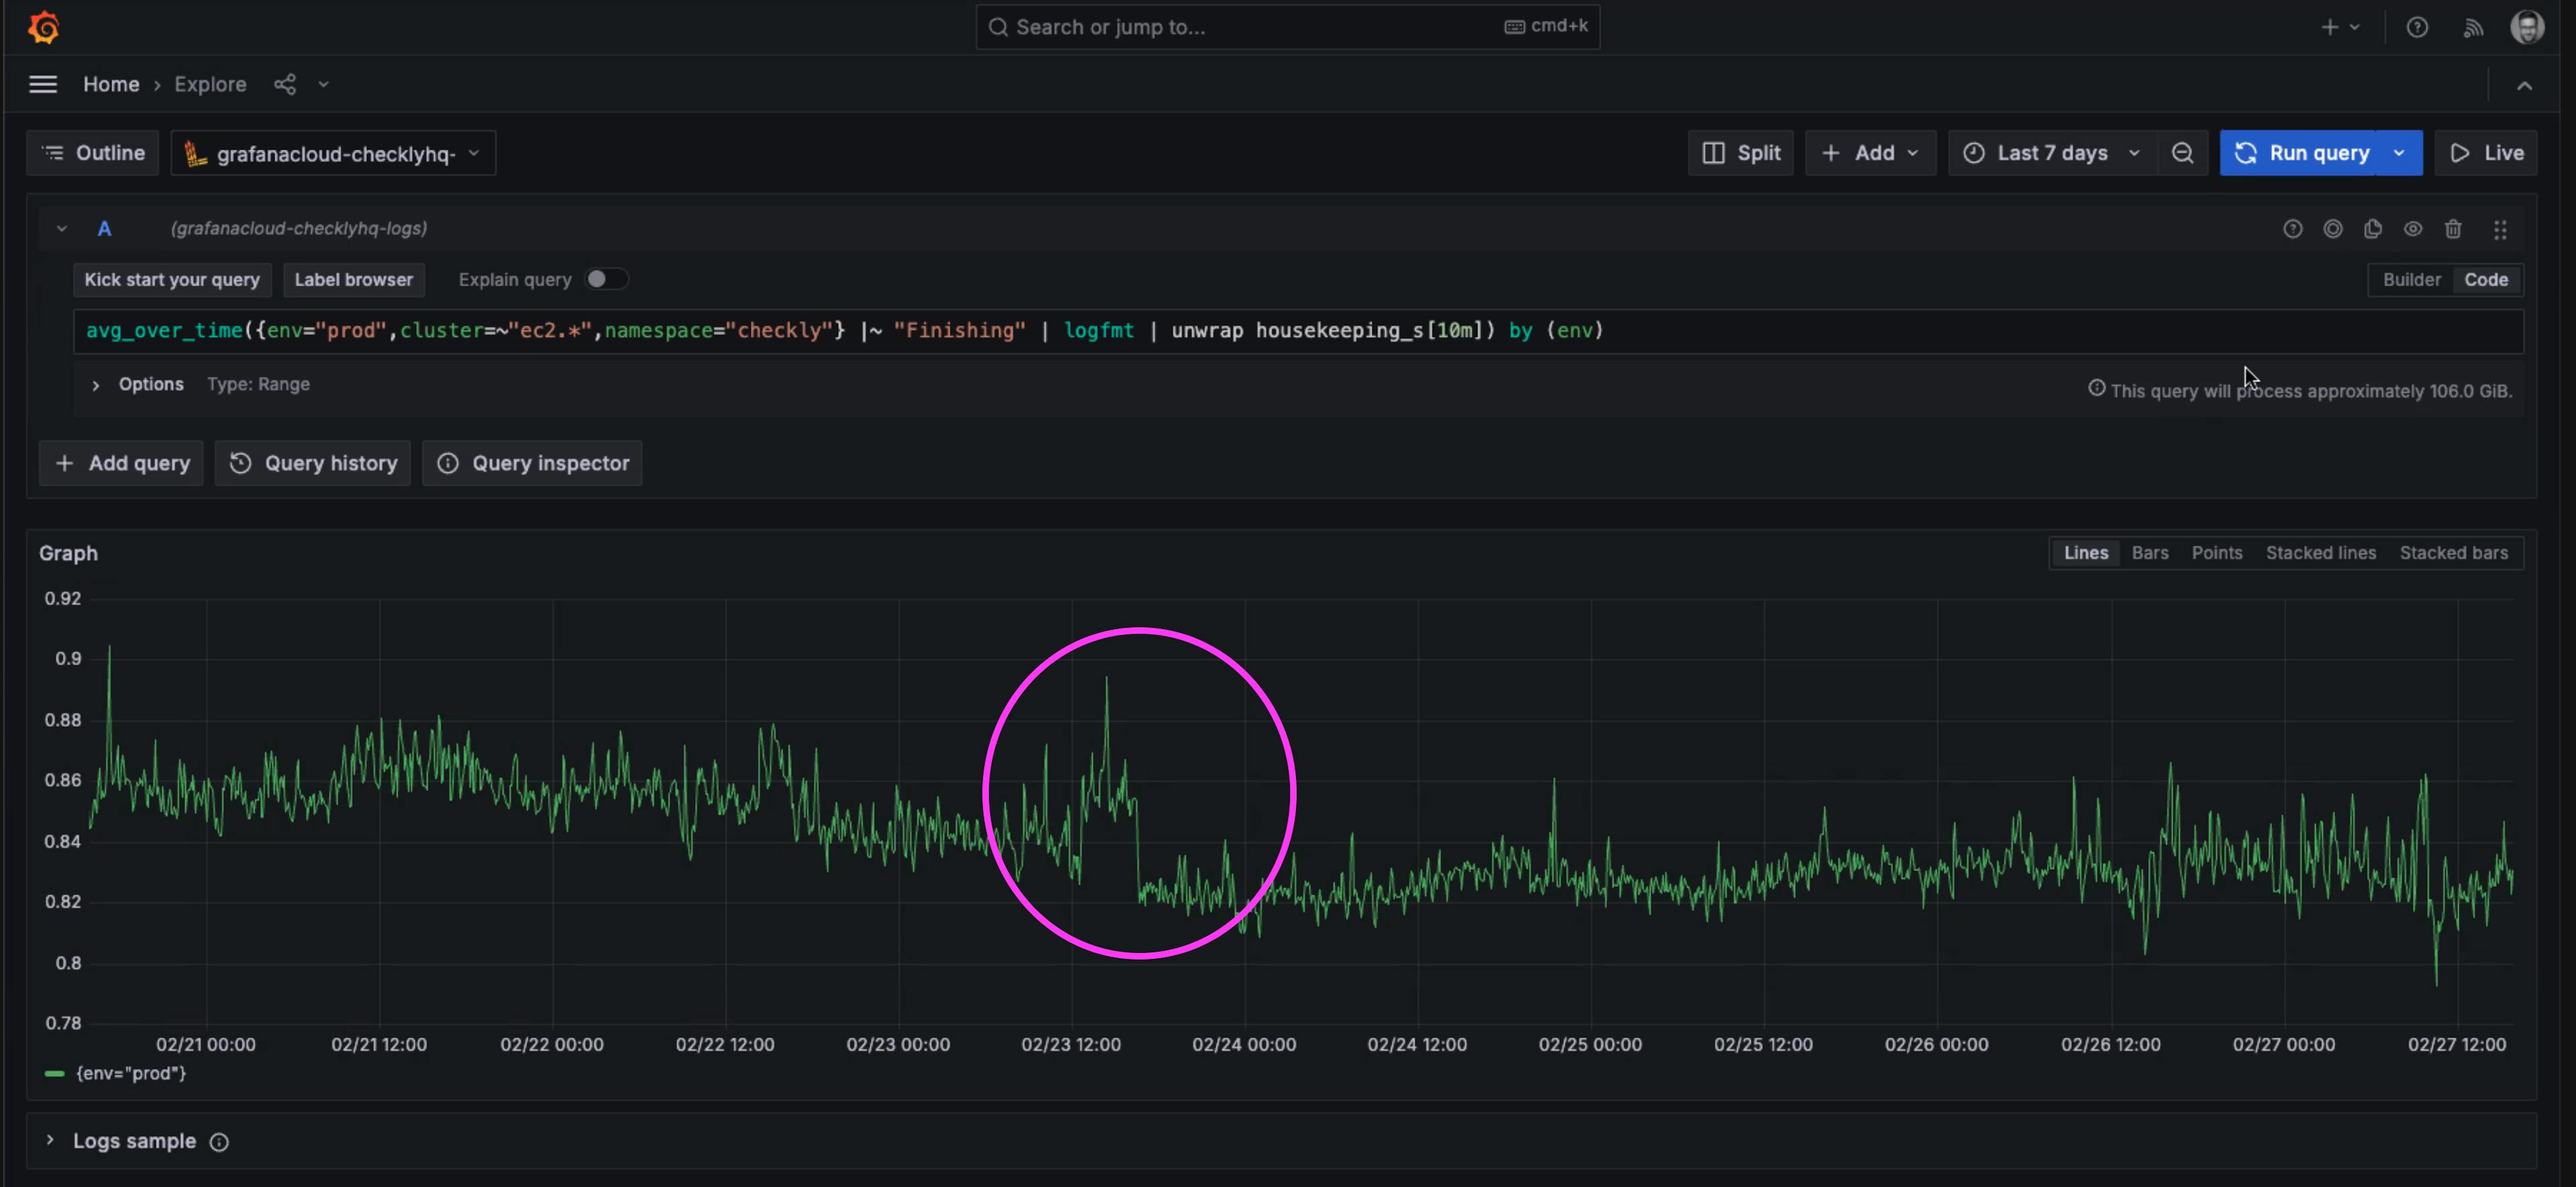
A drop in 40 milliseconds of average execution time of the ‘housekeeping’ tasks run after every check.
It may not seem like much to reduce average times by 40 milliseconds, but these tasks ran after every single check. Recall that even a single page check run every 2 minutes, is over 20,000 checks per month. Given that Checkly runs hundreds of millions of checks per month, these 40 millisecond savings added up quickly.
40 ms * 250 million checks / 3,600,000 milliseconds per hour = 2,777 hours of execution time
That means that in a single month of checks, we saved over 115 days of execution time! The result is slightly faster performance for every user, and a big impact on our infrastructure costs as we pay for less compute time to complete the same tasks.
Conclusions — Monitor everything you can, also OpenTelemetry Rules
Observability is about reducing the unknown unknowns — the unwanted surprises. This isn't about catching every possible error before it happens—that's an unrealistic goal. It's about having the visibility to understand and improve our systems in ways we hadn't anticipated. Part of our vision at Checkly is that with tools like the Checkly CLI we can empower every engineer to have a hand in their monitoring tools. This ‘Monitoring as Code’ (MaC) workflow means that you can reduce the number of surprises by letting experienced engineers help monitor the systems they know best.
Why Observability Matters
The narrative here underscores a fundamental truth: no matter how thorough your testing or how clean your code, unforeseen issues will arise. SDKs will behave differently under varied conditions, and what works in a controlled test environment doesn’t exactly equal real-world operations. Some issues happen only in server environments (not locally), and OTEL is a great tool to introspect what is really happening inside a deployed and running application. Observability tools like OpenTelemetry provide the lens through which we can observe these conditions, understand their impact, and respond effectively.
Open standards matter. It’s why we at Checkly support the open-source Playwright library for writing all our site checks, allowing sophisticated site interactions like visual regression testing and waiting for elements automatically.
Coralogix for OpenTelemetry
Just as critical as capturing trace data about your most important processes, is having an easy way to view and share that data across your organization. At Checkly, we know our synthetics monitoring data wouldn’t be half so useful without an intuitive data to browse what we’ve measured.
For OpenTelemetry data on your backend services, Coralogix is a great place to send that data and analyze what you find.
This issue was easily observable using the Coralogix dashboard to sort and filter our OpenTelemetry data. Combine your telemetry data and Coralogix to supercharge your system’s observability.
The Impact of Small Fixes
The resolution of our issue—a seemingly minor optimization—had a profound impact on operational efficiency and cost, saving thousands of hours of execution time. Sometimes, it's about looking through a trace for what doesn’t ‘fit’ and finding out if others have experienced the same thing.
Moving Forward: Checkly x Coralogix
OpenTelemetry promises big things for the storing and sharing of monitoring data. It was with OpenTelemetry standards for sending traces that the Checkly team implemented our Coralogix integration to send our synthetic user monitoring traces to your Coralogix dashboard. Check out our recent announcement on the new integration.
Final Thoughts
The insights gained from a well-monitored system can guide optimizations, inform architectural decisions, and ultimately, lead to more resilient and efficient applications. That’s why we support the Monitoring as Code workflow, where tools like the Checkly CLI can help you shift monitoring to be part of every developers’ workflow, running and deploying tests right from the command line.
In conclusion, monitor everything you can. The insights you'll gain are invaluable. And yes, OpenTelemetry rules.