What is alert fatigue?
It’s 1am, and something has gone very wrong. The head of sales is in the incident response channel because our top customer is reporting a system-wide outage. Everyone’s running around trying to figure it out. As you look at service maps and traces, you get a sinking feeling. Earlier the previous evening, you got an alert that user-access-service was running out of memory. You’d gotten the same alert a few times a day for the last two months, and each time by the time you accessed the service either the process eating memory had died or garbage collection had kicked off. It was a false alarm every time. It was on your list to investigate, but for the time being every time you saw user-access-service on an alert you just swiped it away and went about your day. Now you were realizing that this time it wasn’t a false alarm, and you were going to have some very weird numbers for time-to-detect and time-to-resolve at the post-mortem for this incident.
The scenario above is one we can all relate to: an alert that could be safely ignored for days or weeks suddenly showed up as the first indicator of real problems. No one decided to let our service fail, and we meant to improve the situation at some point, but it was allowed to continue until it caused, or at least failed to prevent, an outage and an SLA breach. If your team practices blameless post-mortems, the cause won’t be ‘laziness’ or ‘failure to investigate alerts’ but a more subtle, insidious and universal failure: alert fatigue.
As this article will explore, alert fatigue is the limiting factor on the scale of monitoring and alerting. Alert fatigue must be monitored as closely as infrastructure cost and team happiness if you want to ensure your team will take the right actions to prevent an outage.
Alert fatigue is a hidden cost of observability that significantly affects the job satisfaction and well-being of Site Reliability Engineers (SREs), Operations Engineers, and Developers, especially those on an on-call rotation.
How Alert Fatigue Happens
Alert fatigue didn’t start with APM, but the prevalence of advanced observability tools have made the issue more widespread. Observability allows teams to monitor their systems in real-time, anticipate issues, and respond swiftly to ensure uninterrupted service. Almost all observability tools offer integrations with notification infrastructure to let you tell the right people when a problem gets serious, Checkly is no exception with detailed notification settings and alert thresholds. When we turn our thresholds for alerting too low, however, the result is alert fatigue. If most alerts can be safely ignored, humans will stop examining each alert closely and instead ignore all alerts until something notifies them at a higher level. In the scenario offered above, this higher alert level was a user talking to their AE, and the sales team getting in touch with Operations.
One contributing factor to alert fatigue is the prevalence of alerts delivered to mobile devices and engineers receiving alerts outside their working hours. In my experience, when alerts are delivered to your phone but investigating that alert requires opening your laptop, it's more likely that a few false alarms will quickly lead an engineer to start dismissing almost all alerts out-of-hand unless the alert type is unusual.
Alert Fatigue is Universal
When researching this article, I ran across some research from the National Institutes of Health (NIH) describing how it was the number and repetition of alerts, not the underlying workload of the recipient, that caused alert fatigue. In this case, it wasn’t Operations engineers getting alerts on memory leaks, but doctors getting alerts on patient drug interactions, but the principle remains the same: even when the baseline workload is manageable, repetitive alerts causes people to stop accepting new information and acting appropriately.
In the study mentioned above, the critical factor for an alert to be ignored by a doctor was the number of times the same patient had produced an alert. There’s clearly a cognitive bias for ‘oh, this source always alerts.’ That makes it more likely that you’ll ignore crucial alerts.
Alert fatigue causes more than increased time-to-resolution
Imagine being bombarded with hundreds of alerts daily, with a significant portion being false alarms or non-critical. Over time, this constant barrage can desensitize even the most dedicated professionals, leading to slower response times, missed critical alerts, and, ultimately, a decrease in system reliability. This situation not only threatens the stability of services but also erodes the job satisfaction of those tasked with maintaining them. Acknowledging and addressing alert fatigue is essential in safeguarding not only our systems, but also the people who keep them running.
The Risks of Alert Fatigue
We all know the risks of not getting an alert: missed outages, broken SLA’s, and eroded trust with users. But when we turn up alerting too high, what are the risks we run there?
Missed Alerts
The first and most obvious consequence of alert fatigue is the number of times alerts are simply missed. Any time we get more than a few alerts an hour during working hours, or more than a few times a day when not working and on call, it’s likely that some alerts won’t be read or fully interpreted. Every unecessary alert increases the chance that the most critical alert will be ignored. This isn’t a human failure or the result of laziness, but rather the natural outcome of burying critical signals in a lot of noise.
Burnout
Tech workers are, by and large, quite generous with their time and availability. Whether it’s a weekend hackathon or a ‘quick question’ on Slack, we tend not to strictly enforce our time boundaries. Teams like Checkly have great work-life balance, insisting that work only happen during our scheduled hours, so when we get a late-night ping we can be quite certain it’s an emergency.
When we ping our team members too often, both trust and work-life balance quickly get broken. Every time I look at my phone and see a ‘critical’ alert that turns out to be nothing, my weekend gets slightly worse. If alerts are coming several times every day when I shouldn’t be working at all, I start browsing LinkedIn to look for my next role.
If we let alert fatigue get out of hand, we increase the risk of losing our best team members.
7 best practices to fight alert fatigue with Synthetic Monitoring
Synthetic monitoring is still sometimes referred to as a ‘site pinger’ that repeatedly checks your site. How can such a high-frequency service check be part of the solution for alert fatigue? There are three key themes to synthetics monitoring best practies:
- Ensure the flows being tested are critical to actual users.
- Give reliable alerts with retries and alert thresholds.
- Work from a shared repository that makes tests easier to maintain.
Synthetic monitoring, when executed with best practices, serves as a critical tool for ensuring that alerts are meaningful and actionable, especially in scenarios where immediate attention is required. Here's how synthetic monitoring can be optimized to combat alert fatigue:
1. Don’t hard-code waiting time
If you’re using an older testing framework, you may be used to directly coding wait statements in seconds to wait for elements to load or respond. This has two major drawbacks: it increases the minimum time for a test to execute, and can cause too-rigid tests that fail too frequently.
We’ve all interacted with a test suite before where “those 40 tests always fail” and we want to avoid that situation as much as possible.
If you use a modern testing framework like playwright, you don’t need to add manual wait times, since playwright will automatically wait until an element is available. Of course, if slow loading is the problem you’re most worried about, you can always set a threshold for the maximum time allowed for the test.
By storing this threshold in the test configuration rather than buried in individual lines of code (often with manual waits you have to add up several lines to calculate the maximum test time), you enable others to easily audit and tweak these test expectations. This is further empowered if you implement Monitoring as Code, as described in point six below.
2. Focus on Crucial User Flows
Synthetic monitoring should prioritize testing the most critical user flows. This user-centric approach ensures that the monitoring efforts are directly tied to the user experience, making each alert an indicator of potential user impact.
As a practice, try writing test names in terms of user expectations. This isn’t a full ‘user story’ format but rather just describing what the user is trying to do for example: user_login_and_check_profile rather than frontend_test_37. If you find that you can’t summarize what your test is checking, or you need to describe your test in terms of the systems its checking (for example recent_browsing_dropdown), it’s possible that you aren’t checking a critical user flow.
3. Implement Smart Retries
You don’t always want to get an alert every single time an element can’t be found on a page, or an image takes more than 7 seconds to load. Incorporating smart retries into your synthetic monitoring strategy helps differentiate between transient glitches and persistent issues. By automatically retrying a test before firing an alert, you can filter out temporary network hiccups or short-lived server issues, ensuring that only verified, consistent problems trigger notifications.
Checkly offers three retry strategies for most checks (except Heartbeat checks) and check groups, allowing customization based on the specific needs of your monitoring setup:
Fixed sets a single flat interval between retries, Linear increases the increment arithmetically, and Exponential multiplies the interval with each retry, e.g., 5 seconds, then 25 seconds, then 125 seconds. If your test is kicking off a heavy duty compute process, exponential can help ensure that it’s not your own retries that are causing a slowdown.
With Checkly you can also set a cap on the total time spent in retries to avoid excessive attempts. This duration includes the execution time of the check itself. For instance, if the maximum is set to two minutes and the check takes 1.5 minutes to run, only 30 seconds are available for retry attempts.
4. Label test steps
Going back to the research cited in the introduction, it’s repetitive alerts that trigger fatigue. If you can offer as much information to the engineer as possible in the report on a failed check. To this end, break down more complex tests into well-labeled steps. In Playwright you can create steps as a top level organization of the pieces in your test.
These steps can then be viewed in the generated HTML report, providing a high-level overview of the test's flow. This not only makes it easier for someone new to the test to understand what's happening but also aids in debugging by pinpointing which step failed.
Adding steps, along with point six about embracing monitoring-as-code also has the knock-on effect of making your entire set of tests more maintainable. When you go back to work on a test 6 months after you first wrote it, you’ll be glad you included steps to show your intent with each chunk.
5. Use visual tools for faster interpretation
Utilizing visual regression testing and screen captures can provide deeper insights into the issues detected. Visual regression testing allows you to spot unintended changes in the UI, while screen captures can offer immediate visual context to the problem at hand. When our engineers are using mobile devices or otherwise aren’t using their main PC to investigate, a picture can really be worth a thousand words. Take an example like the one below:
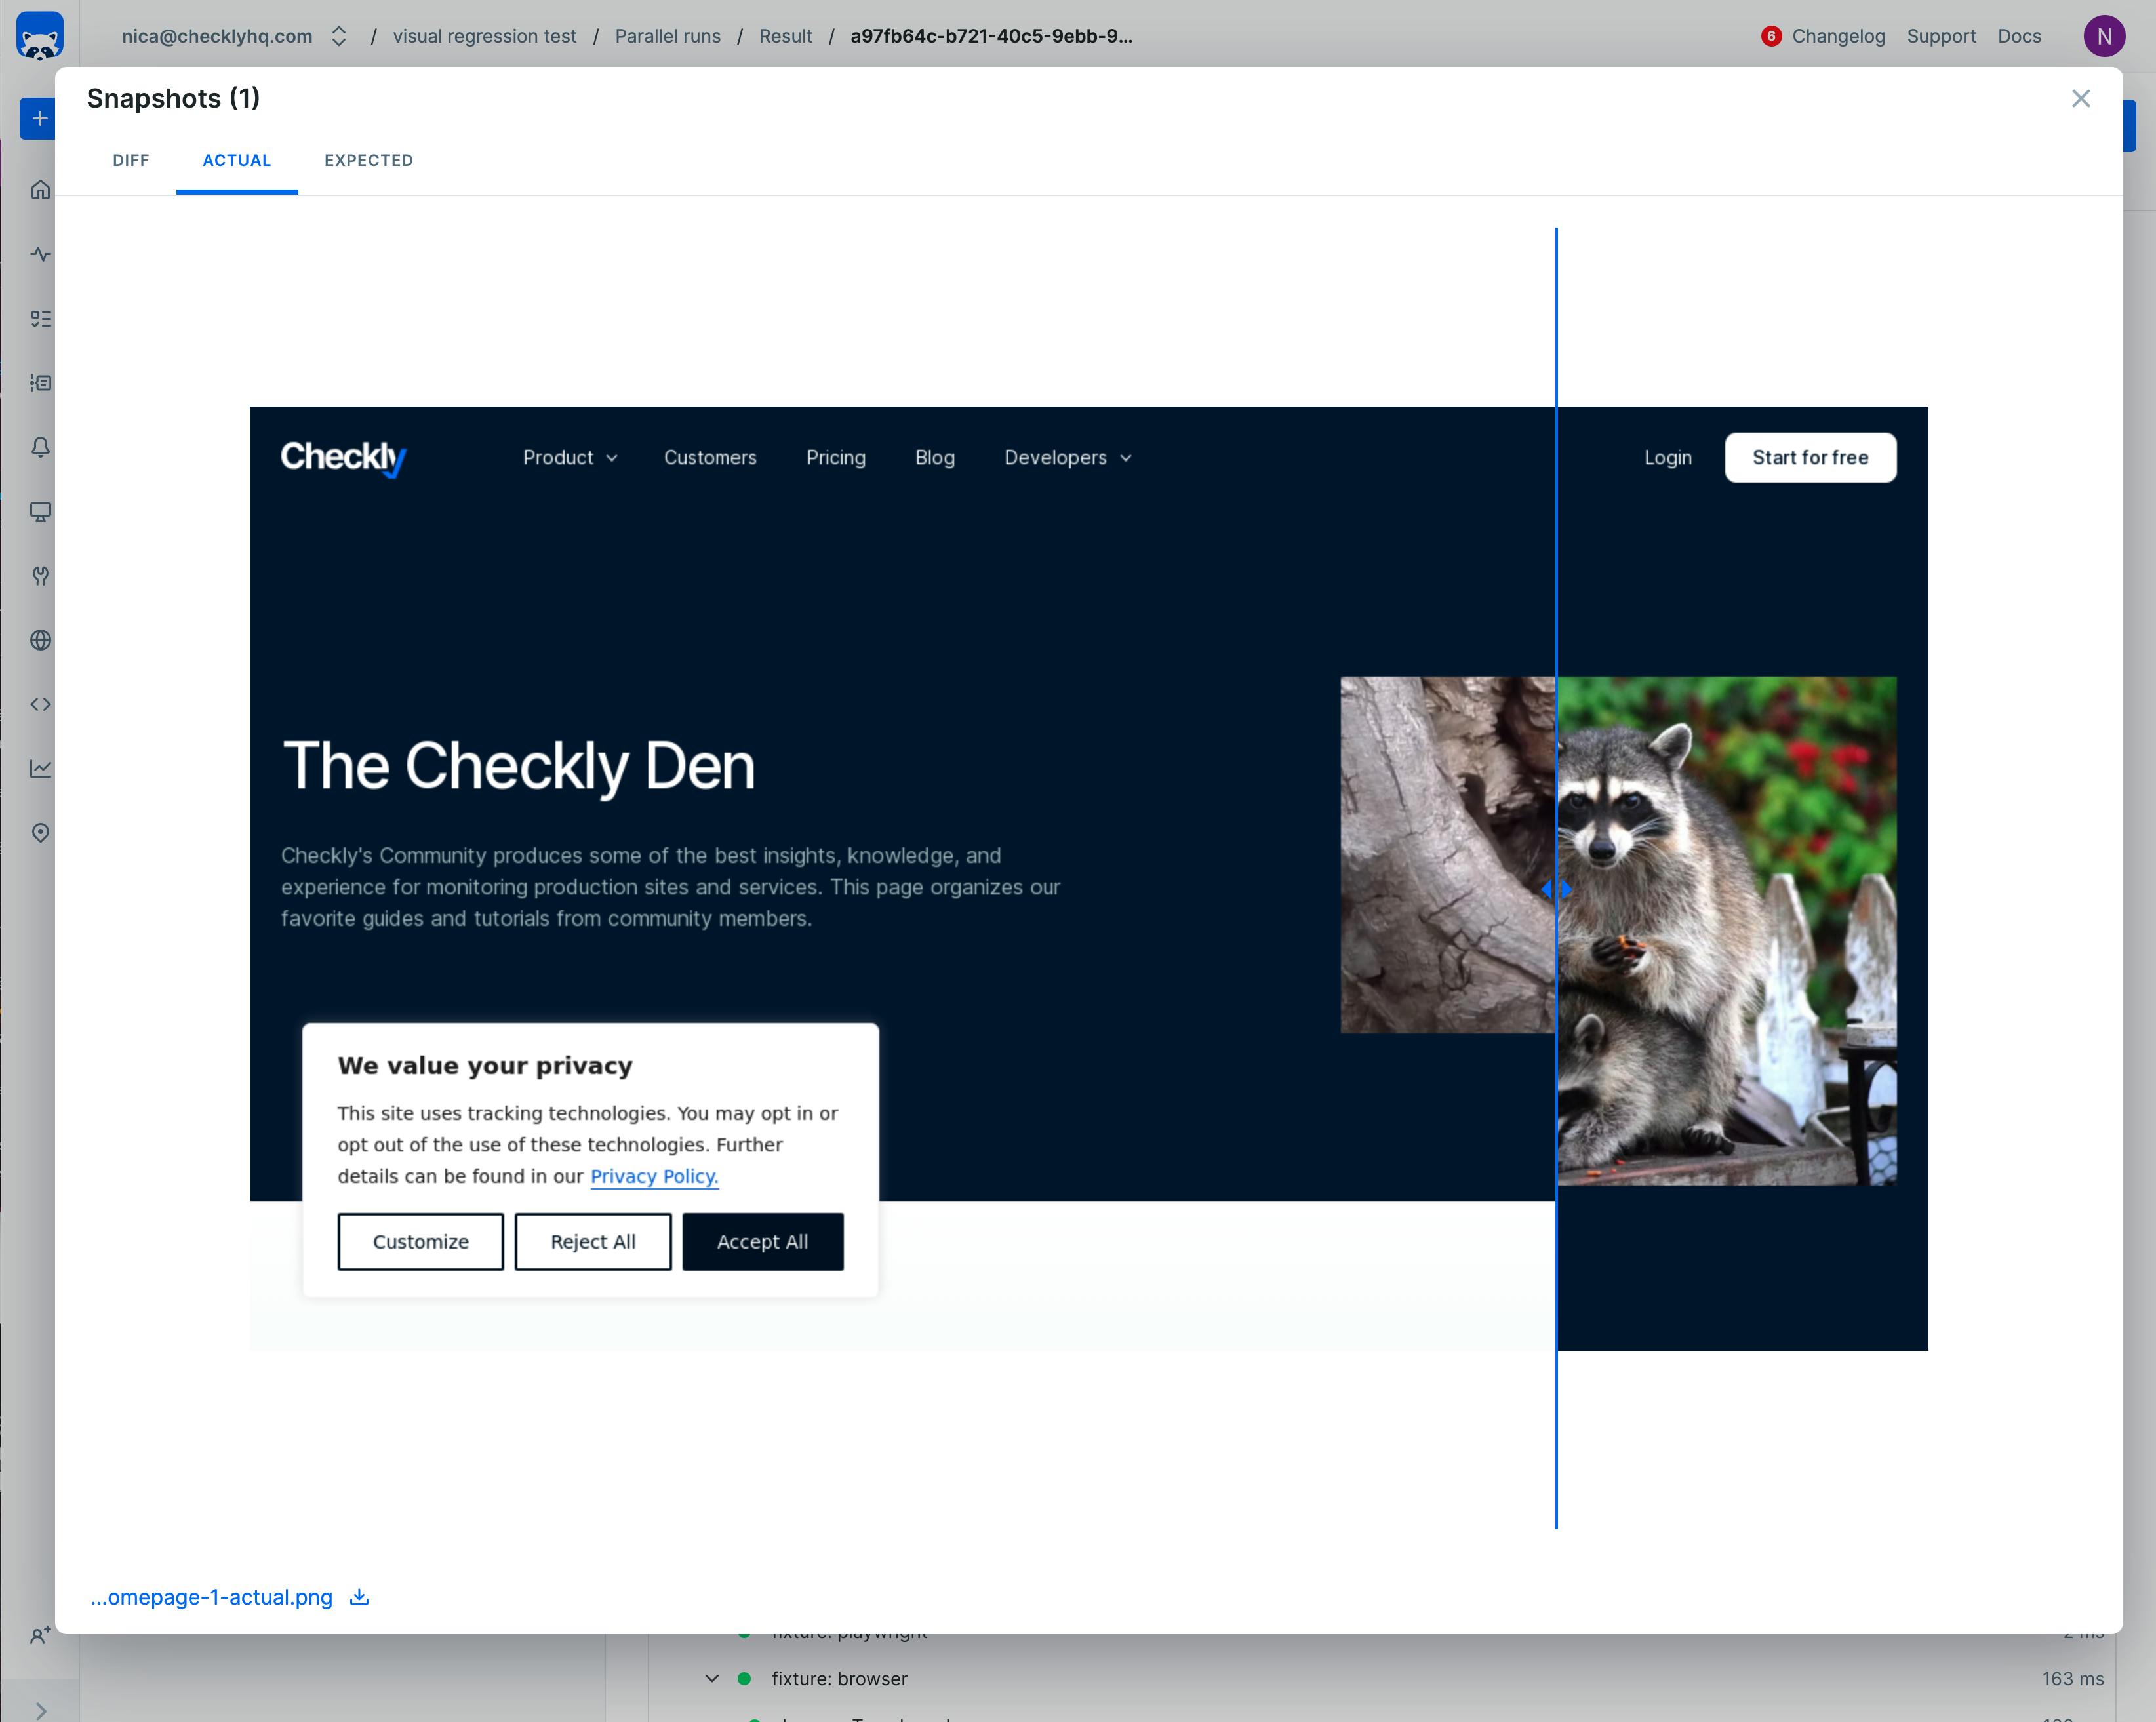
A visual regression test letting the engineer compare the current screenshot to the ‘golden’ version.
This visual regression test triggered an alert, but a quick view of the changes identifies there’s no missing components or broken UI, it’s just that someone swapped a visual asset without updating the test. With this view, the engineer can quickly decide if they need to investigate right away or if the alert can be safely ignored. The result is a faster time to understanding and better experience for your on-call team.
6. Embrace Monitoring as Code (MaC)
Fundamentally, alert fatigue is often a sign of tech debt within our testing system. In the intial scenario offered in this article, we knew that a daily alert shouldn’t be firing and resolved to fix it ‘at some point’ but it was allowed to continue for some time. The more you make your tests easy to maintain and modify, the more relevant your alerts, and the less the risk of alert fatigue.
Sadly, in a tech world that adopted source control for application code a decade ago, still many monitors and alerts are managed only through a browser interface, often with no clear change history or signing of edits. To create truly maintainable tests, you must break this old system and create a shared repository of your tests and their configuration.
Adopting a Monitoring as Code (MaC) approach for synthetic monitoring ensures that your monitoring setup is as version-controlled, maintainable as your application code. With a tool like the Checkly CLI you can write tests locally, merge them to a shared repository, and then deploy the updated tests to Checkly. While writing your tests, you can also run them through the checkly system without having to edit existing monitors.
MaC facilitates easier maintenance, scalability, and collaboration across teams, significantly reducing the likelihood of outdated or irrelevant alerts.
7. Set your monitoring cadence and alert thresholds based on your SLA
We’ve talked above about setting the ‘right’ thresholds for alerts and retries, but how do you decide the right configuration? More over, how do you decide how often to run tests in the first place? To make sure you’re doing enough monitoring without drowning your SRE’s in alerts, set your monitoring cadence based on your SLA. Here’s a guide I wrote last month to help calculate the right monitoring cadence.
Further, think about your own history of incidents and their causes and resolutions to decide if parallel or round-robin scheduling is right for your team. With parallel scheduling, you’ll run checks simultaneously from multiple geographies and fine single-region failures much faster. With round-robin you can run fewer total checks by running each test from a single location.
Conclusion: synthetics can lessen alert fatigue
Synthetic monitoring, when tailored to focus on user-centric flows, maintained through Monitoring as Code, and enhanced with smart retries and reliable tests, becomes an invaluable asset in reducing alert fatigue. By ensuring that alerts are meaningful, actionable, and indicative of real user-impacting issues, engineers can trust the system to wake them only for matters that require immediate attention. With correctly configured synthetics monitors, we can expect fewer alerts, and the alerts we do get should show that something important is broken for users.
If you’d like to discuss alert fatigue, what you’ve experienced and how you try to solve it, connect with us at the Checkly Slack and meet other engineers dedicated to the best possible Synthetics experience.