What are TCP Monitors?
Use TCP monitors to verify that your non-HTTP services are working as expected. TCP monitors work by establishing a connection to a host and port, then checking the speed and validity of the response. For example, use these checks to verify that:- Your mail server is online and responds to IMAPS requests quickly
- Your FTP server responds correctly to commands
- Your custom TCP-based service returns the expected response when sent a health check message
How TCP Monitoring Works
TCP monitors perform connection-level checks:- Connection Attempt - Establishes a TCP connection to your service
- Port Verification - Confirms the service is listening on the specified port
- Response Validation - Optionally validates service responses based on your configured assertions
TCP Monitor Results
Select a specific check run to review its results: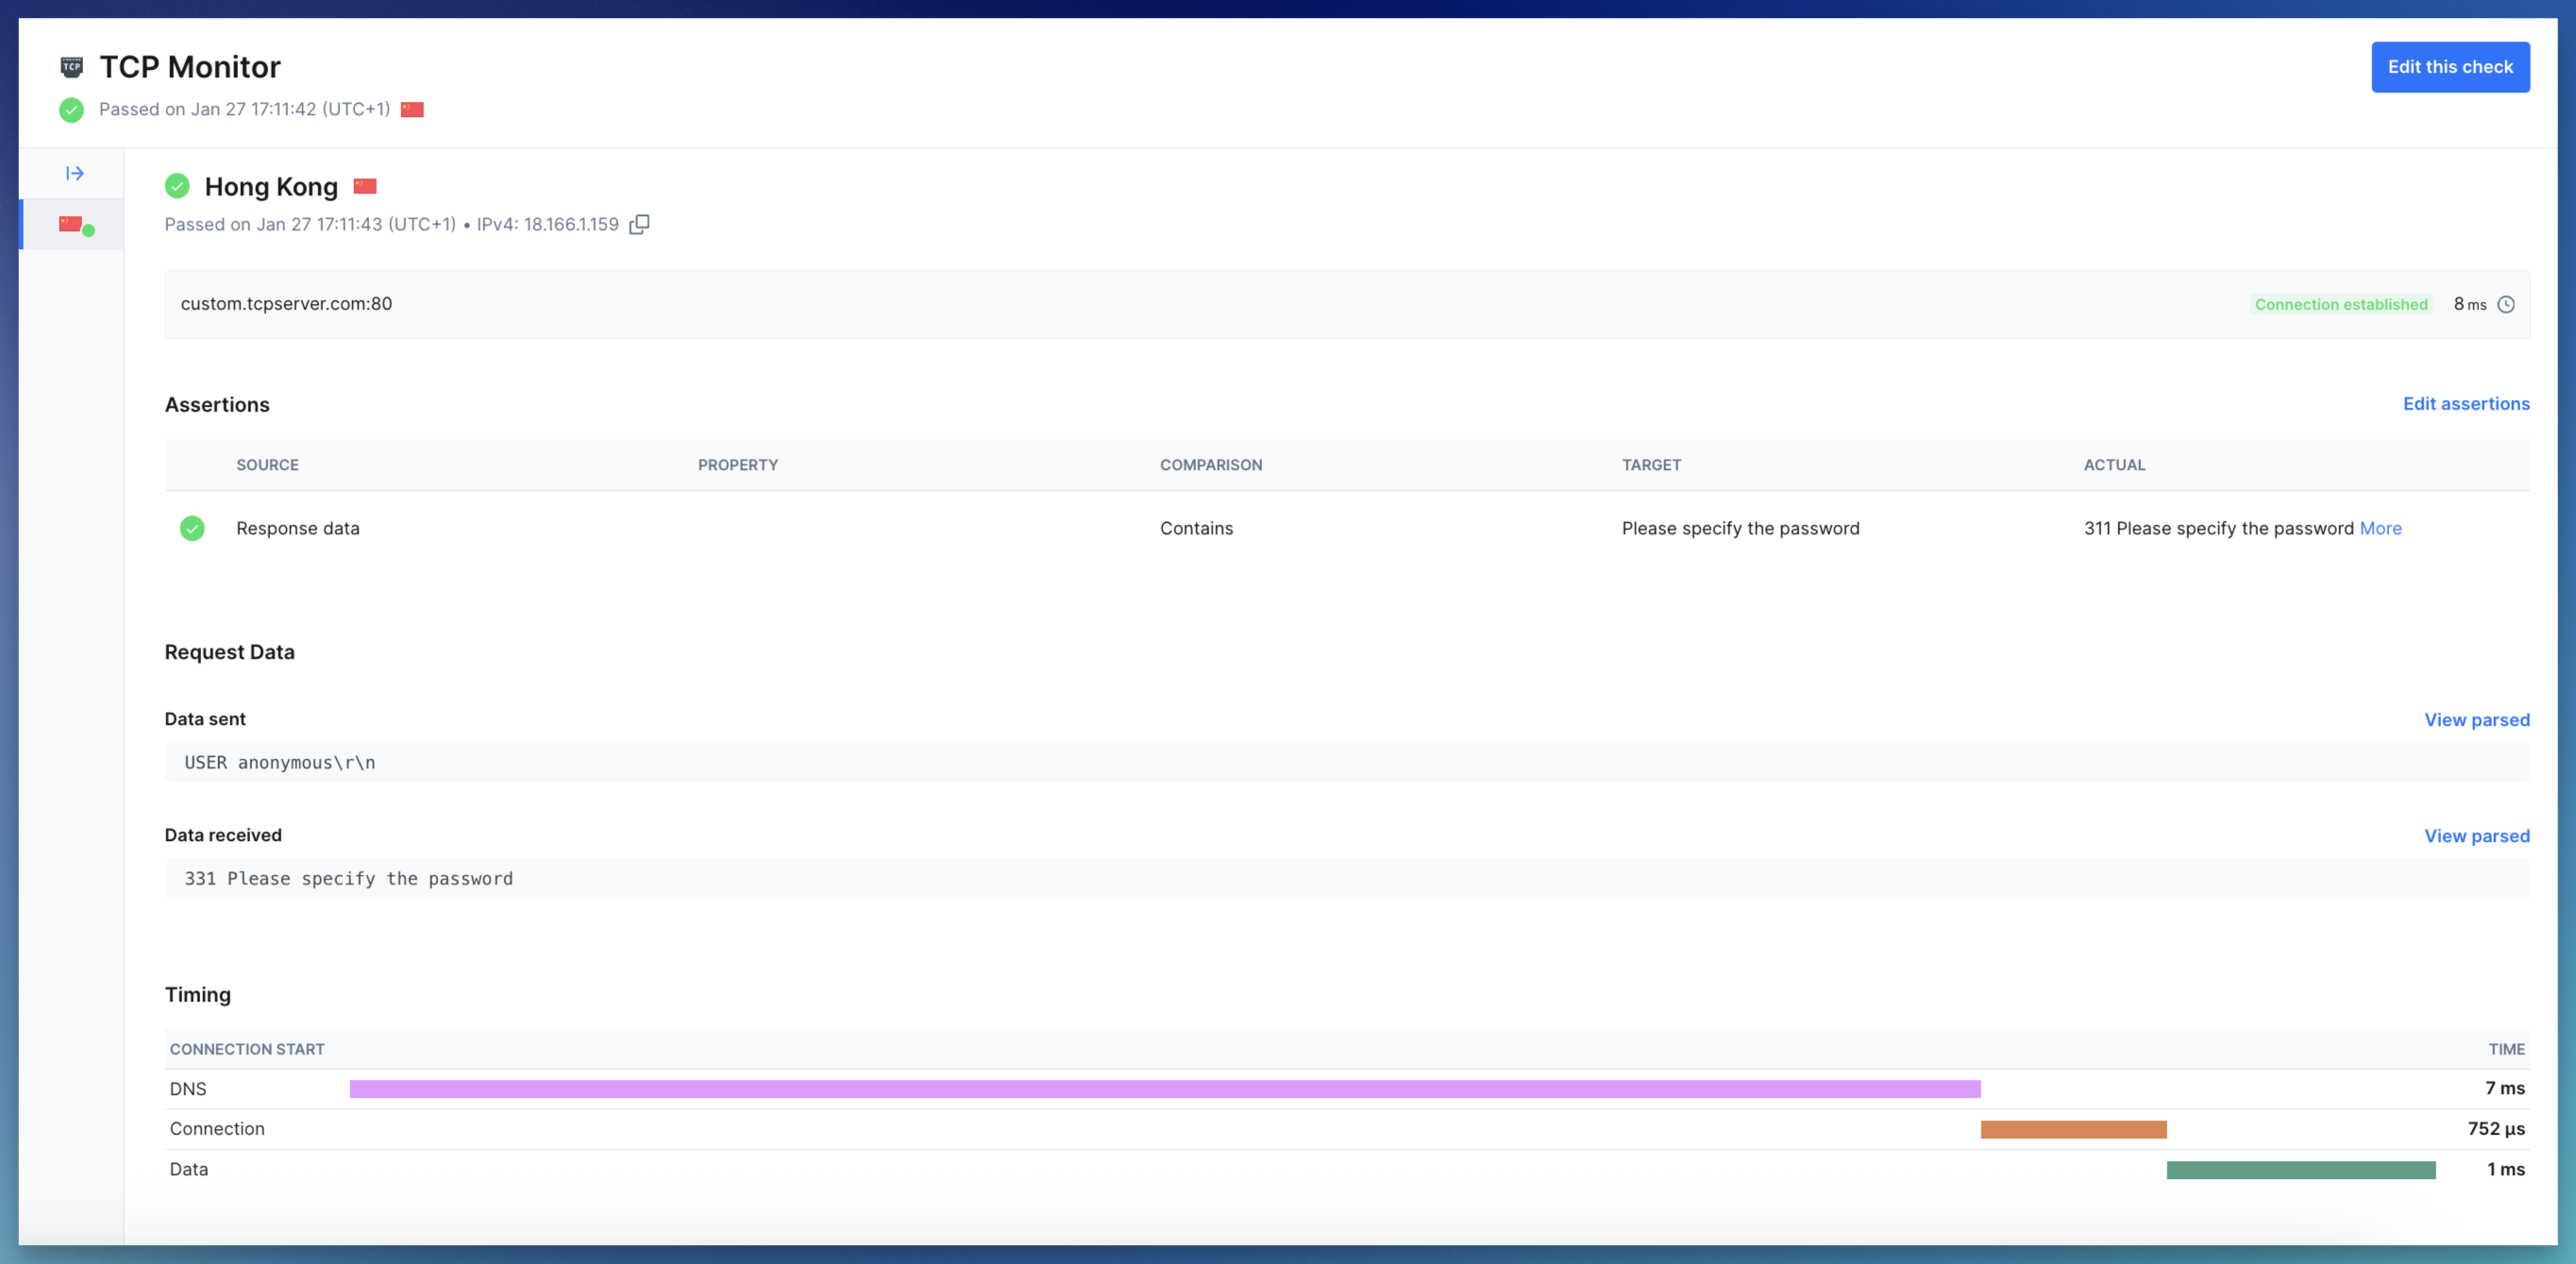
-
Summary: Displays the monitor target (hostname and port), the monitor state (
successfor passed and degraded runs, orerrorfor failed runs), the request status code and the total check run duration - Error details: If the check failed, the error status code and message log will be shown
- Request data: If a payload was sent, it is shown alongside the response received from the server
-
Timing phases: For each request, we capture the following timing metrics:
- DNS: Time taken to resolve the hostname to an IP address (if a hostname was provided)
- Connect: Time taken to establish the TCP connection (SYN, SYN-ACK, ACK)
- Data: Time taken to send the payload and receive the response data